
Lexiton International
Lexiton International Welcome to Lexiton International
LICQual Level 3 Certificate in Quality Control and Quality Assurance (QA/QC) in Civil Engineering
Section 1: Unit No 1: Introduction to Quality Control and Quality Assurance in Civil Engineering
Section 2: Unit No 2: Quality Management Systems and Standards
Section 3: Unit No 3: Quality Planning and Documentation
Section 4: Unit No 4: Quality Inspection and Testing in Civil Projects
Section 5: Unit No 5: Statistical Process Control and Quality Improvement
Lesson No 1: Statistical Process Control and Quality Improvement
Section 6: Unit 6: Non-Conformity Management and Corrective Actions
Lesson 5

Lesson No 1: Statistical Process Control and Quality Improvement

In today’s highly competitive construction industry, delivering projects that consistently meet quality, safety, and client expectations requires more than routine inspections. It demands a proactive, data-driven approach to monitoring and improving construction processes. Statistical Process Control (SPC) has become one of the most effective quality management techniques for identifying process variation, preventing defects, and ensuring that construction activities remain within specified quality limits. From concrete strength testing and asphalt compaction to reinforcement placement, welding quality, dimensional accuracy, and material inspection, SPC enables Quality Assurance (QA) and Quality Control (QC) professionals to make informed decisions based on measurable evidence rather than assumptions. By analysing process performance using statistical tools, construction organisations can detect early warning signs, minimise costly rework, improve compliance with project specifications, and enhance overall operational efficiency.

This lesson explores the principles, techniques, and practical applications of Statistical Process Control and Quality Improvement from the perspective of a QA/QC Construction Specialist. Learners will gain a comprehensive understanding of process variation, control charts, process capability, sampling methods, trend analysis, and continuous improvement methodologies used throughout the construction lifecycle. The lesson also demonstrates how statistical data supports root cause analysis, corrective and preventive actions (CAPA), risk-based decision-making, and compliance with recognised quality management systems such as ISO 9001. By the end of this lesson, learners will be equipped with the knowledge and practical skills needed to apply statistical quality control techniques, improve construction quality performance, reduce defects, optimise resource utilisation, and contribute to the successful delivery of safe, durable, and high-quality construction projects.

1. Understand the Application of Statistical Process Control (SPC) Tools and Techniques in Monitoring and Improving the Quality of Civil Engineering Processes

Statistical Process Control (SPC) is one of the most effective quality management methodologies used in modern civil engineering and construction projects to monitor, control, and continuously improve construction processes. Unlike traditional quality inspection, which focuses on identifying defects after work has been completed, SPC adopts a proactive approach by analysing process data during construction activities. This enables Quality Assurance (QA) and Quality Control (QC) professionals to identify trends, detect abnormal variations, and implement corrective actions before defects become costly problems.

In civil engineering, every construction activity from earthworks and foundation construction to reinforced concrete placement, steel fabrication, road construction, bridge erection, and utility installation contains natural variations. Some variations are expected because of environmental conditions, equipment tolerances, material properties, and human factors. However, excessive or unusual variations can compromise structural integrity, project quality, safety, and compliance with contract specifications.

SPC provides engineers with statistical tools that distinguish between acceptable process variation and unacceptable variation requiring corrective action. Rather than relying solely on visual inspections, SPC transforms quality management into a scientific, evidence-based process that supports objective decision-making.

Today, leading construction organisations incorporate SPC within Quality Management Systems (QMS), ISO 9001 frameworks, Lean Construction initiatives, Six Sigma methodologies, and continuous improvement programmes to achieve higher productivity, reduced waste, improved client satisfaction, and better project outcomes.

Why Statistical Process Control Is Important in Civil Engineering

Civil engineering projects involve thousands of interconnected activities where a single quality issue can affect multiple stages of construction. SPC enables project teams to monitor these activities systematically and maintain consistent quality standards throughout the project lifecycle.

Major reasons why SPC is essential include:

  • Reduces construction defects before they become critical.
  • Detects abnormal process variation at an early stage.
  • Improves consistency in construction workmanship.
  • Supports compliance with project specifications and engineering standards.
  • Enhances decision-making through statistical evidence.
  • Reduces material wastage and unnecessary rework.
  • Improves productivity and resource utilisation.
  • Increases client confidence in project quality.
  • Supports continuous quality improvement initiatives.
  • Provides objective quality records for audits and regulatory inspections.

Instead of waiting until completed work fails inspection, SPC allows QA/QC engineers to identify warning signs during production, making quality management preventive rather than reactive.

Objectives of Statistical Process Control

The primary objective of SPC is to maintain stable and capable construction processes capable of consistently producing work that meets engineering specifications.

Specific objectives include:

Process Stability

Ensuring construction processes remain predictable throughout project execution.

Variation Reduction

Minimising unnecessary fluctuations that affect construction quality.

Defect Prevention

Identifying potential problems before defective work occurs.

Data-Based Decision Making

Replacing assumptions with measurable statistical evidence.

Continuous Improvement

Using performance data to improve future construction activities.

Cost Optimisation

Reducing financial losses caused by defects, delays, and corrective work.

Regulatory Compliance

Demonstrating compliance with contractual specifications, international standards, and project quality requirements.


Fundamental Principles of Statistical Process Control

SPC is based on several fundamental quality management principles that allow construction professionals to understand process behaviour and improve quality performance.

Understanding Process Variation

Every construction process experiences variation.

Variation generally falls into two categories:

Common Cause Variation

This is natural variation inherent within the construction process.

Examples include:

  • Minor temperature fluctuations during concrete curing.
  • Small differences in aggregate grading.
  • Equipment operating within normal tolerances.
  • Acceptable differences in workmanship.

Common cause variation is expected and normally does not require corrective action.

Special Cause Variation

Special cause variation occurs because of unusual circumstances that disrupt normal operations.

Examples include:

  • Incorrect concrete mix design.
  • Equipment malfunction.
  • Improper reinforcement placement.
  • Calibration errors.
  • Untrained workers.
  • Faulty surveying equipment.
  • Material contamination.

These variations require immediate investigation because they may result in significant quality failures.

Key Components of Statistical Process Control
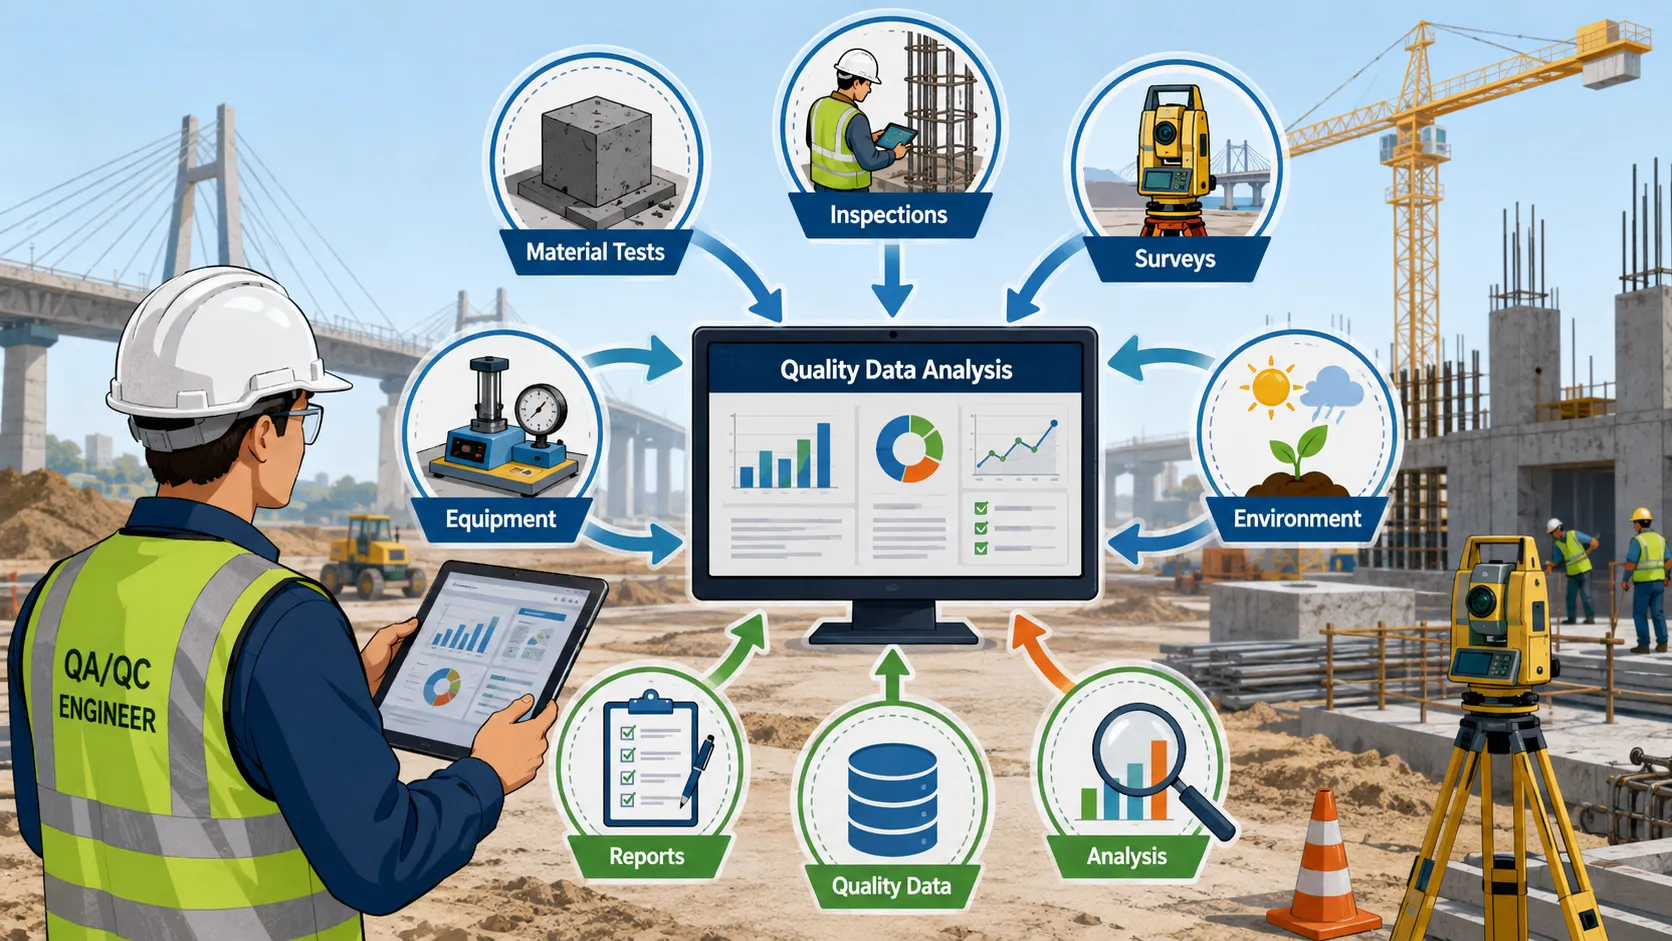
Quality control dashboard on construction site

Successful SPC implementation depends on several interconnected elements.

Data Collection

Reliable statistical analysis begins with accurate field data.

Examples include:

  • Concrete compressive strength results.
  • Asphalt density measurements.
  • Soil compaction test results.
  • Reinforcement spacing measurements.
  • Dimensional survey data.
  • Pipe alignment measurements.
  • Weld inspection reports.
  • Surface finish measurements.

Collected data should be:

  • Accurate
  • Consistent
  • Timely
  • Traceable
  • Representative of actual site conditions

Data Analysis

Once data is collected, engineers analyse trends to determine whether construction processes remain under statistical control.

Analysis may include:

  • Mean values
  • Range analysis
  • Standard deviation
  • Process capability
  • Trend identification
  • Distribution analysis

These statistical indicators provide objective evidence regarding process performance.

Process Monitoring

Continuous monitoring enables engineers to identify quality deterioration before it affects completed work.

Typical monitoring activities include:

  • Daily inspection records
  • Material testing
  • Laboratory verification
  • Site measurements
  • Equipment calibration checks
  • Environmental monitoring
  • Production rate analysis

Table: Core Components of Statistical Process Control in Civil Engineering

SPC ComponentDefinitionPractical Construction ExampleKey Benefit
Data CollectionSystematic recording of quality informationConcrete cube strength testingReliable quality evidence
Process MonitoringContinuous observation of construction activitiesMonitoring asphalt compactionEarly defect detection
Statistical AnalysisEvaluation of process performance using numerical methodsAnalysing reinforcement spacing measurementsObjective decision-making
Variation AnalysisIdentifying causes of quality fluctuationsInvestigating inconsistent concrete strengthRoot cause identification
Corrective ActionEliminating sources of abnormal variationRecalibrating faulty batching equipmentPrevents repeated defects
Continuous ImprovementOngoing enhancement of construction processesUpdating inspection procedures after lessons learnedImproved long-term performance

The Role of QA/QC Engineers in SPC

Quality professionals are responsible for ensuring that statistical process control becomes an active management tool rather than merely a reporting exercise.

Their responsibilities include:

  • Developing inspection and testing plans.
  • Establishing quality monitoring procedures.
  • Collecting accurate process data.
  • Reviewing laboratory test results.
  • Identifying process trends.
  • Investigating abnormal quality variations.
  • Coordinating corrective and preventive actions.
  • Preparing statistical quality reports.
  • Advising project managers on quality risks.
  • Ensuring compliance with project specifications.

A competent QA/QC engineer interprets statistical information to improve decision-making rather than simply recording inspection results.

Benefits of Applying SPC in Civil Engineering Projects

Implementing SPC provides measurable improvements across every phase of a construction project.

Key benefits include:

  • Higher construction quality.
  • Improved structural reliability.
  • Reduced rework and corrective costs.
  • Increased productivity.
  • Better resource management.
  • Enhanced client satisfaction.
  • Greater compliance with engineering specifications.
  • Improved risk management.
  • Stronger quality documentation.
  • Better audit readiness.
  • More effective project planning.
  • Increased confidence in engineering decisions.

Beyond quality control, SPC contributes to organisational excellence by creating a culture of continuous improvement, accountability, and evidence-based management.

Practical Example

During the construction of a reinforced concrete bridge deck, QA/QC engineers monitored the compressive strength of concrete delivered from the batching plant. Daily test results indicated a gradual decline in average strength, although all samples initially remained within specification. Statistical analysis revealed an increasing trend toward the lower control limit, signalling that the process was beginning to drift. Investigation identified inconsistent moisture content in the aggregates, which affected the water-cement ratio. The batching process was recalibrated, aggregate moisture was monitored more closely, and the concrete mix was adjusted. As a result, the process returned to a stable condition before any structural defects occurred, preventing costly repairs and project delays.

Common Statistical Process Control (SPC) Tools Used in Civil Engineering

Statistical Process Control relies on a range of analytical tools that help QA/QC professionals monitor process stability, identify abnormal variations, and improve construction quality. These tools convert raw inspection and testing data into meaningful information that supports informed engineering decisions.

Each SPC tool serves a specific purpose within the quality management process. When used together, they provide a comprehensive understanding of process performance and enable early intervention before quality issues become significant defects.

Control Charts

Control charts are among the most widely used SPC tools in construction quality management. They display quality data over time and compare actual process performance against predetermined statistical control limits.

Control charts help engineers determine whether a construction process is operating normally or whether corrective action is required.

Typical applications include:

  • Monitoring concrete compressive strength.
  • Tracking asphalt density results.
  • Measuring pavement thickness.
  • Monitoring reinforcement spacing.
  • Observing weld quality measurements.
  • Checking structural dimensions.
  • Monitoring pipe alignment tolerances.

Advantages of control charts include:

  • Early identification of abnormal trends.
  • Prevention of defective construction work.
  • Reduced inspection costs.
  • Improved process consistency.
  • Better forecasting of future performance.
  • Objective quality monitoring.

Histograms

Histograms graphically represent the distribution of collected quality data.

QA/QC engineers use histograms to understand whether process results are centred around the target value or spread across a wide range.

Construction examples include:

  • Concrete strength distribution.
  • Aggregate size variation.
  • Soil density measurements.
  • Asphalt compaction values.
  • Steel thickness measurements.

Benefits include:

  • Visual understanding of process variation.
  • Identification of inconsistent production.
  • Improved interpretation of laboratory results.
  • Better comparison of project performance.

Pareto Charts

Pareto charts identify the most significant causes of construction defects by arranging quality problems from highest to lowest frequency.

This follows the Pareto Principle (80/20 Rule), where a small number of causes often produce the majority of quality issues.

Typical defect categories include:

  • Honeycombing.
  • Surface cracking.
  • Reinforcement errors.
  • Dimensional inaccuracies.
  • Material defects.
  • Poor compaction.
  • Welding defects.

Using Pareto analysis enables project teams to focus improvement efforts on the issues with the greatest impact.

Cause-and-Effect (Fishbone) Diagrams

Fishbone diagrams assist engineers in identifying the root causes of quality problems rather than treating only the visible symptoms.

Common categories investigated include:

  • Materials
  • Methods
  • Machinery
  • Manpower
  • Measurement
  • Environment

Example:

If concrete strength repeatedly fails specification, engineers investigate:

  • Cement quality
  • Aggregate moisture
  • Water-cement ratio
  • Batching accuracy
  • Mixing time
  • Operator competence
  • Weather conditions
  • Testing equipment calibration

Check Sheets

Check sheets provide a structured method for collecting inspection data directly from construction sites.

Examples include:

  • Reinforcement inspection records.
  • Concrete placement checklists.
  • Formwork inspections.
  • Pipe installation inspections.
  • Welding inspection reports.
  • Material receiving inspections.

Benefits include:

  • Consistent documentation.
  • Reduced recording errors.
  • Faster data analysis.
  • Improved traceability.
  • Better audit preparation.

Scatter Diagrams

Scatter diagrams evaluate relationships between two quality variables.

Examples include:

  • Cement content versus compressive strength.
  • Compaction effort versus density.
  • Temperature versus concrete setting time.
  • Water content versus soil strength.

These diagrams help engineers determine whether one factor influences another and support evidence-based process improvement.


Process Capability in Construction Quality Management

Process capability measures the ability of a construction process to consistently produce work that meets engineering specifications.

A capable process produces results within specified tolerance limits without excessive variation.

Characteristics of a capable process include:

  • Stable production.
  • Predictable outcomes.
  • Minimal quality variation.
  • Low defect rates.
  • Consistent compliance with specifications.
  • Reduced rework.

QA/QC engineers evaluate process capability before approving production activities to ensure reliable quality performance throughout the project.


SPC Implementation Procedure in Civil Engineering Projects

Successful implementation of Statistical Process Control follows a systematic approach.

Step 1: Define Quality Requirements

Engineers identify:

  • Project specifications.
  • Client requirements.
  • Engineering standards.
  • Acceptance criteria.
  • Inspection frequencies.

Step 2: Select Critical Quality Characteristics

Important quality characteristics may include:

  • Concrete strength.
  • Reinforcement spacing.
  • Pavement thickness.
  • Pipe alignment.
  • Weld quality.
  • Surface finish.
  • Soil compaction.
  • Structural dimensions.

Step 3: Collect Reliable Data

Quality data must be:

  • Accurate.
  • Timely.
  • Representative.
  • Consistent.
  • Properly documented.

Step 4: Analyse Statistical Results

Engineers evaluate:

  • Average values.
  • Process trends.
  • Process variation.
  • Statistical control.
  • Capability indices.

Step 5: Investigate Abnormal Variation

When unusual patterns appear, engineers perform:

  • Root cause analysis.
  • Equipment inspections.
  • Material verification.
  • Workforce assessment.
  • Process review.

Step 6: Implement Corrective Actions

Possible actions include:

  • Equipment recalibration.
  • Material replacement.
  • Procedure revision.
  • Staff retraining.
  • Improved supervision.
  • Updated inspection procedures.

Step 7: Monitor Improvement

Following corrective action, engineers continue monitoring to verify:

  • Stable performance.
  • Improved consistency.
  • Reduced variation.
  • Compliance with specifications.

Practical Applications of SPC in Civil Engineering

Statistical Process Control supports quality improvement throughout every stage of a construction project.

Applications include:

Earthworks

  • Monitoring soil compaction.
  • Moisture content analysis.
  • Density verification.
  • Settlement monitoring.

Concrete Construction

  • Slump testing.
  • Compressive strength analysis.
  • Temperature monitoring.
  • Air content verification.
  • Curing performance evaluation.

Structural Steel

  • Weld quality monitoring.
  • Dimensional inspections.
  • Bolt tension verification.
  • Coating thickness measurement.

Highway Construction

  • Asphalt density control.
  • Surface smoothness evaluation.
  • Pavement thickness monitoring.
  • Material grading analysis.

Pipeline Construction

  • Joint alignment verification.
  • Pressure testing.
  • Wall thickness measurement.
  • Coating inspections.
  • Installation tolerance monitoring.

Industry Case Study

A contractor was responsible for constructing a multi-storey reinforced concrete commercial building. During routine quality monitoring, QA/QC engineers applied Statistical Process Control to evaluate the compressive strength of concrete produced by the batching plant. Although all test results initially met the specified acceptance criteria, the control chart indicated a gradual downward trend approaching the lower control limit.

Rather than waiting for a specification failure, the quality team initiated an investigation. Statistical analysis revealed increasing variation in aggregate moisture content caused by inconsistent stockpile protection during heavy rainfall. This variation altered the effective water-cement ratio, leading to fluctuating concrete strength.

Corrective actions included:

  • Installing moisture sensors.
  • Improving aggregate storage.
  • Recalibrating batching equipment.
  • Revising batching procedures.
  • Providing additional operator training.
  • Increasing inspection frequency.

Within one week, statistical data demonstrated that the concrete production process had returned to a stable condition with significantly reduced variation.

As a result:

  • No structural defects occurred.
  • Concrete quality became more consistent.
  • Material wastage decreased.
  • Rework costs were avoided.
  • Project delays were prevented.
  • Client confidence increased.
  • Quality audit findings improved.

This case demonstrates that SPC enables construction organisations to prevent defects rather than simply detecting them after work has been completed.

Best Practices for Applying SPC

To maximise the effectiveness of Statistical Process Control, organisations should adopt the following best practices:

  • Develop clear quality monitoring procedures.
  • Collect sufficient and reliable quality data.
  • Calibrate testing equipment regularly.
  • Train inspectors in statistical interpretation.
  • Monitor trends continuously rather than periodically.
  • Integrate SPC with ISO 9001 Quality Management Systems.
  • Use digital quality management software where appropriate.
  • Encourage cross-functional collaboration between engineers, laboratory personnel, and site supervisors.
  • Perform regular internal quality audits.
  • Review historical project data to support continuous improvement.

Challenges in Implementing SPC

Despite its advantages, organisations may encounter several challenges during implementation.

Common challenges include:

  • Incomplete or inaccurate data collection.
  • Limited statistical knowledge among construction personnel.
  • Poor calibration of testing equipment.
  • Resistance to organisational change.
  • Insufficient management support.
  • Inconsistent inspection procedures.
  • Environmental influences affecting measurements.
  • Budget limitations for quality improvement initiatives.

These challenges can be addressed through proper planning, competency development, leadership commitment, and continuous training.

Key Takeaways

  • Statistical Process Control is a proactive quality management methodology.
  • SPC focuses on preventing defects rather than detecting completed failures.
  • Statistical data supports objective engineering decisions.
  • Control charts help identify abnormal process variation.
  • Process capability evaluates whether construction processes consistently meet specifications.
  • SPC improves construction quality, productivity, and client satisfaction.
  • Continuous monitoring reduces waste, delays, and corrective work.
  • Successful implementation requires accurate data, trained personnel, and effective leadership.
  • SPC supports compliance with quality management systems, engineering standards, and contractual requirements.
  • Continuous improvement remains the ultimate objective of every Statistical Process Control programme.

Statistical Process Control has become an essential component of modern Quality Assurance and Quality Control practices within the civil engineering industry. By applying statistical techniques to monitor construction activities, engineers can distinguish between normal process variation and conditions that require immediate corrective action. This proactive approach enables organisations to minimise defects, improve consistency, optimise resource utilisation, and maintain compliance with engineering specifications throughout the project lifecycle.

For QA/QC Construction Specialists, SPC is more than a collection of statistical tools it is a strategic management approach that supports informed decision-making, risk reduction, and continuous quality improvement. When effectively integrated into construction quality management systems, SPC enhances operational performance, strengthens client confidence, reduces project costs, and contributes to the successful delivery of safe, durable, and high-quality civil engineering infrastructure.

2. Learn How to Use Data-Driven Approaches to Identify Areas for Improvement, Reduce Variability, and Optimize Project Outcomes

The construction industry is becoming increasingly reliant on data to improve quality, reduce project risks, and deliver infrastructure that meets stringent engineering standards. Traditional quality management often depended on visual inspections, personal experience, and reactive corrective actions after defects had already occurred. While these methods remain valuable, modern Quality Assurance (QA) and Quality Control (QC) systems have evolved to embrace data-driven decision-making as a proactive approach to managing quality throughout the construction lifecycle.

A data-driven approach involves collecting, analysing, interpreting, and applying factual information to make objective decisions that improve construction processes and project performance. Rather than relying on assumptions or subjective judgement, engineers use measurable data generated from inspections, laboratory testing, surveys, equipment monitoring, production records, and project performance indicators. This enables project teams to detect trends, identify areas requiring improvement, reduce process variability, and implement timely corrective actions before quality issues escalate into costly failures.

From a QA/QC Construction Specialist’s perspective, data serves as the foundation of continuous quality improvement. Every inspection report, material test result, equipment calibration record, and site observation contributes valuable information that supports better planning, improved risk management, and enhanced decision-making. Organisations that effectively utilise construction data consistently achieve higher productivity, lower defect rates, reduced rework, improved client satisfaction, and greater compliance with international quality management standards such as ISO 9001.

Developing the ability to interpret and use quality data is therefore an essential competency for engineers, quality managers, project supervisors, and construction professionals responsible for delivering safe, durable, and compliant civil engineering projects.

Understanding Data-Driven Decision Making

Data-driven decision making refers to the systematic use of factual information to evaluate construction processes and determine the most appropriate course of action. Decisions are based on measurable evidence rather than intuition or assumptions, making quality management more reliable, transparent, and consistent.

In civil engineering projects, valuable quality data originates from numerous sources, including:

  • Material testing laboratories
  • Site inspections
  • Survey measurements
  • Concrete strength testing
  • Soil compaction tests
  • Equipment calibration records
  • Welding inspection reports
  • Asphalt density measurements
  • Environmental monitoring
  • Safety observations
  • Client inspection reports
  • Non-conformance reports (NCRs)
  • Corrective Action Reports (CARs)
  • Project progress records

By analysing these sources collectively, engineers can gain a comprehensive understanding of project performance and identify opportunities for continuous improvement.

Why Data Is Critical in Construction Quality Management

Construction projects involve thousands of activities performed under varying environmental conditions, making process variation unavoidable. Without reliable data, it becomes difficult to determine whether quality problems are isolated incidents or indicators of deeper systemic issues.

Data supports quality management by:

  • Providing objective evidence for engineering decisions.
  • Identifying recurring defects and quality trends.
  • Monitoring compliance with project specifications.
  • Supporting regulatory and contractual audits.
  • Reducing reliance on subjective judgement.
  • Improving communication among stakeholders.
  • Enhancing transparency throughout project execution.
  • Supporting continuous improvement initiatives.
  • Measuring the effectiveness of corrective actions.
  • Predicting potential quality risks before failures occur.

Reliable data enables project teams to shift from reactive quality control to proactive quality assurance.

Key Principles of Data-Driven Quality Improvement

Successful implementation of data-driven quality management is based on several fundamental principles.

Accurate Data Collection

Quality decisions are only as reliable as the information upon which they are based. Data must therefore be collected accurately using approved inspection methods and calibrated equipment.

Essential characteristics include:

  • Accuracy
  • Consistency
  • Timeliness
  • Completeness
  • Traceability
  • Reliability
  • Standardisation

Poor-quality data can result in incorrect conclusions and ineffective corrective actions.

Objective Analysis

Collected data should be evaluated using recognised analytical techniques rather than personal opinions.

This includes:

  • Trend analysis
  • Statistical evaluation
  • Performance comparisons
  • Process capability studies
  • Root cause analysis
  • Benchmarking

Objective analysis ensures that improvement decisions are supported by measurable evidence.

Continuous Monitoring

Quality improvement is not a one-time activity but an ongoing process requiring continuous monitoring throughout project execution.

Regular monitoring enables engineers to:

  • Detect early warning signs.
  • Identify abnormal variation.
  • Verify corrective action effectiveness.
  • Improve future project planning.
  • Maintain process stability.

Areas Where Data Is Collected in Civil Engineering Projects

Construction quality data is generated during almost every project activity. Proper collection and interpretation allow engineers to evaluate overall project performance.

Common data collection areas include:

Materials Quality

  • Cement quality.
  • Aggregate grading.
  • Reinforcement properties.
  • Structural steel certification.
  • Pipe dimensions.
  • Asphalt composition.
  • Water quality.

Construction Activities

  • Concrete placement.
  • Reinforcement installation.
  • Formwork alignment.
  • Excavation dimensions.
  • Road compaction.
  • Pipe joint installation.
  • Structural assembly.

Equipment Performance

  • Calibration records.
  • Operating hours.
  • Equipment downtime.
  • Maintenance schedules.
  • Production capacity.
  • Fuel consumption.

Laboratory Testing

  • Concrete cube strength.
  • Soil density.
  • Moisture content.
  • Asphalt density.
  • Aggregate quality.
  • Material durability.
  • Weld testing.

Environmental Conditions

  • Temperature.
  • Humidity.
  • Wind speed.
  • Rainfall.
  • Groundwater levels.
  • Dust monitoring.

Each dataset contributes to a more complete understanding of construction quality and process performance.

Table: Key Data Sources Used for Construction Quality Improvement

Data SourceDefinitionPractical ExampleContribution to Quality Improvement
Inspection ReportsRecords of field inspections performed during constructionReinforcement inspection before concrete pouringDetects installation errors before work progresses
Laboratory Test ResultsScientific testing of construction materialsConcrete compressive strength testingConfirms compliance with engineering specifications
Survey DataMeasurements verifying dimensions and alignmentBridge pier positioningImproves construction accuracy
Equipment Calibration RecordsDocumentation confirming measuring equipment accuracyTotal station calibration certificateEnsures reliable measurements
Non-Conformance Reports (NCRs)Records of work that fails to meet requirementsIncorrect pipe installationSupports corrective action planning
Production RecordsInformation relating to construction outputDaily concrete production quantitiesIdentifies productivity trends
Environmental MonitoringMeasurement of environmental conditions affecting qualityConcrete curing temperature recordsReduces environmental-related defects

Identifying Areas for Improvement Through Data Analysis

One of the primary objectives of analysing construction data is to identify opportunities for improving project performance. Rather than focusing only on completed defects, engineers examine patterns and trends that indicate where processes can be enhanced.

Common indicators include:

  • Increasing defect frequency.
  • Repeated inspection failures.
  • Declining productivity.
  • Rising material waste.
  • Increased equipment downtime.
  • Delayed project activities.
  • Frequent corrective actions.
  • Poor laboratory test consistency.
  • High rework costs.
  • Client complaints.

These indicators help management prioritise improvement initiatives where they will have the greatest impact.

Key Performance Indicators (KPIs) Used in Construction Quality Management

KPIs provide measurable benchmarks for evaluating project performance over time. They enable organisations to compare current performance against predefined objectives and identify areas requiring attention.

Frequently monitored quality KPIs include:

  • Concrete strength compliance rate.
  • First-time inspection pass rate.
  • Material rejection percentage.
  • Number of NCRs issued.
  • Rework cost percentage.
  • Client satisfaction ratings.
  • Equipment availability.
  • Testing turnaround time.
  • Audit compliance score.
  • Defect density.
  • Construction productivity.
  • Safety compliance performance.

Regular review of these indicators supports informed management decisions and continuous improvement.

Practical Example

During the construction of a highway pavement, the QA/QC team reviewed several months of asphalt density test results. Although the average density met specification, detailed trend analysis revealed that lower density values consistently occurred during early morning paving operations. Further investigation showed that asphalt delivery temperatures were lower during these hours, reducing compaction efficiency. The project team adjusted delivery schedules, improved insulation of transport vehicles, and modified rolling procedures to maintain the required temperature. Subsequent data confirmed more consistent density results, reduced variability, and improved pavement quality without increasing project costs.

Reducing Process Variability in Civil Engineering Projects
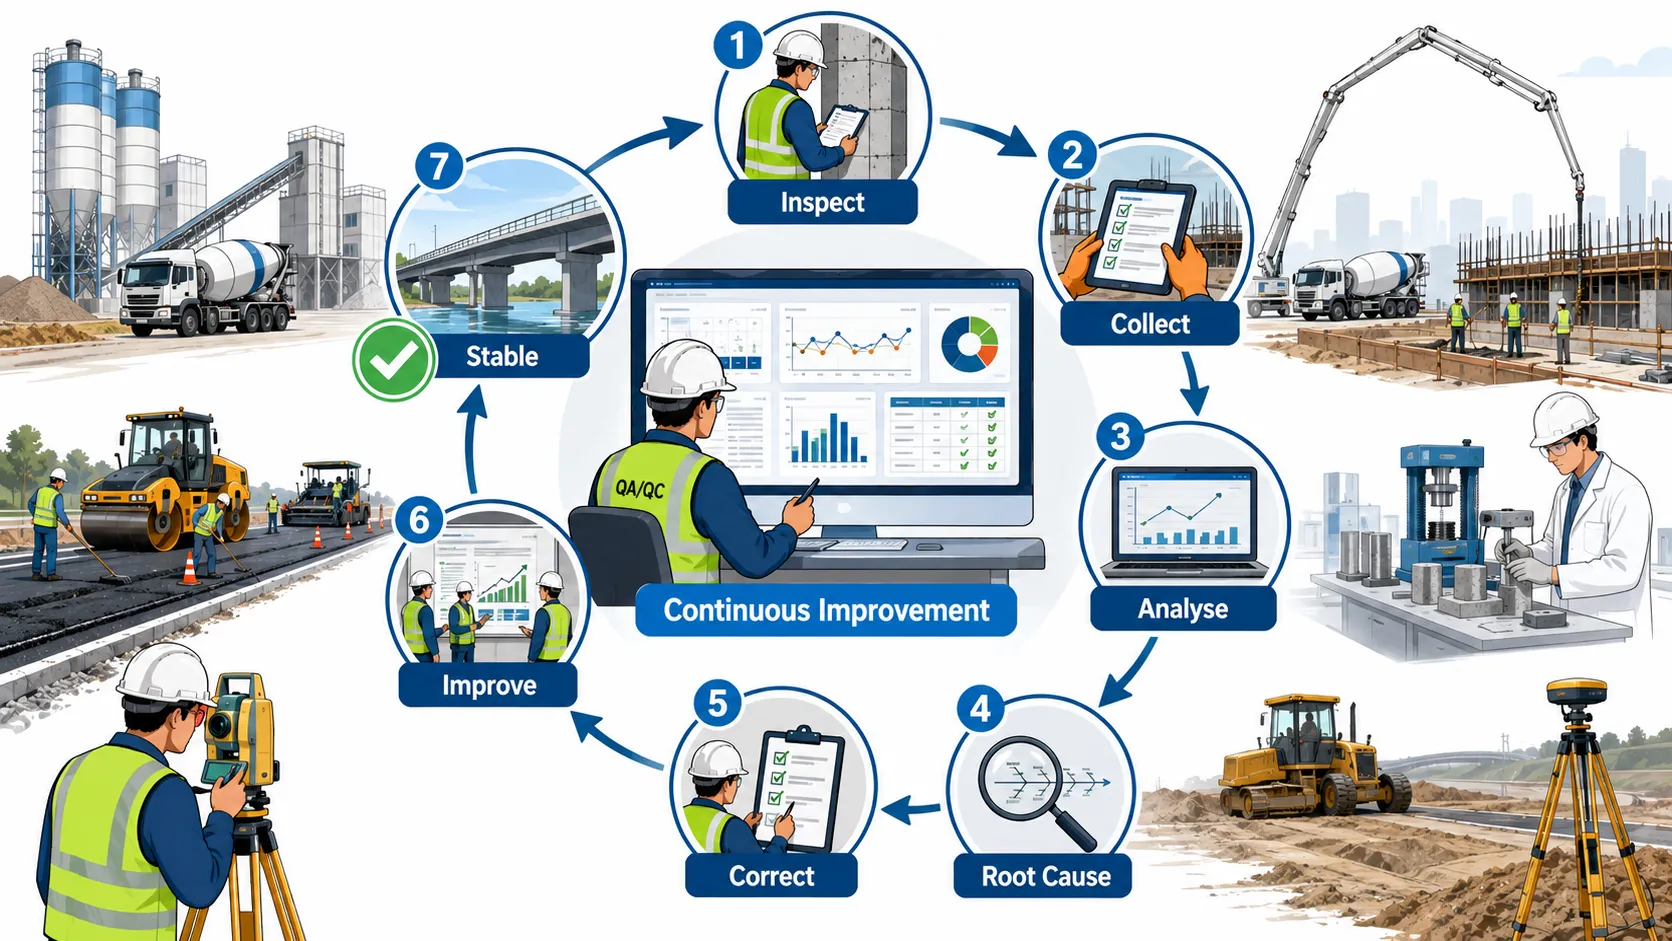
Construction quality control workflow diagram

Reducing variability is one of the primary objectives of a data-driven quality management system. Variability refers to the differences that naturally occur during construction processes due to changes in materials, equipment, environmental conditions, labour performance, or construction methods. While some variation is unavoidable, excessive variation can lead to quality defects, increased costs, project delays, and reduced client satisfaction.

Quality Assurance (QA) and Quality Control (QC) professionals continuously monitor process performance to distinguish between normal process variation and abnormal variation that requires corrective action. By analysing construction data, engineers can identify the root causes of inconsistent performance and implement improvement strategies before defects occur.

A stable construction process produces predictable results, enabling projects to meet engineering specifications consistently while reducing waste and unnecessary rework.

Common Sources of Process Variability

Understanding the origin of process variation is the first step toward improving construction quality.

Typical sources include:

Material Variability

  • Differences in cement quality.
  • Variations in aggregate grading.
  • Moisture content fluctuations.
  • Steel manufacturing tolerances.
  • Pipe dimensional inconsistencies.

Equipment Variability

  • Calibration errors.
  • Equipment wear.
  • Mechanical failures.
  • Inconsistent batching systems.
  • Survey instrument inaccuracies.

Human Factors

  • Differences in operator skill levels.
  • Inadequate supervision.
  • Communication failures.
  • Incorrect installation techniques.
  • Lack of training.

Environmental Conditions

  • Temperature changes.
  • Rainfall.
  • High humidity.
  • Strong winds.
  • Groundwater fluctuations.

Construction Methods

  • Poor sequencing.
  • Inconsistent work procedures.
  • Incorrect material handling.
  • Inadequate curing methods.
  • Improper quality inspections.

Identifying these sources allows engineers to prioritise corrective actions based on measurable evidence.

Data Analysis Techniques for Quality Improvement

Once quality data has been collected, it must be analysed systematically to identify patterns, relationships, and opportunities for improvement. Effective data analysis transforms raw information into valuable insights that support engineering decisions.

Common analytical techniques include:

Trend Analysis

Trend analysis evaluates how process performance changes over time.

Applications include:

  • Monitoring concrete strength.
  • Tracking inspection pass rates.
  • Evaluating production output.
  • Reviewing defect frequency.
  • Assessing equipment reliability.

Trend analysis enables project teams to detect gradual performance deterioration before failures occur.

Root Cause Analysis

Rather than addressing only visible defects, engineers investigate the underlying causes of quality problems.

Common root cause techniques include:

  • Five Whys Method.
  • Fishbone (Cause-and-Effect) Diagram.
  • Failure Mode and Effects Analysis (FMEA).
  • Fault Tree Analysis.
  • Process Mapping.

These techniques ensure that corrective actions eliminate the true source of problems rather than temporary symptoms.

Benchmarking

Benchmarking compares project performance with:

  • Previous projects.
  • Industry standards.
  • Organisational targets.
  • Client expectations.
  • International best practices.

Benchmarking encourages continuous improvement and helps organisations establish realistic performance goals.

Optimising Project Outcomes Through Data-Driven Decision Making

Project optimisation involves improving quality, productivity, cost efficiency, and overall project performance using factual evidence rather than assumptions.

A data-driven approach enables project managers to make informed decisions throughout every stage of construction.

Key optimisation strategies include:

  • Improving inspection planning.
  • Optimising material utilisation.
  • Reducing equipment downtime.
  • Enhancing workforce productivity.
  • Improving project scheduling.
  • Reducing construction waste.
  • Increasing first-time quality.
  • Improving supplier performance.
  • Strengthening subcontractor management.
  • Enhancing client communication.

These improvements contribute to safer, more efficient, and higher-quality construction projects.

Digital Technologies Supporting Data-Driven Quality Management

Modern construction projects increasingly rely on digital technologies to collect, analyse, and manage quality information. These technologies improve accuracy, reduce manual errors, and provide real-time visibility into project performance.

Examples include:

Building Information Modelling (BIM)

BIM integrates quality information with digital project models, enabling engineers to identify clashes, monitor progress, and improve coordination.

Mobile Inspection Applications

Digital inspection tools allow site engineers to record observations, attach photographs, assign corrective actions, and generate reports directly from the construction site.

Drones

Unmanned aerial vehicles provide rapid site surveys, monitor construction progress, inspect inaccessible locations, and verify completed work.

Internet of Things (IoT)

Sensors installed on equipment or construction materials continuously monitor:

  • Temperature.
  • Humidity.
  • Concrete curing.
  • Structural movement.
  • Equipment performance.
  • Environmental conditions.

Construction Management Software

Integrated software platforms help organisations:

  • Store inspection records.
  • Monitor quality KPIs.
  • Track NCRs.
  • Manage corrective actions.
  • Generate quality reports.
  • Analyse project trends.

Digital technologies enhance decision-making by providing accurate, real-time information throughout the project lifecycle.

Best Practices for Implementing Data-Driven Quality Improvement

Successful implementation requires both technical competence and organisational commitment.

Recommended best practices include:

  • Establish clear quality objectives before construction begins.
  • Develop standardised inspection and testing procedures.
  • Ensure all measuring equipment is calibrated.
  • Train personnel in data collection and interpretation.
  • Use consistent reporting formats across all project teams.
  • Monitor quality performance regularly.
  • Investigate abnormal trends immediately.
  • Encourage collaboration between engineering, QA/QC, laboratory, and project management teams.
  • Review lessons learned from completed projects.
  • Integrate quality improvement into organisational culture.

Adopting these practices helps organisations maintain consistent quality standards while supporting long-term operational excellence.

Benefits of Data-Driven Quality Improvement

Construction organisations that effectively use quality data experience significant operational and financial advantages.

Major benefits include:

  • Improved compliance with engineering specifications.
  • Reduced construction defects.
  • Lower rework costs.
  • Increased productivity.
  • Better utilisation of materials and equipment.
  • Improved workforce performance.
  • Faster decision-making.
  • Enhanced project predictability.
  • Greater client confidence.
  • Stronger audit performance.
  • Better regulatory compliance.
  • Increased profitability.
  • Continuous organisational learning.
  • Improved sustainability through reduced waste.
  • Higher overall project quality.

These benefits demonstrate that quality data is not merely a reporting requirement but a strategic resource for improving project performance.

Industry Case Study

A civil engineering contractor was awarded a major highway expansion project involving earthworks, drainage systems, reinforced concrete structures, and asphalt pavement construction. During the first phase of the project, QA/QC engineers observed an increasing number of Non-Conformance Reports (NCRs) related to inconsistent pavement compaction. Although individual test results generally satisfied specification requirements, project data indicated significant variation between different construction zones.

The quality team initiated a comprehensive data-driven investigation by reviewing laboratory test reports, equipment calibration records, roller operating patterns, weather conditions, production schedules, and asphalt delivery temperatures. Trend analysis revealed that compaction quality consistently declined during periods when asphalt transport distances increased, causing material temperatures to drop before placement.

Using this evidence, the project management team implemented several corrective measures:

  • Optimised asphalt delivery routes.
  • Increased the number of delivery vehicles.
  • Improved insulation of transport trucks.
  • Revised rolling sequences.
  • Enhanced operator training.
  • Introduced real-time temperature monitoring.
  • Increased inspection frequency during critical operations.

Over the following weeks, quality data demonstrated a significant reduction in variability. Pavement density became more consistent across all work areas, the number of NCRs decreased substantially, rework was virtually eliminated, and overall project productivity improved. Client inspections confirmed improved construction quality, and the contractor successfully completed the project within the planned schedule and budget.

This case highlights how data-driven decision-making enables organisations to identify hidden process weaknesses, implement targeted improvements, and achieve measurable enhancements in construction quality and operational efficiency.

Key Takeaways

  • Data-driven quality management relies on factual evidence rather than assumptions.
  • Reliable data supports objective engineering decisions.
  • Continuous monitoring helps identify improvement opportunities before defects occur.
  • Reducing process variability leads to more consistent construction quality.
  • Root cause analysis ensures corrective actions address underlying problems.
  • KPIs provide measurable indicators of project performance.
  • Digital technologies improve the speed, accuracy, and reliability of quality monitoring.
  • Collaboration between project teams strengthens continuous improvement efforts.
  • Preventive actions are more cost-effective than corrective actions after failures occur.
  • Continuous analysis of quality data supports sustainable organisational excellence and long-term project success.

Data-driven approaches have transformed the way quality is managed within modern civil engineering projects. By systematically collecting, analysing, and interpreting quality information, construction professionals can identify performance gaps, reduce process variability, optimise resource utilisation, and deliver projects that consistently meet engineering specifications and client expectations. Rather than relying solely on experience or reactive inspections, QA/QC professionals now use measurable evidence to guide every stage of planning, execution, monitoring, and continuous improvement.

For QA/QC Construction Specialists, adopting a data-driven mindset is essential for achieving operational excellence and maintaining competitive advantage. Effective use of quality data not only improves construction performance but also strengthens risk management, enhances regulatory compliance, supports informed decision-making, and fosters a culture of continuous improvement. Organisations that integrate data-driven quality management into their daily operations are better positioned to deliver safe, durable, cost-effective, and high-performing civil engineering infrastructure while continuously improving future project outcomes.

3. Develop the Ability to Analyze Quality Data and Make Informed Decisions to Enhance Efficiency, Productivity, and the Overall Quality of Civil Engineering Projects

Modern civil engineering projects generate vast amounts of information throughout every stage of planning, design, procurement, construction, inspection, testing, commissioning, and maintenance. Every material test, site inspection, equipment calibration, survey measurement, quality audit, and progress report contributes valuable data that can be used to evaluate project performance. However, collecting data alone does not improve quality. The true value lies in analysing that information effectively and transforming it into practical decisions that improve efficiency, productivity, and overall project quality.

Quality data analysis is a systematic process of reviewing, interpreting, and evaluating construction information to identify trends, measure performance, detect deviations, and support evidence-based decision-making. Rather than relying solely on personal judgement or reactive problem-solving, QA/QC professionals use factual evidence to determine whether construction processes are performing as expected and whether improvements are required.

For QA/QC Construction Specialists, quality data analysis forms the foundation of effective Quality Management Systems (QMS). It enables engineers to monitor compliance with engineering specifications, identify recurring quality issues, evaluate contractor performance, optimise construction processes, and ensure that completed infrastructure satisfies safety, durability, and regulatory requirements. By developing strong analytical skills, construction professionals become capable of making informed decisions that reduce waste, minimise project risks, improve resource utilisation, and deliver greater value to clients.

Understanding Quality Data Analysis

Quality data analysis involves converting raw construction information into meaningful knowledge that supports engineering decisions. It allows project teams to understand how construction processes perform over time, identify performance gaps, and implement corrective or preventive actions before defects occur.

The primary purpose of analysing quality data is not merely to identify problems but to understand why those problems occur and how they can be prevented in future operations.

A structured quality data analysis process enables organisations to:

  • Monitor compliance with engineering specifications.
  • Evaluate construction performance objectively.
  • Measure process stability.
  • Detect abnormal trends.
  • Identify opportunities for continuous improvement.
  • Reduce project uncertainty.
  • Improve forecasting accuracy.
  • Support strategic planning.
  • Strengthen quality assurance systems.
  • Enhance client confidence.

When quality data is analysed correctly, it becomes a strategic resource that drives organisational improvement and supports long-term project success.

Importance of Quality Data Analysis in Civil Engineering

Construction projects involve multiple stakeholders, numerous subcontractors, complex engineering activities, and constantly changing site conditions. Without proper analysis, valuable information may remain unused, preventing organisations from recognising performance issues until significant problems arise.

Quality data analysis supports construction management by enabling engineers to:

  • Verify compliance with design specifications.
  • Measure contractor performance.
  • Monitor productivity trends.
  • Identify recurring quality defects.
  • Reduce unnecessary rework.
  • Improve inspection effectiveness.
  • Strengthen quality documentation.
  • Support regulatory compliance.
  • Improve cost control.
  • Enhance project scheduling.
  • Reduce operational risks.
  • Improve communication between project teams.

Data analysis transforms routine inspection records into valuable management information that supports proactive decision-making.

Types of Quality Data Used in Civil Engineering

Construction quality management depends upon a wide range of information collected throughout the project lifecycle. Each type of data provides unique insights into project performance and quality compliance.

Material Testing Data

Material quality directly affects structural safety and long-term durability.

Examples include:

  • Concrete compressive strength.
  • Cement quality.
  • Aggregate grading.
  • Reinforcement tensile strength.
  • Asphalt composition.
  • Soil bearing capacity.
  • Pipe material properties.

Material testing data confirms that construction materials comply with project specifications before installation.

Inspection Data

Inspection records provide evidence regarding workmanship quality and compliance during construction activities.

Typical inspection data includes:

  • Reinforcement inspections.
  • Formwork inspections.
  • Pipe installation inspections.
  • Structural steel inspections.
  • Welding inspections.
  • Concrete placement observations.
  • Surface finishing inspections.

Inspection data enables engineers to identify deviations before work progresses to subsequent construction stages.

Survey and Measurement Data

Accurate dimensional information ensures that completed structures satisfy design requirements.

Examples include:

  • Structural alignment.
  • Foundation levels.
  • Road elevations.
  • Bridge positioning.
  • Pipe gradients.
  • Building dimensions.
  • Excavation measurements.

Survey information supports precision construction and minimises costly corrective work.

Equipment Performance Data

Construction equipment significantly influences productivity and quality.

Performance records may include:

  • Calibration certificates.
  • Maintenance history.
  • Equipment utilisation.
  • Downtime records.
  • Fuel consumption.
  • Operating efficiency.
  • Equipment reliability.

Monitoring equipment performance reduces unexpected failures and improves operational efficiency.

Environmental Data

Environmental conditions frequently affect construction quality.

Common monitoring parameters include:

  • Ambient temperature.
  • Humidity.
  • Wind speed.
  • Rainfall.
  • Groundwater levels.
  • Dust concentration.
  • Concrete curing conditions.

Environmental data helps engineers adapt construction methods to changing site conditions.

The Quality Data Analysis Process

Effective analysis follows a structured sequence that ensures decisions are based on accurate and reliable information.

Step 1: Data Collection

Quality data should be collected using approved inspection procedures and calibrated measuring equipment.

Essential requirements include:

  • Accuracy.
  • Consistency.
  • Completeness.
  • Timeliness.
  • Traceability.
  • Proper documentation.

Step 2: Data Verification

Before analysis begins, engineers verify that collected information is complete and reliable.

Verification activities include:

  • Reviewing inspection reports.
  • Confirming laboratory results.
  • Checking equipment calibration.
  • Eliminating duplicate records.
  • Correcting recording errors.

Reliable decisions depend upon reliable information.

Step 3: Data Organisation

Information should be organised into logical categories for easier interpretation.

Typical classifications include:

  • Material quality.
  • Construction activities.
  • Equipment performance.
  • Inspection results.
  • Safety observations.
  • Environmental conditions.
  • Project progress.

Organised information allows engineers to compare performance across different project phases.

Table: Common Quality Data Used for Decision-Making in Civil Engineering

Quality Data TypeDefinitionPractical Construction ExampleDecision SupportedKey Benefit
Material Testing DataResults obtained from laboratory testing of construction materialsConcrete compressive strength testsMaterial acceptance or rejectionEnsures structural reliability
Inspection RecordsDocumentation of field quality inspectionsReinforcement inspection before concrete pouringWork approval or corrective actionPrevents hidden defects
Survey MeasurementsDimensional verification of constructed elementsBridge alignment surveyDimensional complianceImproves construction accuracy
Equipment Performance DataInformation relating to equipment operation and calibrationConcrete batching plant calibrationMaintenance planningImproves production consistency
Environmental Monitoring DataRecords of environmental conditions affecting constructionConcrete curing temperatureConstruction method adjustmentReduces environmental-related defects
Non-Conformance Reports (NCRs)Records of work failing to meet specificationsIncorrect pipe installationCorrective action planningPrevents repeated quality failures

Key Concepts in Quality Data Analysis

Developing analytical capability requires understanding several important quality management concepts.

Data Accuracy

Accurate information forms the basis of every engineering decision.

High-quality data should be:

  • Precise.
  • Reliable.
  • Complete.
  • Verifiable.
  • Consistent.

Incorrect information often leads to ineffective corrective actions and increased project costs.

Data Integrity

Data integrity ensures that information remains accurate, secure, and unchanged throughout its lifecycle.

Maintaining integrity involves:

  • Secure record management.
  • Controlled document revisions.
  • Proper authorisation.
  • Traceable quality records.
  • Digital data protection.

Maintaining integrity strengthens confidence in quality reporting and audit performance.

Trend Identification

Rather than evaluating individual inspection results in isolation, engineers analyse long-term patterns to identify gradual performance changes.

Trend analysis helps identify:

  • Increasing defect rates.
  • Declining productivity.
  • Equipment deterioration.
  • Material inconsistency.
  • Process instability.
  • Improvement opportunities.

Early identification allows corrective action before quality failures occur.

Practical Example

During the construction of a reinforced concrete retaining wall, the QA/QC engineer reviewed several weeks of concrete compressive strength test results. While every individual test exceeded the minimum specification, detailed analysis showed that average strength values had gradually decreased over time. Additional investigation revealed that aggregate moisture content was fluctuating due to inconsistent storage conditions after heavy rainfall. Although the concrete remained compliant, the trend suggested increasing process variability that could eventually affect structural performance.

The project team implemented improved aggregate storage methods, introduced routine moisture testing before batching, recalibrated the batching system, and increased monitoring frequency. Within a short period, quality data confirmed that concrete strength had stabilised and process consistency had significantly improved. This example demonstrates how analysing quality data enables engineers to identify hidden performance issues before they develop into costly construction defects.

Quality Data Analysis Techniques Used in Civil Engineering

Once quality data has been collected, organised, and verified, QA/QC professionals must analyse it using appropriate techniques to extract meaningful information. The purpose of data analysis is not simply to produce reports but to identify trends, understand process performance, detect deviations, and recommend improvements that enhance construction quality and operational efficiency.

Effective quality analysis enables engineers to answer critical questions such as:

  • Is the construction process performing consistently?
  • Are materials meeting specification requirements?
  • Which activities generate the highest number of defects?
  • Are corrective actions producing measurable improvements?
  • Which construction processes require optimisation?
  • What risks may affect future project performance?

By answering these questions using factual evidence, organisations can make informed decisions that improve both project quality and business performance.

Trend Analysis

Trend analysis evaluates how quality performance changes over a period of time. Instead of reviewing individual inspection results independently, engineers examine long-term patterns to determine whether quality is improving, deteriorating, or remaining stable.

Trend analysis is commonly used to monitor:

  • Concrete compressive strength.
  • Pavement density.
  • Soil compaction results.
  • Material rejection rates.
  • Inspection pass percentages.
  • Equipment breakdown frequency.
  • Productivity performance.
  • Safety observations.
  • Non-Conformance Reports (NCRs).

A consistent downward or upward trend often indicates that corrective action is required before quality problems become critical.

Comparative Analysis

Comparative analysis involves comparing quality performance between different projects, contractors, work teams, production periods, or construction methods.

This approach enables organisations to:

  • Identify high-performing teams.
  • Evaluate supplier performance.
  • Compare construction techniques.
  • Benchmark productivity.
  • Measure continuous improvement.
  • Share best practices across projects.

Comparative analysis encourages evidence-based improvement rather than relying on assumptions.

Root Cause Analysis

Quality problems rarely occur without an underlying cause. Root Cause Analysis (RCA) helps engineers identify the actual source of recurring defects instead of repeatedly treating only the visible symptoms.

Common Root Cause Analysis techniques include:

  • Five Whys Method.
  • Fishbone (Cause-and-Effect) Diagram.
  • Failure Mode and Effects Analysis (FMEA).
  • Fault Tree Analysis.
  • Process Mapping.

Typical root causes identified during civil engineering projects include:

  • Incorrect material selection.
  • Equipment calibration errors.
  • Poor supervision.
  • Inadequate worker competency.
  • Inconsistent construction procedures.
  • Environmental influences.
  • Incomplete quality inspections.

By eliminating the root cause, organisations prevent the recurrence of similar quality problems in future projects.

Making Informed Decisions Using Quality Data
Quality management in construction workflow

One of the most valuable outcomes of quality data analysis is improved decision-making. Rather than reacting to problems after they occur, engineers use analysed information to make proactive decisions that improve construction processes before defects develop.

Data-driven decision-making supports:

Resource Allocation

Quality information enables project managers to allocate labour, equipment, and materials more efficiently by identifying areas requiring additional attention.

Examples include:

  • Assigning experienced inspectors to high-risk activities.
  • Increasing testing frequency for critical work.
  • Scheduling preventive maintenance.
  • Providing additional workforce training.
  • Allocating resources to activities with recurring defects.

Risk Management

Quality data helps identify risks before they affect project performance.

Potential risks identified through analysis include:

  • Declining material quality.
  • Increasing equipment failures.
  • Rising defect rates.
  • Delayed inspections.
  • Poor subcontractor performance.
  • Environmental impacts.
  • Productivity reductions.

Early identification enables preventive measures that reduce project disruption.

Corrective and Preventive Actions

Analysed quality data guides the development of effective Corrective and Preventive Actions (CAPA).

Typical corrective actions include:

  • Equipment recalibration.
  • Material replacement.
  • Procedure revision.
  • Staff retraining.
  • Increased supervision.
  • Improved inspection procedures.

Preventive actions reduce the likelihood of similar problems occurring in future projects.

Enhancing Efficiency Through Data Analysis

Construction efficiency improves when organisations understand where resources are being wasted and where productivity can be increased.

Data analysis supports efficiency improvements by:

  • Reducing unnecessary inspections.
  • Improving construction sequencing.
  • Optimising equipment utilisation.
  • Reducing material waste.
  • Minimising project delays.
  • Improving communication.
  • Enhancing workforce planning.
  • Streamlining quality documentation.
  • Reducing administrative effort.

An efficient project not only saves costs but also improves client satisfaction and overall project performance.

Improving Productivity Through Quality Data

Productivity is closely linked to quality. Poor quality often leads to rework, delays, and increased labour costs, reducing overall project efficiency.

Quality data helps improve productivity by:

  • Identifying repetitive construction errors.
  • Monitoring workforce performance.
  • Evaluating subcontractor effectiveness.
  • Measuring production output.
  • Improving scheduling accuracy.
  • Supporting continuous workforce development.
  • Reducing equipment downtime.
  • Eliminating non-value-adding activities.

As quality improves, productivity naturally increases because fewer resources are spent correcting mistakes.

Digital Technologies Supporting Quality Data Analysis

Modern construction projects increasingly rely on digital technologies to improve the speed, accuracy, and reliability of quality analysis.

Common technologies include:

Building Information Modelling (BIM)

BIM integrates design, construction, and quality information into a single digital model, improving coordination and supporting informed engineering decisions.

Mobile Quality Inspection Systems

Digital inspection applications enable engineers to:

  • Record inspection results.
  • Upload photographs.
  • Assign corrective actions.
  • Generate instant reports.
  • Track quality performance in real time.

Drones and Remote Monitoring

Drone technology provides:

  • High-resolution site inspections.
  • Construction progress monitoring.
  • Earthwork measurement.
  • Structural inspection.
  • Hazard identification.

Internet of Things (IoT)

Smart sensors continuously monitor:

  • Concrete curing temperature.
  • Structural movement.
  • Equipment performance.
  • Environmental conditions.
  • Material storage conditions.

Real-time monitoring improves the speed of engineering decisions.

Quality Management Software

Integrated digital platforms assist organisations by:

  • Managing inspection records.
  • Tracking NCRs.
  • Monitoring KPIs.
  • Analysing trends.
  • Generating management reports.
  • Supporting audit preparation.

Digital technologies improve data accuracy while reducing manual reporting errors.

Best Practices for Quality Data Analysis

To achieve maximum value from construction quality data, organisations should adopt recognised industry best practices.

Recommended practices include:

  • Establish measurable quality objectives.
  • Standardise inspection procedures.
  • Use calibrated testing equipment.
  • Train personnel in statistical interpretation.
  • Verify data accuracy before analysis.
  • Analyse trends regularly.
  • Investigate abnormal variations immediately.
  • Document lessons learned.
  • Encourage collaboration between engineering, laboratory, and management teams.
  • Integrate quality analysis into daily project management activities.
  • Review historical project performance to support future planning.
  • Promote a culture of continuous improvement across the organisation.

Consistent application of these practices strengthens organisational quality systems and improves long-term project performance.

Industry Case Study

A construction company was awarded a contract to construct a major reinforced concrete highway bridge. Throughout the project, the QA/QC department collected extensive quality data, including concrete compressive strength results, reinforcement inspection records, survey measurements, equipment calibration reports, and production statistics. Although routine inspections indicated compliance with project specifications, the quality manager noticed an increase in the number of minor surface defects appearing on completed bridge sections.

Rather than treating each defect individually, the QA/QC team analysed several months of quality records to identify possible trends. The investigation revealed that surface defects were significantly more common during periods of high ambient temperature. Further analysis showed that concrete curing procedures were not being consistently applied during hot weather, leading to rapid moisture loss and reduced surface quality.

Based on these findings, the project team implemented several improvements:

  • Revised concrete curing procedures.
  • Increased curing inspections.
  • Installed additional moisture-retention coverings.
  • Adjusted concrete placement schedules to cooler periods of the day.
  • Delivered refresher training for site personnel.
  • Introduced daily environmental monitoring reports.

Within a few weeks, inspection data demonstrated a significant reduction in surface defects, improved concrete consistency, and fewer Non-Conformance Reports. Productivity also improved because rework activities were substantially reduced, allowing construction to progress according to schedule. The project achieved all client quality requirements while maintaining budget and programme objectives.

This case demonstrates how systematic quality data analysis enables informed engineering decisions that improve efficiency, increase productivity, reduce risks, and enhance the overall quality of civil engineering projects.

Key Benefits of Developing Quality Data Analysis Skills

Developing strong analytical capabilities provides significant advantages for both individual professionals and construction organisations.

Benefits include:

  • Better engineering decision-making.
  • Increased project efficiency.
  • Improved construction productivity.
  • Reduced defects and rework.
  • Enhanced quality assurance.
  • Stronger compliance with engineering specifications.
  • More effective resource utilisation.
  • Faster identification of quality risks.
  • Improved client satisfaction.
  • Greater confidence during audits.
  • Better communication across project teams.
  • Continuous organisational improvement.
  • Increased competitiveness within the construction industry.
  • Delivery of safer, more reliable, and higher-quality infrastructure.

Key Takeaways

  • Quality data analysis converts construction information into actionable engineering knowledge.
  • Data-driven decision-making improves quality, efficiency, and productivity.
  • Trend analysis and Root Cause Analysis are essential tools for identifying improvement opportunities.
  • Accurate data collection and verification are fundamental to reliable decision-making.
  • Digital technologies enhance the speed and accuracy of quality analysis.
  • Continuous monitoring supports proactive quality management rather than reactive problem-solving.
  • Effective analysis reduces project risks, minimises rework, and optimises resource utilisation.
  • QA/QC professionals play a critical role in interpreting quality data and driving continuous improvement.
  • Informed decisions based on factual evidence contribute to the successful delivery of civil engineering projects.

The ability to analyse quality data and make informed decisions is a core competency for modern QA/QC Construction Specialists and civil engineering professionals. In today’s data-driven construction environment, successful projects depend on more than technical expertise; they require the capability to interpret complex information, identify performance trends, evaluate risks, and implement timely improvements that enhance both quality and productivity. By transforming raw inspection records, laboratory results, and operational data into meaningful insights, engineers can optimise construction processes, minimise variability, and ensure that every stage of the project consistently meets engineering specifications and client expectations.

Furthermore, developing analytical skills supports a culture of continuous improvement across construction organisations. It enables project teams to make objective decisions, strengthen quality management systems, improve operational efficiency, and deliver infrastructure that is safe, durable, cost-effective, and compliant with international standards. As digital technologies and data analytics continue to evolve, the ability to use quality data strategically will remain an essential capability for achieving excellence in civil engineering project delivery.

Conclusion

Statistical Process Control (SPC) and data-driven quality management are fundamental to achieving excellence in modern civil engineering projects. Throughout this lesson, learners have explored how statistical tools, quality data analysis, and evidence-based decision-making contribute to monitoring construction processes, reducing variability, and driving continuous improvement. Rather than relying solely on final inspections, QA/QC professionals use real-time quality data to identify trends, detect process deviations, implement corrective and preventive actions, and maintain consistent compliance with engineering specifications and industry standards.

The lesson has also highlighted the importance of analysing quality data to enhance efficiency, improve productivity, optimise resource utilisation, and support informed management decisions. By applying structured analytical techniques, monitoring key performance indicators, and leveraging digital technologies, construction professionals can minimise defects, reduce rework, control project risks, and improve overall project performance. Developing these competencies enables engineers and quality practitioners to create more reliable, sustainable, and cost-effective construction processes while strengthening organisational quality management systems.

W:H: