
Lesson 5: Recommend solutions to improve component quality, system efficiency, and safety.
Mechanical component quality, system efficiency, and operational safety are closely interconnected within modern engineering and QA/QC environments. A component that meets dimensional requirements but experiences premature wear, excessive vibration, corrosion, overheating or repeated failure can compromise the performance of the wider mechanical system. This lesson, Recommend solutions to improve component quality, system efficiency, and safety, develops a structured approach to identifying mechanical performance weaknesses and selecting technically justified improvements. It considers how inspection findings, quality records, reliability data, maintenance history, material performance and operating conditions can be evaluated to recommend practical engineering solutions that address both immediate defects and underlying causes.
Effective improvement recommendations require more than identifying what has gone wrong. Engineering professionals must assess the significance of defects, determine their likely causes, compare available corrective and preventive options, and consider their effects on reliability, production efficiency, maintenance requirements, lifecycle cost and safety. This includes evaluating potential improvements to mechanical components, assembly processes, maintenance practices, material selection, protection systems, operating procedures and quality-control measures. Data-driven decision-making is particularly important because recommendations should be supported by measurable evidence rather than assumptions or isolated observations. A well-developed solution should therefore demonstrate a clear relationship between the identified problem, the proposed intervention, expected performance improvement and method of verification.
The lesson also focuses on the professional judgement required to recommend solutions that are technically feasible, proportionate to risk and aligned with applicable engineering requirements and project expectations. Through practical mechanical QA/QC applications, learners will examine how quality defects can be reduced, component reliability strengthened, system efficiency improved and safety risks controlled through targeted engineering interventions. The emphasis is on creating actionable recommendations that can be implemented, monitored and verified, supporting continuous improvement across the mechanical asset lifecycle. This approach helps organisations achieve more reliable components, efficient mechanical systems, reduced downtime, improved quality performance and safer long-term operations.
1. Formulate Clear, Data-Backed Engineering Recommendations to Replace Low-Performing Mechanical Components with More Reliable, Modern Alternatives
Replacing a low-performing mechanical component is an engineering decision that should be based on evidence rather than preference, product availability or a general assumption that a newer component will automatically perform better. In mechanical QA/QC and reliability engineering, component replacement should be justified through a structured evaluation of historical performance, failure frequency, operating conditions, inspection findings, material behaviour, maintenance requirements, safety implications and lifecycle costs. A data-backed engineering recommendation establishes a defensible connection between the identified performance problem, the limitations of the existing component, the proposed alternative and the measurable improvement expected after implementation.
Modern mechanical systems increasingly operate under demanding combinations of pressure, temperature, loading, vibration, corrosion, contamination and continuous-duty requirements. Under these conditions, a component that was acceptable when originally selected may become less suitable as operating demands change. Bearings may experience shortened service life, seals may deteriorate prematurely, valves may develop leakage, fasteners may lose integrity, couplings may experience repeated misalignment, or rotating components may show accelerating wear. A professional engineering recommendation must therefore determine whether replacement is genuinely justified and, if so, establish technically appropriate selection criteria for the replacement component.
Purpose of Data-Backed Component Replacement
The primary purpose of a component replacement recommendation is to improve the reliability and performance of the mechanical system while maintaining acceptable quality and safety.
A well-formulated recommendation should answer five fundamental questions:
- What is wrong with the existing component?
- What evidence demonstrates that its performance is inadequate?
- Why is replacement preferable to repair or continued maintenance?
- Why is the proposed alternative technically more suitable?
- How will the improvement be verified after installation?
These questions prevent replacement decisions from becoming purely subjective.
A replacement recommendation should therefore connect:
Performance problem → Evidence → Root cause → Engineering requirement → Alternative component → Expected improvement → Verification
Key Concepts and Definitions
| Key concept | Definition | Relevance to component replacement |
|---|---|---|
| Low-performing component | Component that consistently fails to meet required reliability, quality or performance expectations | Provides the basis for improvement evaluation |
| Reliability | Ability of a component to perform its required function for a specified period under stated conditions | Used to compare existing and proposed components |
| Component life | Period over which a component remains capable of performing its required function | Helps assess replacement benefits |
| Failure frequency | Number or rate of component failures over a defined period | Provides evidence of poor performance |
| Mean Time Between Failures (MTBF) | Average operating time between applicable failures | Supports comparison of reliability performance |
| Root cause | Fundamental reason responsible for an observed problem | Prevents replacement decisions based only on symptoms |
| Engineering recommendation | Technical proposal supported by evidence and professional judgement | Provides the decision basis for replacement |
| Alternative component | Proposed replacement intended to provide improved or equivalent performance | Must be technically suitable for the application |
| Interchangeability | Ability of an alternative component to fit and function within the intended system | Important for replacement feasibility |
| Compatibility | Suitability of a component for the mechanical, environmental and operational conditions | Prevents inappropriate component selection |
| Lifecycle cost | Total cost associated with acquisition, operation, maintenance and disposal | Supports economic comparison |
| Performance specification | Defined technical requirements that a component must satisfy | Establishes selection criteria |
| Condition monitoring | Collection and analysis of equipment-condition information | Provides evidence for replacement decisions |
| Acceptance criteria | Defined requirements used to determine whether a component is acceptable | Supports quality verification |
| Verification | Evidence confirming that the selected component performs as intended | Demonstrates effectiveness after replacement |
Why Data Must Support the Recommendation
Engineering recommendations become significantly stronger when supported by measurable evidence.
Useful evidence can include:
- Failure records.
- Maintenance history.
- Inspection results.
- Wear measurements.
- Vibration trends.
- Temperature trends.
- Leakage records.
- Lubricant-condition results.
- Operating hours.
- Downtime records.
- Component replacement frequency.
- Quality defects.
- Non-conformance reports.
- Safety incidents or near misses where relevant.
- Manufacturer performance information.
- Actual operating conditions.
A component that has failed once may not necessarily be unsuitable. However, repeated failures under normal operating conditions provide a much stronger basis for investigating replacement.
Identifying a Low-Performing Component
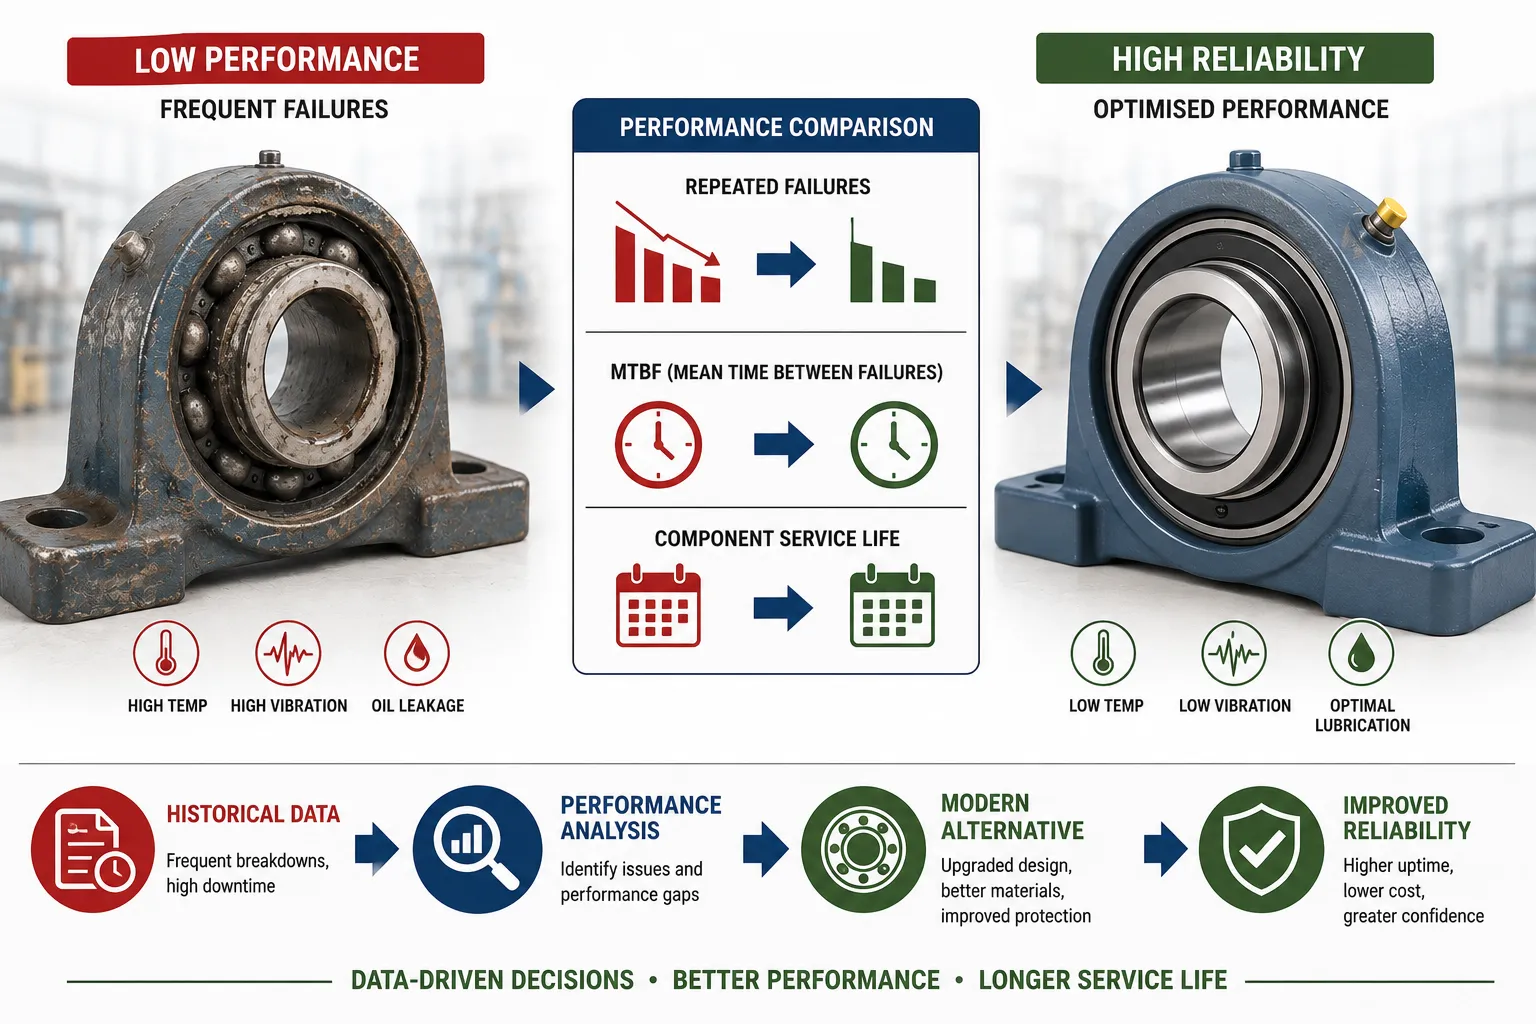
The first stage is to establish whether the existing component is genuinely underperforming.
Performance concerns may include:
- Premature failure.
- Excessive wear.
- Repeated leakage.
- Excessive vibration.
- Overheating.
- Corrosion.
- Deformation.
- Reduced efficiency.
- Frequent adjustment.
- High maintenance demand.
- Repeated quality defects.
- Short component service life.
The engineering team should compare actual performance against the component’s intended requirements.
Establishing the Performance Gap
A performance gap exists when actual results do not meet an established requirement or reasonable operating expectation.
For example:
Required bearing life: 20,000 operating hours
Observed average life: 7,500 operating hours
This difference provides quantitative evidence that the existing arrangement may require investigation.
Other examples include:
- Required leakage performance versus actual leakage.
- Required dimensional stability versus measured wear.
- Expected service interval versus actual intervention frequency.
- Required operating temperature versus measured temperature.
- Required availability versus actual availability.
Analysing Historical Failure Data
Historical failure information is one of the most important sources of evidence.
The analysis should consider:
- Number of failures.
- Failure dates.
- Operating hours before failure.
- Component batch or model.
- Operating conditions.
- Failure mechanism.
- Maintenance performed.
- Replacement history.
- Time between replacement and subsequent failure.
Repeated failure patterns can identify systemic weaknesses.
Example of Failure Trend Analysis
Suppose a mechanical coupling has the following replacement history:
- Year 1: 2 failures.
- Year 2: 3 failures.
- Year 3: 5 failures.
If operating exposure has remained broadly comparable, the increasing replacement frequency provides evidence that the existing arrangement should be investigated.
The recommendation should not immediately be “replace the coupling”.
The engineer should first investigate:
- Alignment.
- Loading.
- Installation.
- Lubrication where applicable.
- Component selection.
- Operating conditions.
- Maintenance practices.
This ensures that replacement addresses the actual problem.
Root-Cause Analysis Before Replacement
Replacing a component without understanding why it failed can simply transfer the same failure mechanism to the new component.
For example:
Bearing failure → replacement bearing installed → same alignment problem remains → replacement bearing fails again
The component was replaced, but the underlying cause was not controlled.
Root-cause investigation should therefore consider:
- Design suitability.
- Installation quality.
- Operating conditions.
- Maintenance practices.
- Lubrication.
- Alignment.
- Loading.
- Environmental exposure.
- Material suitability.
- Manufacturing quality.
Distinguishing Component Failure from System Failure
A critical engineering judgement is determining whether the component itself is the problem.
A bearing may fail because:
- The bearing is unsuitable.
- Lubrication is inadequate.
- Shaft alignment is poor.
- The machine is overloaded.
- Contamination is present.
- Installation is incorrect.
Therefore, the recommendation should distinguish:
Component weakness
from
System-induced component failure
This distinction is essential for avoiding ineffective replacement programmes.
Defining the Requirements for the New Component
Once replacement is justified, technical requirements should be established.
These may include:
- Load capacity.
- Operating speed.
- Temperature range.
- Pressure rating.
- Material compatibility.
- Corrosion resistance.
- Dimensional requirements.
- Mounting requirements.
- Environmental resistance.
- Lubrication requirements.
- Expected service life.
- Maintenance requirements.
- Safety requirements.
The replacement should be selected against actual operating conditions rather than simply being labelled “modern”.
Evaluating Modern Alternatives
A modern alternative may provide advantages such as:
- Improved materials.
- Better surface treatments.
- Improved sealing.
- Higher wear resistance.
- Better thermal performance.
- Improved corrosion resistance.
- Reduced maintenance requirements.
- Improved monitoring capability.
- Greater service life.
- Better manufacturing consistency.
However, newer technology does not automatically mean better suitability.
The proposed alternative must demonstrate compatibility with the application.
Technical Compatibility
Before recommending a replacement, verify:
Mechanical compatibility
- Dimensions.
- Mounting arrangements.
- Shaft or bore dimensions.
- Connection type.
- Load requirements.
- Clearance.
- Alignment requirements.
Environmental compatibility
- Temperature.
- Moisture.
- Dust.
- Chemical exposure.
- Corrosive conditions.
- Contamination.
Operational compatibility
- Speed.
- Pressure.
- Load.
- Duty cycle.
- Start-stop frequency.
- Continuous operation.
Maintenance compatibility
- Lubrication requirements.
- Inspection requirements.
- Spare-parts availability.
- Required tools.
- Technician capability.
Data Sheet Comparison
Supplier or manufacturer data should be compared systematically.
For example:
| Parameter | Existing component | Proposed component | Required condition | Assessment |
|---|---|---|---|---|
| Load capacity | 80 kN | 110 kN | 90 kN minimum | Suitable |
| Temperature range | 0–90°C | -20–140°C | 20–110°C | Suitable |
| Expected service life | 8,000 h | 18,000 h | 15,000 h target | Improvement |
| Corrosion resistance | Standard | Enhanced | High exposure | Improvement |
| Maintenance interval | 1,000 h | 2,000 h | 1,500 h target | Improvement |
| Dimensions | Existing | Compatible | Existing interface | Suitable |
The exact values in an engineering application must always come from verified project and manufacturer information.
Reliability-Based Selection
Reliability should be a central selection criterion.
The proposed component should demonstrate credible improvement in:
- Service life.
- Failure resistance.
- Stability.
- Wear resistance.
- Operating consistency.
- Maintenance interval.
Where historical reliability data are available, comparison should be quantitative.
For example:
Existing component MTBF = 6,000 hours
Proposed alternative target MTBF = 12,000 hours
This provides a measurable reliability objective.
Lifecycle Cost Analysis
Purchase price alone should not determine the replacement decision.
A component with a higher initial cost may be economically preferable if it provides:
- Longer service life.
- Lower maintenance frequency.
- Lower downtime.
- Fewer replacement interventions.
- Reduced spare-parts consumption.
- Lower labour requirements.
Lifecycle evaluation should consider:
Acquisition cost + installation cost + maintenance cost + downtime impact + replacement cost
The exact calculation should use project-specific data.
Safety Considerations
Component replacement must consider safety consequences.
A low-performing component may create risks through:
- Sudden failure.
- Loss of containment.
- Rotating-component damage.
- Structural instability.
- Leakage.
- Excessive heat.
- Unexpected movement.
The replacement recommendation should therefore explain how the proposed component reduces or controls relevant risks.
Quality Considerations
Quality performance should also be evaluated.
A component may contribute to quality problems through:
- Excessive dimensional variation.
- Inconsistent movement.
- Leakage.
- Vibration.
- Misalignment.
- Surface degradation.
A more reliable component may therefore improve both equipment performance and finished-product quality.
Maintenance Considerations
The proposed component should be evaluated against the organisation’s maintenance capability.
Consider:
- Availability of spare parts.
- Lubrication requirements.
- Inspection requirements.
- Required specialist tools.
- Training requirements.
- Manufacturer support.
- Replacement procedures.
A technically excellent component may be impractical if the organisation cannot maintain it correctly.
Installation Requirements
Replacement recommendations should include installation considerations.
These can involve:
- Isolation.
- Removal procedure.
- Cleaning.
- Inspection of interfaces.
- Dimensional checks.
- Alignment.
- Fastener torque.
- Lubrication.
- Functional testing.
Installation quality is critical because a high-quality component can fail prematurely if installed incorrectly.
Engineering Recommendation Structure
A professional recommendation can follow this structure:
1. Problem Statement
Clearly describe the performance issue.
2. Evidence
Present relevant historical and current data.
3. Failure or Performance Analysis
Explain the observed degradation or performance gap.
4. Root-Cause Assessment
Identify the likely underlying mechanisms.
5. Existing Component Limitations
Explain why the current component is no longer suitable.
6. Proposed Alternative
Identify the technical characteristics of the replacement.
7. Technical Comparison
Compare existing and proposed performance.
8. Risk Assessment
Evaluate potential risks and controls.
9. Lifecycle Evaluation
Compare costs and expected service life.
10. Implementation Plan
Define replacement and verification activities.
11. Performance Verification
Define how improvement will be measured.
Example: Bearing Replacement Recommendation
A production conveyor experiences repeated bearing failures.
Historical records show:
- Average bearing life of 5,800 hours.
- Increasing operating temperature.
- Repeated lubricant contamination.
- Several emergency replacements.
- Significant production downtime.
The engineering team investigates the problem.
Inspection confirms that:
- The bearing is exposed to contamination.
- The existing sealing arrangement is limited.
- Operating loads are higher than initially expected.
A proposed alternative provides:
- Enhanced sealing.
- Higher load capacity.
- Improved contamination resistance.
- Longer expected service life.
The recommendation should explain that replacement is justified not simply because the new bearing is newer, but because its technical characteristics address documented weaknesses.
Example: Valve Replacement
A process valve develops recurring leakage despite repeated maintenance.
Historical records demonstrate:
- Frequent seal replacement.
- Increasing leakage frequency.
- Increased maintenance intervention.
- Production disruption.
The engineering team compares an alternative valve design with:
- Improved sealing arrangement.
- Suitable pressure rating.
- Compatible materials.
- Improved environmental resistance.
- Appropriate connection dimensions.
The recommendation should compare the valve’s technical characteristics with actual operating requirements.
Example: Coupling Replacement
A mechanical coupling repeatedly requires replacement because of vibration and alignment sensitivity.
The investigation considers:
- Operating speed.
- Torque.
- Shaft alignment.
- Misalignment tolerance.
- Installation conditions.
A modern coupling design may offer improved tolerance to specific operating conditions.
The recommendation should demonstrate that the alternative addresses the documented failure mechanism.
Using Risk-Based Decision-Making
Not every low-performing component requires immediate replacement.
Risk can be considered using:
- Likelihood of failure.
- Consequence of failure.
- Detectability.
- Safety impact.
- Production impact.
- Environmental impact.
- Repair complexity.
High-risk components may require faster intervention.
Lower-risk components may be monitored while replacement is planned.
Prioritising Replacement Recommendations
A replacement programme can prioritise components according to:
- Safety criticality.
- Failure frequency.
- Production impact.
- Maintenance burden.
- Availability of alternatives.
- Remaining service life.
- Cost of continued operation.
This supports efficient allocation of engineering and maintenance resources.
Verification After Replacement
A replacement should not be considered successful simply because the new component has been installed.
Post-installation verification may include:
- Dimensional checks.
- Alignment checks.
- Torque verification.
- Functional testing.
- Leakage testing where applicable.
- Temperature monitoring.
- Vibration monitoring.
- Wear monitoring.
- Performance comparison.
The verification plan should be established before implementation.
Before-and-After Performance Comparison
Performance should ideally be compared using defined indicators.
For example:
| Performance measure | Before replacement | After replacement | Desired outcome |
|---|---|---|---|
| Failure frequency | High | Reduced | Lower |
| MTBF | 6,000 h | 12,000 h | Higher |
| Downtime | 36 h/month | 12 h/month | Lower |
| Vibration | Elevated | Stable | Controlled |
| Maintenance interventions | Frequent | Reduced | Lower |
| Component life | Short | Extended | Higher |
Actual values should be based on verified project data.
Documentation and Traceability
A replacement recommendation should be supported by controlled documentation.
Relevant records may include:
- Engineering recommendation.
- Inspection reports.
- Failure reports.
- Historical maintenance records.
- Manufacturer data sheets.
- Technical comparison.
- Risk assessment.
- Approval records.
- Purchase documentation.
- Installation records.
- Inspection and test results.
- Commissioning records.
- Performance verification.
This creates a traceable engineering decision.
Change Management
Component replacement may represent a change to the existing engineering arrangement.
The change process should consider:
- Technical review.
- Design compatibility.
- Procurement.
- Installation.
- Testing.
- Documentation.
- Training.
- Maintenance requirements.
- Spare-parts strategy.
Uncontrolled substitution can introduce new risks.
Common Errors in Component Replacement
Selecting based only on purchase price
Low acquisition cost does not necessarily mean low lifecycle cost.
Assuming newer means better
A modern component still has to match actual service conditions.
Ignoring root cause
Replacement without root-cause analysis can lead to repeated failure.
Ignoring installation requirements
Incorrect installation can undermine component reliability.
Failing to compare data sheets
Performance claims should be checked against actual operating requirements.
Ignoring maintenance capability
The organisation must be able to maintain the replacement correctly.
Failing to establish verification criteria
Without measurable criteria, improvement cannot be demonstrated objectively.
Benefits of Data-Backed Component Replacement
A properly justified replacement strategy can provide:
- Improved component reliability.
- Longer service life.
- Reduced failure frequency.
- Reduced maintenance requirements.
- Lower unplanned downtime.
- Improved system availability.
- Better operational efficiency.
- Improved safety performance.
- Reduced lifecycle costs.
- Improved quality consistency.
- Better asset-integrity performance.
- Stronger engineering traceability.
Continuous Improvement After Replacement
Replacement should generate new performance data that can improve future engineering decisions.
The organisation should monitor:
- Failure frequency.
- Component life.
- Maintenance requirements.
- Operating condition.
- Performance stability.
- Downtime.
- Defect frequency.
The results can then be compared with the original recommendation.
This creates a continuous improvement cycle:
Identify → Analyse → Recommend → Replace → Verify → Learn → Improve
Practical Engineering Decision Framework
When preparing a recommendation, the engineering professional should ask:
Is the current component genuinely underperforming?
Evidence should demonstrate a measurable performance gap.
Is the failure mechanism understood?
Replacement should not simply address symptoms.
Is the alternative technically compatible?
The component must satisfy mechanical, environmental and operational requirements.
Is reliability demonstrably improved?
The proposed benefit should be measurable.
Is the alternative maintainable?
Maintenance requirements must be practical.
Is the replacement economically justified?
Lifecycle implications should be considered.
Does the replacement improve safety?
Relevant risks should be identified and controlled.
How will success be verified?
Clear post-installation performance measures should be established.
Case Study: Modernising a Low-Performing Mechanical Component
Background
A manufacturing facility operates a critical rotating assembly that experiences repeated bearing failures. The equipment operates continuously and contributes directly to production output.
Historical records show:
- Frequent bearing replacement.
- Increasing maintenance costs.
- Repeated vibration alarms.
- Elevated operating temperature.
- Production interruptions.
- Shorter-than-expected bearing life.
The organisation initially responds by increasing inspection frequency and replacing bearings more often.
However, the failures continue.
Engineering Investigation
The QA/QC and reliability team analyses:
- Maintenance records.
- Failure history.
- Bearing operating conditions.
- Lubricant condition.
- Vibration trends.
- Temperature trends.
- Load conditions.
- Installation records.
The investigation identifies that contamination and higher-than-expected operating loads are significant contributors.
Alternative Evaluation
The team evaluates a modern bearing alternative with:
- Higher load capability.
- Improved sealing.
- Better contamination resistance.
- Suitable dimensional compatibility.
- Appropriate operating-temperature capability.
The alternative is compared against the actual operating conditions.
Recommendation
The engineering recommendation proposes replacement because the alternative directly addresses documented weaknesses rather than simply because it is a newer product.
The recommendation also includes:
- Improved installation controls.
- Controlled lubrication.
- Alignment verification.
- Post-installation vibration monitoring.
- Temperature monitoring.
- Performance review after defined operating hours.
Verification
Following implementation, the engineering team compares:
- Bearing life.
- Vibration.
- Temperature.
- Maintenance frequency.
- Downtime.
- Failure frequency.
If the data demonstrate sustained improvement, the replacement recommendation can be considered effective.
Conclusion
Formulating data-backed engineering recommendations for replacing low-performing mechanical components requires a structured combination of reliability analysis, QA/QC evidence, technical evaluation, risk assessment and professional engineering judgement. The decision should begin with objective evidence showing that the existing component is failing to meet the required performance level. Historical failure records, inspection findings, wear measurements, vibration trends, temperature data, maintenance records and operating conditions provide the foundation for establishing this performance gap.
A technically sound recommendation must then determine why the existing component is underperforming and whether the problem originates from the component itself or from wider system conditions such as overloading, misalignment, contamination, lubrication deficiencies or installation quality. Only after these factors have been evaluated should an alternative component be selected. The proposed replacement should be compared against actual operating requirements, including mechanical loads, temperature, pressure, speed, environmental exposure, dimensional compatibility, maintenance requirements, reliability expectations and safety considerations.
The strongest recommendations are measurable and verifiable. They establish clear performance objectives such as increased MTBF, longer component life, reduced failure frequency, lower downtime, reduced maintenance intervention and improved operating stability. They also define how these improvements will be demonstrated after installation. By following the cycle of identifying performance problems, analysing evidence, evaluating alternatives, implementing controlled changes and verifying results, engineering teams can make more reliable replacement decisions, improve mechanical component quality, increase system efficiency and strengthen long-term safety and asset integrity.
2. Design Practical Workflow Adjustments for Mechanical Systems That Reduce Energy Consumption and Friction Losses Without Lowering Production Speed
Mechanical systems consume energy through useful work as well as through losses associated with friction, unnecessary movement, poor alignment, excessive vibration, inefficient lubrication, pressure losses and avoidable operating resistance. In a modern QA/QC and engineering environment, improving mechanical efficiency is therefore not simply a matter of reducing energy use. The objective is to identify controllable sources of mechanical loss and redesign the workflow so that equipment performs the required production function with less wasted energy while maintaining output, quality, reliability and safety.
A practical workflow adjustment focuses on how equipment is operated, maintained, inspected, lubricated, aligned, loaded and sequenced. Even when the mechanical design itself remains unchanged, improvements to operating procedures and maintenance workflows can reduce friction losses and energy demand. For example, maintaining correct lubrication conditions can reduce resistance at moving interfaces; improving shaft alignment can reduce bearing and coupling losses; eliminating unnecessary idling can reduce energy consumption; and controlling material flow can prevent equipment from operating inefficiently under unstable loading. The key engineering challenge is to achieve these improvements without reducing production speed or creating new reliability or safety risks.
For mechanical QA/QC professionals, the process should be data-driven. Energy consumption, production rate, equipment temperature, vibration, maintenance records, operating hours and component condition should be reviewed before a workflow change is recommended. The proposed adjustment should then be tested against defined performance criteria. A successful improvement should demonstrate that energy consumption or friction-related losses have decreased while production throughput, dimensional quality, equipment reliability and safe operating conditions remain acceptable.
Understanding Mechanical Energy Losses and Friction
Mechanical energy losses occur whenever part of the input energy is converted into unwanted heat, vibration, deformation, turbulence or other forms of resistance rather than productive output. Friction is one of the most important sources of loss in mechanical systems because contacting surfaces resist relative motion.
Common friction-related losses occur in:
- Bearings.
- Gears.
- Shafts.
- Couplings.
- Chains.
- Belts.
- Sliding mechanisms.
- Seals.
- Guides.
- Bushes.
- Actuated mechanisms.
- Material handling interfaces.
The objective is not to eliminate friction completely because some friction is necessary for certain mechanical functions. The engineering objective is to control unnecessary friction while preserving the required traction, sealing, braking, gripping and transmission functions.
Key Concepts and Definitions
| Key concept | Definition | Application to workflow improvement |
|---|---|---|
| Friction loss | Energy converted into heat or other unwanted effects due to resistance between moving surfaces | Identifies opportunities to improve mechanical efficiency |
| Mechanical efficiency | Ratio of useful mechanical output to mechanical input | Measures how effectively equipment converts input energy into useful work |
| Energy consumption | Amount of energy required to operate equipment or perform a defined production task | Provides a basis for efficiency comparison |
| Production throughput | Quantity of acceptable product produced within a specified period | Confirms that efficiency improvements do not reduce output |
| Lubrication | Application of an appropriate lubricant to control friction, wear and heat | Reduces resistance at suitable moving interfaces |
| Alignment | Correct geometric relationship between connected mechanical components | Helps reduce unnecessary loads, vibration and friction |
| Idle operation | Equipment running without performing useful production work | Represents a potential source of avoidable energy consumption |
| Workflow adjustment | Controlled modification to how equipment or activities are performed | Provides a practical mechanism for improving efficiency |
| Condition monitoring | Measurement of equipment condition during operation | Helps identify friction, wear and developing inefficiencies |
| Baseline | Recorded performance condition before an improvement is introduced | Enables objective before-and-after comparison |
| Throughput | Rate at which acceptable production output is generated | Ensures production speed remains protected |
| Preventive maintenance | Planned maintenance intended to reduce deterioration or failure | Supports efficient and reliable equipment operation |
| Friction coefficient | Measure representing resistance between interacting surfaces | Helps explain friction-related mechanical losses |
| Pressure loss | Reduction in fluid pressure caused by resistance within a flow system | Important for pumps, piping and fluid-handling equipment |
| Energy intensity | Energy consumed per unit of useful production output | Useful for comparing efficiency before and after workflow changes |
Why Production Speed Must Be Protected
An energy-saving measure is not automatically an effective engineering solution if it reduces production output. A workflow change should therefore optimise the relationship between energy use and productive performance.
For example:
Existing condition:
Energy consumption = 1,000 kWh
Production = 500 units
Energy intensity:
1,000 ÷ 500 = 2 kWh/unit
After an improvement:
Energy consumption = 850 kWh
Production = 500 units
Energy intensity:
850 ÷ 500 = 1.7 kWh/unit
The equipment produces the same output while using less energy per unit.
This is a stronger improvement than simply reducing operating speed to reduce energy consumption.
Establishing a Performance Baseline
Before changing the workflow, the engineering team should establish a reliable baseline.
Relevant baseline measurements may include:
- Energy consumption.
- Production rate.
- Production cycle time.
- Equipment operating hours.
- Motor loading where relevant.
- Bearing temperature.
- Vibration levels.
- Lubrication condition.
- Maintenance frequency.
- Unplanned downtime.
- Product rejection rate.
- Friction-related defects.
- Equipment availability.
The baseline should represent normal production conditions rather than an unusual operating period.
Identifying Sources of Unnecessary Energy Consumption

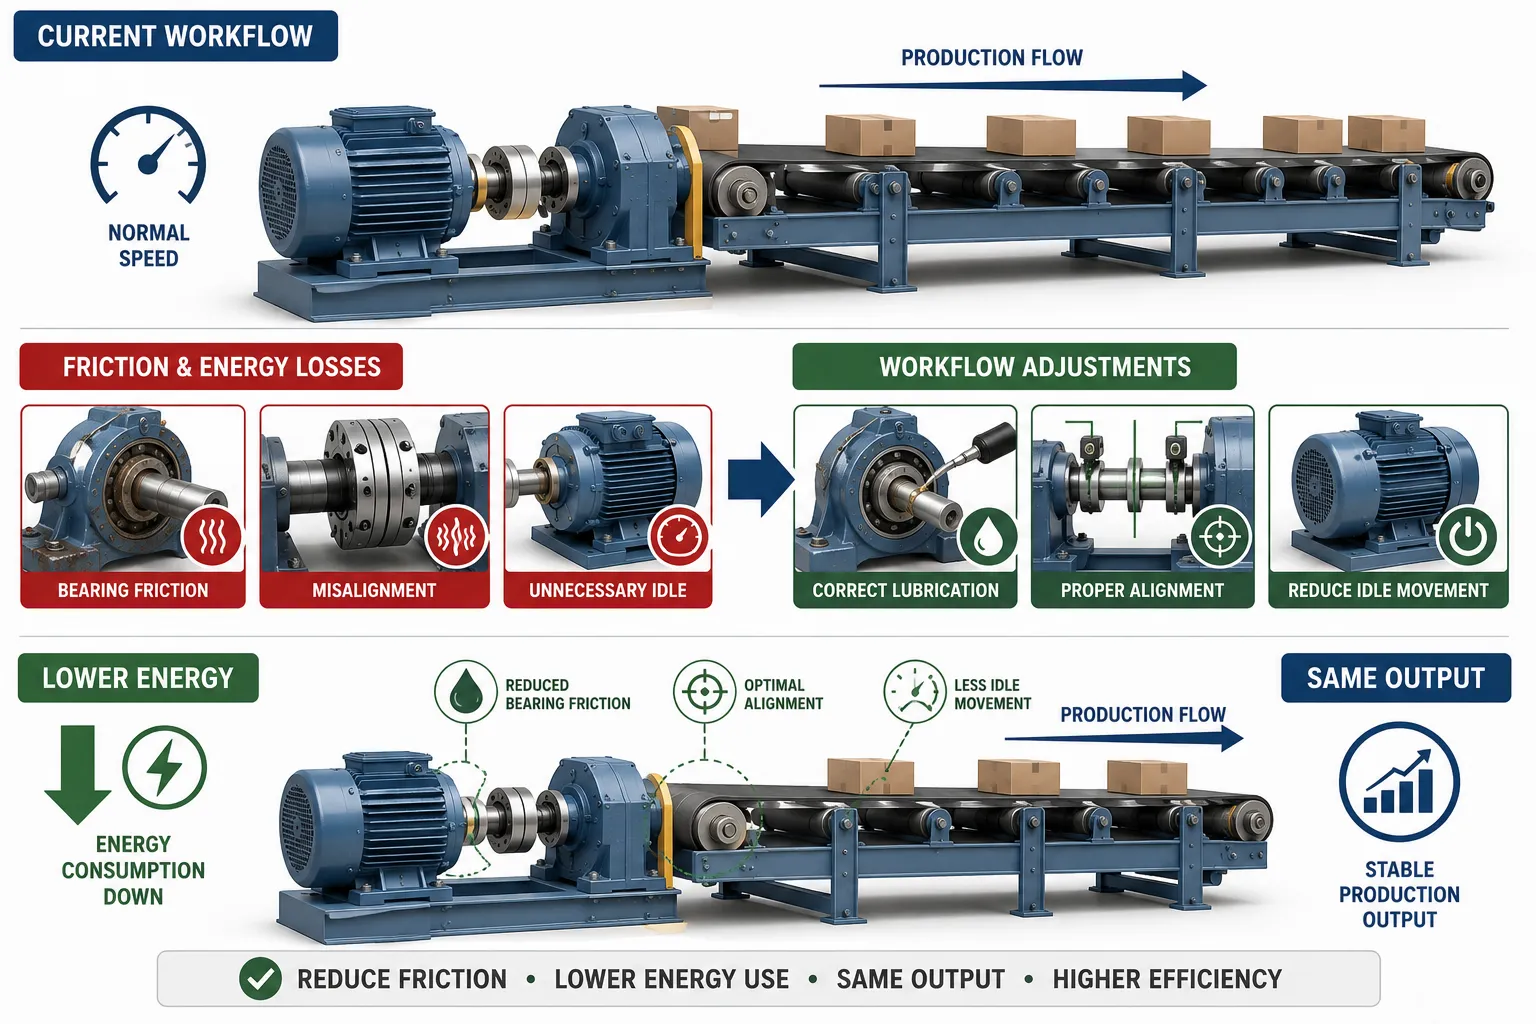
A structured review should examine how the mechanical system operates throughout the production cycle.
Potential sources include:
- Equipment running while production is paused.
- Excessive mechanical resistance.
- Poor shaft alignment.
- Inadequate lubrication.
- Excessive lubrication.
- Worn bearings.
- Damaged seals.
- Misaligned belts.
- Incorrect chain tension.
- Excessive mechanical vibration.
- Unnecessary acceleration and deceleration.
- Overloaded equipment.
- Inefficient material flow.
- Repeated handling movements.
- Unnecessary machine travel.
- Poor workflow sequencing.
The objective is to identify losses that can be controlled without compromising the required production function.
Workflow Mapping
Workflow mapping helps identify where energy and mechanical effort are being unnecessarily consumed.
A production workflow can be represented as:
Material input → Preparation → Transfer → Processing → Assembly → Inspection → Output
At each stage, the engineering team can ask:
- Is the equipment operating only when required?
- Is material movement efficient?
- Are unnecessary transfers occurring?
- Are components repeatedly repositioned?
- Is equipment waiting while still running?
- Is excessive friction occurring?
- Are maintenance-related delays affecting the cycle?
- Can the sequence be improved without reducing production speed?
Practical Workflow Adjustment 1: Reduce Unnecessary Idling
One of the simplest efficiency improvements is controlling unnecessary equipment operation during non-productive periods.
Examples include:
- Equipment remaining active during material changeovers.
- Conveyors operating while downstream equipment is stopped.
- Auxiliary systems operating when not required.
- Rotating machinery running during extended inspection periods.
- Machines operating between production batches.
A controlled workflow can define when equipment should remain operational and when safe standby conditions should be used.
The adjustment should never bypass required safety or operational controls.
Practical Workflow Adjustment 2: Improve Lubrication Practices
Lubrication has a direct relationship with friction, wear and energy consumption.
An effective lubrication workflow should consider:
- Correct lubricant type.
- Correct lubricant quantity.
- Correct application method.
- Correct lubrication interval.
- Operating temperature.
- Equipment speed.
- Contamination risk.
- Manufacturer requirements.
- Environmental conditions.
Too little lubrication can increase friction and wear.
Too much lubrication can also create problems through increased churning, heat generation and seal stress.
Therefore:
Correct lubrication ≠ maximum lubrication
The objective is appropriate lubrication for the actual operating condition.
Practical Workflow Adjustment 3: Improve Shaft Alignment
Misalignment can increase:
- Bearing loading.
- Coupling stress.
- Vibration.
- Heat generation.
- Friction.
- Component wear.
An alignment-focused workflow can include:
- Alignment verification after installation.
- Alignment checks following major maintenance.
- Condition monitoring for alignment-related symptoms.
- Defined acceptance criteria.
- Documentation of alignment results.
Improved alignment can reduce mechanical resistance without requiring a reduction in production speed.
Practical Workflow Adjustment 4: Optimise Bearing Condition
Bearings can be significant sources of mechanical friction.
A workflow adjustment can incorporate:
- Routine bearing inspection.
- Temperature monitoring.
- Vibration monitoring.
- Lubrication checks.
- Contamination control.
- Correct installation.
- Timely replacement when deterioration is confirmed.
Replacing a deteriorated bearing before severe damage develops can reduce resistance and prevent secondary damage.
Practical Workflow Adjustment 5: Improve Belt and Chain Tension
Incorrect belt or chain tension can increase mechanical losses.
Excessive tension can create:
- Increased bearing loads.
- Additional friction.
- Accelerated wear.
Insufficient tension can produce:
- Slippage.
- Reduced power transmission.
- Heat generation.
- Inconsistent movement.
A controlled inspection and adjustment workflow should maintain tension within the specified operating range.
Practical Workflow Adjustment 6: Reduce Unnecessary Mechanical Movement
Production workflows often include unnecessary movements that consume energy without increasing output.
Examples include:
- Repeated repositioning of components.
- Excessive conveyor travel.
- Unnecessary lifting and lowering.
- Long transfer paths.
- Repeated machine movements.
- Poorly sequenced material handling.
A revised workflow can reduce these movements while preserving the required production sequence.
Practical Workflow Adjustment 7: Improve Material Flow
Material-flow inefficiency can increase mechanical energy use.
A more efficient workflow can:
- Reduce transfer distances.
- Minimise repeated handling.
- Position materials closer to point of use.
- Synchronise material movement with production demand.
- Reduce unnecessary conveyor operation.
- Eliminate avoidable backtracking.
This approach improves efficiency without necessarily changing production speed.
Practical Workflow Adjustment 8: Reduce Excessive Vibration
Vibration represents energy that is not contributing directly to productive mechanical work.
Potential causes include:
- Misalignment.
- Imbalance.
- Worn bearings.
- Loose components.
- Mechanical resonance.
- Coupling problems.
A workflow incorporating routine vibration monitoring can identify deterioration earlier.
Practical Workflow Adjustment 9: Improve Preventive Maintenance Timing
Preventive maintenance should be timed according to evidence rather than arbitrary frequency where appropriate.
A maintenance workflow can use:
- Historical failure data.
- Condition-monitoring results.
- Operating hours.
- Component wear trends.
- Lubricant condition.
- Temperature trends.
- Vibration trends.
This can prevent unnecessary maintenance while ensuring deteriorating components are addressed before they create significant energy losses.
Workflow Adjustment Design Process
A professional process can be structured into the following stages.
Stage 1: Define the Efficiency Problem
Clearly state:
- Current energy performance.
- Current production output.
- Observed mechanical losses.
- Affected equipment.
- Operating conditions.
Stage 2: Establish Baseline Data
Collect:
- Energy data.
- Throughput.
- Cycle time.
- Condition data.
- Maintenance records.
- Quality results.
Stage 3: Identify Loss Mechanisms
Determine whether losses arise from:
- Friction.
- Misalignment.
- Wear.
- Lubrication.
- Idle running.
- Inefficient sequencing.
- Excessive movement.
Stage 4: Develop Workflow Options
Potential options can include:
- Lubrication adjustments.
- Inspection frequency changes.
- Alignment controls.
- Standby procedures.
- Material-flow improvements.
- Maintenance sequencing.
- Condition-monitoring integration.
Stage 5: Assess Risks
Consider:
- Safety.
- Reliability.
- Quality.
- Production.
- Maintenance.
- Equipment condition.
Stage 6: Select the Preferred Adjustment
Choose the option that provides the strongest balance of:
Energy reduction + production protection + reliability + safety
Stage 7: Implement Under Controlled Conditions
Implementation should be planned and documented.
Stage 8: Measure the Result
Compare:
- Energy consumption.
- Production output.
- Cycle time.
- Quality.
- Downtime.
- Equipment condition.
Stage 9: Standardise Successful Changes
If the adjustment produces sustained improvement, incorporate it into:
- Work instructions.
- Maintenance procedures.
- Inspection plans.
- Operating procedures.
- Training material.
Practical Comparison of Workflow Options
| Workflow adjustment | Main loss addressed | Expected benefit | Production-speed consideration | Verification method |
|---|---|---|---|---|
| Improve lubrication control | Friction and wear | Lower resistance | Maintain operating speed | Temperature and energy trend |
| Improve shaft alignment | Misalignment losses | Reduced vibration and wear | Maintain rated speed | Alignment and vibration data |
| Reduce idle running | Unproductive energy use | Lower energy consumption | Maintain active cycle rate | Energy and utilisation data |
| Optimise material flow | Unnecessary movement | Lower handling energy | Maintain throughput | Cycle-time and output data |
| Improve bearing monitoring | Degradation and friction | Longer component life | Maintain operating speed | Vibration and temperature |
| Correct belt tension | Slip and excessive resistance | Better power transmission | Maintain production rate | Tension and energy data |
| Improve maintenance sequencing | Unnecessary downtime | Higher equipment availability | Protect production schedule | Downtime records |
| Reduce excessive vibration | Mechanical energy losses | Improved stability | Maintain production speed | Vibration trend |
Measuring Energy Improvement
Energy improvement should be measured using comparable operating conditions.
Useful indicators include:
Total energy consumption
Measures total energy used during the defined period.
Energy per unit
A useful calculation is:
Energy intensity = Energy consumed ÷ Acceptable production output
Mechanical efficiency
A general engineering representation is:
Mechanical efficiency = Useful mechanical output ÷ Mechanical input × 100
Production throughput
Measures whether production output has been maintained.
Cycle time
Measures how long the process takes to produce an acceptable unit.
Evaluating Friction-Related Improvements
Friction is not always measured directly in a production environment. Engineers may therefore use indicators that reveal changes associated with friction.
These can include:
- Bearing temperature.
- Vibration.
- Lubricant condition.
- Motor loading where applicable.
- Component wear.
- Energy consumption.
- Maintenance frequency.
A reduction in temperature and vibration combined with stable production output can provide useful evidence that a mechanical adjustment has improved operating conditions.
Maintaining Production Speed
The critical constraint is that energy efficiency must not be achieved by simply slowing the equipment.
A technically sound improvement should preserve:
- Required machine speed.
- Production cycle time.
- Product quality.
- Required capacity.
- Equipment reliability.
- Safety controls.
For example, reducing conveyor speed may reduce energy consumption but also reduce throughput. This is not necessarily a successful solution.
A better approach may be to:
- Reduce unnecessary conveyor operation.
- Improve bearing condition.
- Correct alignment.
- Reduce unnecessary material travel.
- Improve lubrication.
Case Study: Reducing Mechanical Energy Losses in a Conveyor System
Background
A manufacturing facility operates a continuous conveyor system. Production output is stable, but energy consumption has gradually increased.
Maintenance records indicate:
- Increasing bearing temperatures.
- Higher vibration at selected conveyor stations.
- Increased lubrication interventions.
- Several alignment adjustments.
- Increasing energy consumption per production unit.
Production speed cannot be reduced because the conveyor is linked to downstream processing equipment.
Investigation
The engineering team establishes a baseline using:
- Energy consumption.
- Production throughput.
- Bearing temperature.
- Vibration.
- Maintenance frequency.
- Operating hours.
The investigation identifies three major issues:
- Misalignment at selected drive sections.
- Inconsistent lubrication practices.
- Unnecessary conveyor operation during short production interruptions.
Proposed Workflow Adjustments
The team recommends:
- Standardising alignment verification after relevant maintenance.
- Introducing controlled lubrication procedures.
- Establishing condition-monitoring checks for critical bearings.
- Introducing a controlled standby procedure for defined non-production periods.
- Monitoring energy intensity per production unit.
Implementation
The changes are introduced without reducing the conveyor’s required production speed.
Technicians receive updated maintenance instructions and inspection requirements.
Energy consumption and equipment-condition data are monitored during the following production period.
Results
After implementation, the engineering team observes:
- Lower energy consumption per unit.
- More stable bearing temperatures.
- Reduced vibration.
- Fewer lubrication-related interventions.
- Maintained production throughput.
The improvement is therefore based on reducing mechanical and workflow losses rather than reducing production speed.
Quality Assurance and Quality Control Considerations
Efficiency improvements must remain compatible with QA/QC requirements.
The engineering team should verify that workflow changes do not cause:
- Increased dimensional defects.
- Increased rejection rates.
- Reduced process consistency.
- Inadequate inspection opportunities.
- Uncontrolled equipment changes.
- Reduced traceability.
A successful efficiency improvement should therefore be evaluated using multiple dimensions:
Energy + Quality + Production + Reliability + Safety
Safety Considerations
Workflow changes must not bypass safety-critical controls.
Before implementation, consider:
- Machine guarding.
- Isolation requirements.
- Safe access.
- Lockout and isolation procedures.
- Emergency stops.
- Safe maintenance access.
- Operator interaction.
- Stored energy.
- Rotating equipment hazards.
For example, reducing idle running should never involve bypassing a safety interlock or changing a control function without appropriate engineering assessment.
Common Mistakes to Avoid
Reducing machine speed to save energy
This may reduce energy but compromise production output.
Over-lubricating components
More lubricant does not necessarily mean less friction.
Ignoring alignment
Lubrication alone cannot compensate for serious mechanical misalignment.
Measuring energy without production
A reduction in total energy means little if output has also fallen substantially.
Changing workflows without baseline data
Without baseline measurements, improvement cannot be demonstrated objectively.
Focusing on one KPI
Energy, quality, reliability and production should be considered together.
Ignoring maintenance records
Historical records can reveal recurring causes of energy and friction losses.
Implementing changes without verification
A workflow adjustment should be measured after implementation to confirm the intended result.
Key Benefits of Practical Workflow Adjustments
A well-designed mechanical workflow adjustment can deliver:
- Reduced energy consumption.
- Lower friction losses.
- Reduced mechanical wear.
- Improved bearing life.
- Reduced vibration.
- Lower operating temperatures.
- Reduced maintenance frequency.
- Improved equipment availability.
- Lower unplanned downtime.
- Maintained production throughput.
- Improved process stability.
- Improved component reliability.
- Reduced lifecycle costs.
- Improved environmental performance.
- Stronger asset-integrity management.
Recommended Engineering Decision Framework
When designing a workflow adjustment, the engineering team should evaluate:
Technical suitability
Does the adjustment address the actual mechanical loss?
Production impact
Can the change maintain required production speed and throughput?
Quality impact
Will product quality remain stable or improve?
Reliability impact
Will component life and equipment condition be maintained or improved?
Safety impact
Does the change preserve all required safeguards?
Maintenance impact
Can the new workflow be consistently maintained?
Measurement capability
Can the improvement be objectively demonstrated?
Long-term sustainability
Can the new workflow become part of normal operational practice?
Action Plan for Implementation
A practical implementation plan can contain:
- Define the equipment and process boundary.
- Establish the current energy and production baseline.
- Identify significant friction and mechanical losses.
- Review maintenance and inspection history.
- Determine the root causes of unnecessary losses.
- Develop alternative workflow adjustments.
- Assess technical and safety implications.
- Select the preferred intervention.
- Define measurable success criteria.
- Implement the change under controlled conditions.
- Monitor energy and production performance.
- Compare before-and-after results.
- Review equipment condition.
- Document lessons learned.
- Standardise the successful workflow.
Conclusion
Designing practical workflow adjustments to reduce energy consumption and friction losses requires an engineering approach that balances efficiency with production, quality, reliability and safety. The most effective solutions do not simply slow machines or reduce operating activity. Instead, they identify unnecessary mechanical resistance, inefficient movement, poor lubrication, misalignment, excessive vibration, avoidable idle operation and ineffective maintenance practices, then redesign the workflow to remove those losses while preserving the required production rate.
Data should provide the foundation for the decision. Baseline energy consumption, production throughput, cycle time, vibration, temperature, maintenance frequency and component-condition information can reveal where losses occur and provide measurable evidence for improvement. Following implementation, the same indicators can demonstrate whether the new workflow has genuinely reduced energy intensity and friction-related losses without creating quality defects, downtime or safety problems. Through this structured process of measurement, analysis, controlled implementation and verification, mechanical engineering teams can improve system efficiency while maintaining reliable, safe and high-quality production.
3. Justify Safety Upgrade Proposals by Balancing the Costs of New High-Quality Parts Against the Long-Term Reduction of Operational Risks and Workplace Hazards
Safety upgrades in mechanical systems require more than identifying a technically superior component and recommending its immediate replacement. A professional engineering proposal must demonstrate why the upgrade is necessary, how the proposed component reduces identified risks, what the implementation will cost, and whether the expected long-term benefits justify the investment. In mechanical QA/QC and reliability engineering, this means combining safety evidence, equipment-condition data, failure history, maintenance records, lifecycle costs and operational consequences into a structured engineering justification.
A high-quality replacement part may have a higher purchase price than the existing component, but its value cannot be assessed solely through initial procurement cost. Improved materials, better sealing, higher load capacity, greater corrosion resistance, improved wear performance or more reliable safety features may reduce failures, maintenance interventions, unplanned downtime and exposure to hazardous conditions. The engineering decision should therefore consider the total lifecycle effect of the proposed upgrade. The central question is not simply “How much will the new component cost?” but rather “What level of risk will it reduce, what operational benefits will it provide, and what will continued use of the existing arrangement cost over its remaining life?”
For a Chartered Electrical Engineer, Senior Electrical QA/QC Engineer or multidisciplinary engineering professional working with mechanical systems, this approach is particularly important where mechanical component failure can affect electrical equipment, production systems, process containment, rotating machinery, control systems or personnel safety. A robust safety-upgrade proposal should consequently combine technical suitability, risk reduction, quality assurance, financial justification and long-term asset performance.
Purpose of Safety Upgrade Proposals
The primary purpose of a safety upgrade proposal is to demonstrate that a proposed engineering improvement provides sufficient risk reduction and operational value to justify its implementation cost.
A strong proposal should establish a logical relationship:
Existing hazard → Risk evidence → Proposed safety upgrade → Cost → Risk reduction → Long-term benefit → Verification
This prevents safety investments from being justified solely through assumptions.
A professional proposal should answer:
- What hazard currently exists?
- What evidence demonstrates the risk?
- What could happen if the existing condition remains?
- What component or engineering change is proposed?
- How does the proposed solution reduce the risk?
- What will implementation cost?
- What future costs could be avoided?
- How will the improvement be verified?
Key Concepts and Definitions
| Key concept | Definition | Relevance to safety upgrades |
|---|---|---|
| Safety upgrade | Engineering improvement intended to reduce risk or improve protection | Provides the proposed intervention |
| Hazard | Source or situation with potential to cause harm | Establishes what the upgrade must control |
| Risk | Combination of likelihood and consequence of harm | Provides the basis for prioritising improvements |
| Risk reduction | Decrease in the likelihood or consequence of an unwanted event | Demonstrates safety benefit |
| Lifecycle cost | Total cost associated with acquisition, installation, operation, maintenance and replacement | Provides a realistic economic comparison |
| Initial cost | Cost incurred to purchase and implement the upgrade | Represents short-term investment |
| Operational risk | Risk arising from normal or abnormal equipment operation | Helps determine the need for improvement |
| Workplace hazard | Condition that could cause injury, ill health, damage or other harm | Connects engineering performance to workplace safety |
| High-quality component | Component manufactured and specified to appropriate technical and quality requirements | May provide improved reliability and risk control |
| Failure consequence | Effect produced when a component or system fails | Helps determine safety and business significance |
| Preventive action | Action taken to reduce the likelihood of an undesirable event | Supports proactive risk management |
| Residual risk | Risk remaining after controls have been implemented | Helps determine whether further action is necessary |
| Downtime cost | Financial and operational impact of equipment unavailability | Important in lifecycle justification |
| Maintenance cost | Resources required to inspect, service, repair or replace equipment | Forms part of the economic evaluation |
| Cost-benefit assessment | Structured comparison of investment against expected benefits | Supports investment decisions |
| Risk-based prioritisation | Ranking improvements according to risk significance | Helps allocate resources effectively |
| Verification | Evidence confirming that the safety improvement works as intended | Demonstrates effectiveness |
Understanding the Cost of Safety
The cost of a safety upgrade is normally broader than the purchase price of the replacement part.
Potential costs include:
- Component purchase.
- Engineering assessment.
- Design modification.
- Installation labour.
- Equipment isolation.
- Testing.
- Commissioning.
- Inspection.
- Training.
- Documentation.
- Production downtime.
- Specialist tools.
- Future maintenance.
The proposal should identify relevant cost categories rather than presenting only the supplier quotation.
Understanding the Cost of Doing Nothing
A critical part of engineering justification is assessing the consequence of maintaining the existing arrangement.
Continuing with an existing low-performing component may result in:
- Repeated failures.
- Emergency maintenance.
- Unplanned downtime.
- Product damage.
- Secondary equipment damage.
- Leakage.
- Mechanical release of energy.
- Exposure to hazardous conditions.
- Increased maintenance workload.
- Higher long-term replacement costs.
Therefore:
Upgrade cost ≠ total cost of the upgrade decision
The real comparison is often:
Cost of upgrade
versus
Cost and risk of continued operation
Risk-Based Justification
A safety upgrade should be based on the significance of the hazard.
Risk assessment should consider:
- Likelihood of failure.
- Potential severity.
- Frequency of exposure.
- Number of people potentially affected.
- Existing safeguards.
- Detectability of deterioration.
- Historical failure information.
- Operating conditions.
- Consequences for production and assets.
A component with a low purchase cost may still require urgent replacement if its failure could result in severe consequences.
Identifying the Safety Gap
The first technical stage is identifying the difference between the existing condition and the required level of performance.
For example:
Existing condition:
Mechanical coupling repeatedly fails and creates unexpected equipment movement.
Required condition:
Coupling should maintain controlled torque transmission under the specified operating conditions.
Safety gap:
Existing component does not provide adequate reliability under actual operating conditions.
Proposed solution:
Install a more suitable coupling with verified load and operating capability.
This makes the recommendation evidence-based.
Using Historical Failure Data
Historical data provide powerful evidence when justifying an upgrade.
Relevant information includes:
- Number of failures.
- Failure frequency.
- Component operating hours.
- Failure mechanisms.
- Repair frequency.
- Maintenance cost.
- Downtime.
- Safety-related consequences.
- Replacement intervals.
A recurring pattern provides stronger evidence than an isolated failure.
For example, if a component has failed eight times over two years under comparable operating conditions, continued reliance on the same component should be critically evaluated.
Analysing Failure Consequences
The engineering team should determine what happens when the component fails.
Possible consequences include:
Safety consequences
- Unexpected movement.
- Loss of containment.
- Flying fragments.
- Hot surfaces.
- Mechanical collapse.
- Exposure to stored energy.
Operational consequences
- Production stoppage.
- Reduced throughput.
- Emergency maintenance.
- Quality defects.
Equipment consequences
- Secondary damage.
- Shaft damage.
- Bearing damage.
- Gear damage.
- Coupling damage.
Environmental consequences
Where applicable:
- Fluid release.
- Contamination.
- Material loss.
- Exposure to hazardous substances.
Selecting a High-Quality Replacement
A higher-quality component should be selected based on demonstrated technical suitability rather than brand reputation alone.
Evaluation criteria may include:
- Material quality.
- Load capacity.
- Temperature capability.
- Pressure capability.
- Wear resistance.
- Corrosion resistance.
- Fatigue resistance.
- Sealing performance.
- Dimensional compatibility.
- Manufacturing consistency.
- Inspection requirements.
- Expected service life.
The proposed component should satisfy the actual service requirements.
Why Higher Initial Cost May Be Justified
A more expensive component may provide:
- Longer service life.
- Lower failure frequency.
- Reduced maintenance.
- Reduced downtime.
- Improved safety.
- Better environmental resistance.
- Greater operational stability.
For example:
Existing component: £500
Expected life: 6 months
Proposed component: £1,200
Expected life: 24 months
The proposed component costs more initially, but the cost per year of service may be substantially lower.
This illustrates why lifecycle evaluation is more informative than purchase price alone.
Lifecycle Cost Analysis
Lifecycle analysis should consider:
Initial purchase + installation + maintenance + downtime + replacement + disposal
A simplified comparison might be:
| Cost element | Existing component | Proposed component |
|---|---|---|
| Purchase | £500 | £1,200 |
| Installation | £300 | £350 |
| Annual maintenance | £1,000 | £500 |
| Expected replacement frequency | High | Low |
| Unplanned downtime | High | Reduced |
| Safety exposure | Higher | Lower |
| Expected service life | 6 months | 24 months |
The values are illustrative only. Actual decisions should use verified project-specific costs.
Considering Downtime
Downtime can significantly influence the financial justification.
A component failure may require:
- Equipment isolation.
- Fault diagnosis.
- Spare-part procurement.
- Component removal.
- Installation.
- Testing.
- Restarting.
- Production recovery.
If each failure creates significant downtime, the economic value of improved reliability can exceed the additional component purchase cost.
Quantifying Avoided Costs
The proposal should identify realistic avoided costs.
Potential avoided costs include:
- Emergency repair labour.
- Replacement components.
- Specialist contractors.
- Production losses.
- Secondary equipment damage.
- Additional inspections.
- Quality-related losses.
However, estimates should be supported by credible historical information.
Safety Benefit and Financial Benefit
A safety upgrade may generate two broad categories of benefit.
Direct benefits
These can include:
- Lower maintenance cost.
- Reduced downtime.
- Fewer replacement components.
- Reduced energy losses.
- Reduced emergency intervention.
Risk-reduction benefits
These can include:
- Reduced likelihood of injury.
- Reduced likelihood of equipment failure.
- Reduced exposure to hazardous conditions.
- Improved containment.
- Improved mechanical integrity.
Not every safety benefit can be converted precisely into monetary value. This does not make the benefit irrelevant.
Hierarchy of Engineering Controls
When considering a safety upgrade, the engineering team should consider whether the proposed solution effectively controls the hazard at its source.
Engineering improvements may include:
- Stronger components.
- Improved guarding.
- Improved containment.
- Better fail-safe arrangements.
- Improved interlocking.
- Improved mechanical restraint.
- Improved isolation.
- More reliable protective devices.
The preferred approach should address the hazard effectively rather than relying solely on operator behaviour.
Balancing Safety and Cost
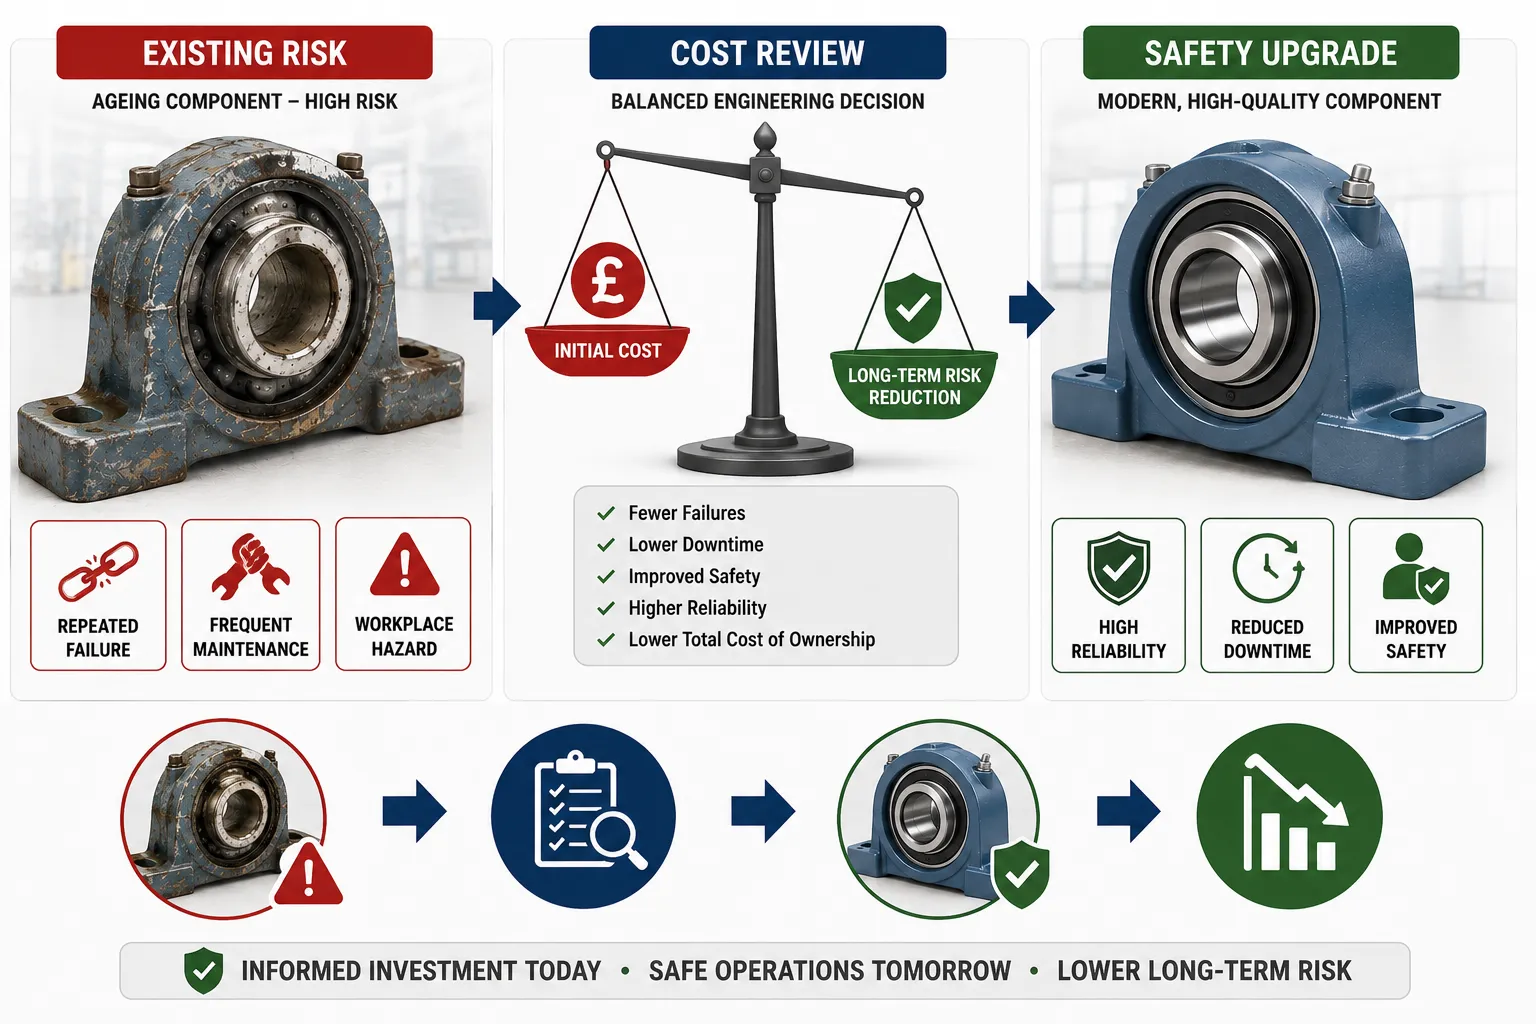
Cost should be considered as part of engineering decision-making, but it should not override essential safety requirements.
The decision should consider:
Risk significance + technical effectiveness + lifecycle cost + operational impact
A low-cost solution that leaves a significant residual risk may not be an acceptable engineering recommendation.
Conversely, an extremely expensive solution that provides little additional risk reduction may require further evaluation against alternative controls.
Developing a Safety Upgrade Proposal
A professional proposal can follow a structured process.
Step 1: Define the Existing Problem
Document:
- Component involved.
- Equipment involved.
- Failure history.
- Current operating condition.
- Existing controls.
Step 2: Establish the Risk
Determine:
- Hazard.
- Exposure.
- Likelihood.
- Consequence.
- Existing safeguards.
Step 3: Gather Evidence
Use:
- Inspection reports.
- Maintenance records.
- Failure reports.
- Condition-monitoring data.
- Non-conformance reports.
- Operating records.
Step 4: Identify Upgrade Options
Consider:
- Improved component.
- Design modification.
- Additional protection.
- Improved monitoring.
- Improved maintenance control.
Step 5: Compare Options
Evaluate:
- Technical performance.
- Safety benefit.
- Reliability.
- Cost.
- Installation complexity.
- Maintenance requirements.
Step 6: Select the Preferred Solution
Choose the option that provides an appropriate balance of:
Risk reduction + technical suitability + lifecycle value
Step 7: Develop the Implementation Plan
Define:
- Responsibilities.
- Installation requirements.
- Inspection.
- Testing.
- Commissioning.
- Documentation.
Step 8: Verify the Outcome
Measure:
- Failure frequency.
- Downtime.
- Maintenance demand.
- Condition data.
- Safety performance.
Technical Data Required for a Strong Proposal
The proposal should use relevant technical information.
This may include:
- Component specification.
- Design load.
- Actual operating load.
- Temperature.
- Pressure.
- Speed.
- Material.
- Environmental exposure.
- Failure mode.
- Expected service life.
- Inspection results.
This information allows the engineering team to demonstrate that the proposed component is technically justified.
Example: Upgrading a Mechanical Coupling
A production machine uses a coupling that has experienced repeated failures.
Historical records show:
- Six failures in 18 months.
- Frequent emergency interventions.
- Increased vibration before several failures.
- Production interruptions.
- Secondary bearing damage.
Existing arrangement
The current coupling is relatively inexpensive but has demonstrated limited reliability under actual operating conditions.
Proposed alternative
A higher-quality coupling is evaluated with:
- Higher torque capability.
- Improved misalignment tolerance.
- Greater fatigue resistance.
- Appropriate dimensional compatibility.
Cost assessment
Although the new coupling has a higher purchase price, the engineering team calculates that it could reduce:
- Emergency replacements.
- Bearing damage.
- Downtime.
- Maintenance labour.
Safety assessment
The improved coupling is also expected to reduce the likelihood of sudden mechanical transmission failure.
Recommendation
The proposal recommends replacement because the alternative addresses both reliability and safety concerns while offering improved lifecycle value.
Example: Upgrading a Valve
A process valve repeatedly develops leakage.
Historical data show:
- Frequent seal replacement.
- Increasing maintenance intervention.
- Production interruptions.
- Potential exposure to the released process medium.
The proposed valve has:
- Improved sealing.
- Suitable pressure and temperature ratings.
- More appropriate materials.
- Improved service-life characteristics.
The recommendation should demonstrate that the additional investment provides a reduction in leakage risk and maintenance burden.
Example: Upgrading Bearings
A bearing operates in a contaminated environment and fails frequently.
The proposed replacement has:
- Improved sealing.
- Better contamination resistance.
- Suitable load capacity.
- Appropriate temperature capability.
The engineering justification should compare:
- Current failure rate.
- Expected service life.
- Maintenance frequency.
- Downtime.
- Safety implications.
- Lifecycle cost.
Risk Reduction Matrix
A simple risk-based comparison can support the recommendation.
| Factor | Existing component | Proposed component | Expected improvement |
|---|---|---|---|
| Failure frequency | High | Lower | Improved reliability |
| Maintenance demand | High | Moderate | Reduced intervention |
| Downtime | Significant | Reduced | Improved availability |
| Mechanical integrity | Marginal | Improved | Lower failure risk |
| Workplace exposure | Higher | Lower | Reduced hazard exposure |
| Initial cost | Lower | Higher | Higher investment |
| Lifecycle value | Lower | Higher | Improved long-term value |
Monitoring After Implementation
A safety upgrade should be followed by performance verification.
Useful indicators include:
- Failure frequency.
- MTBF.
- Maintenance interventions.
- Downtime.
- Leakage incidents.
- Vibration.
- Temperature.
- Wear.
- Inspection findings.
- Safety-related events.
The monitoring period should be appropriate to the equipment and failure mechanism.
Establishing Acceptance Criteria
Before implementation, define what constitutes success.
Examples include:
- No repeat failure during the defined monitoring period.
- Reduced maintenance interventions.
- Reduced vibration.
- Reduced leakage.
- Increased component life.
- Reduced downtime.
- Improved inspection results.
Clear acceptance criteria prevent subjective claims of success.
QA/QC Controls for Safety Upgrades
QA/QC processes should verify:
- Correct component specification.
- Material certification where applicable.
- Dimensional compatibility.
- Manufacturing quality.
- Inspection results.
- Installation quality.
- Torque requirements.
- Alignment.
- Testing.
- Documentation.
The upgrade should be traceable from procurement through installation and verification.
Change Management
A component upgrade can affect the wider system.
Potential changes include:
- Maintenance procedures.
- Spare-parts requirements.
- Installation methods.
- Inspection plans.
- Operating instructions.
- Training requirements.
Therefore, the change should be controlled and documented.
Common Errors in Safety Upgrade Proposals
Focusing only on purchase price
The cheapest component may have the highest lifecycle cost.
Using vague safety claims
Statements such as “safer component” should be supported by evidence.
Ignoring existing failure data
Historical records provide important evidence of risk.
Selecting components without checking compatibility
A technically superior component can still be unsuitable if it does not match the application.
Ignoring installation quality
Poor installation can undermine the safety benefit.
Treating maintenance reduction as the only benefit
Safety, reliability, quality and availability should also be evaluated.
Failing to define verification criteria
Without measurable outcomes, the proposal cannot be objectively evaluated.
Key Benefits of Justified Safety Upgrades
A properly justified upgrade can provide:
- Reduced workplace hazards.
- Reduced component failure risk.
- Improved mechanical integrity.
- Lower emergency maintenance.
- Reduced downtime.
- Improved equipment reliability.
- Longer component service life.
- Reduced lifecycle costs.
- Improved quality performance.
- Improved operational stability.
- Reduced exposure to hazardous conditions.
- Better asset integrity.
- Stronger QA/QC control.
- Better engineering decision-making.
Professional Recommendation Format
A concise engineering recommendation can use the following structure:
Existing Condition
Describe the current component and documented limitations.
Evidence
Present measurable performance and failure data.
Risk
Explain the potential consequences.
Proposed Upgrade
Describe the proposed high-quality component or engineering modification.
Technical Justification
Explain why the alternative is suitable.
Financial Justification
Compare initial and lifecycle costs.
Safety Benefit
Explain the expected reduction in operational risk.
Implementation
Describe installation, testing and commissioning.
Verification
Define how performance and risk reduction will be measured.
Case Study: Safety Upgrade of a High-Load Mechanical Assembly
Background
A manufacturing facility operates a high-load rotating assembly that has experienced repeated component failures. The failures have not resulted in a major injury, but several incidents have required emergency intervention and created exposure to mechanical hazards.
Maintenance records indicate:
- Increasing failure frequency.
- Repeated component replacement.
- Emergency maintenance activity.
- Increasing vibration before failure.
- Production downtime.
- Secondary damage to adjacent components.
Initial Assessment
The engineering team determines that continued reliance on the existing component represents an increasing operational risk.
The investigation reviews:
- Actual operating load.
- Component specification.
- Failure history.
- Maintenance records.
- Vibration data.
- Installation quality.
- Environmental conditions.
Upgrade Proposal
A higher-quality alternative is identified with:
- Greater load capability.
- Improved fatigue resistance.
- Better environmental protection.
- Longer expected service life.
- Improved compatibility with the operating conditions.
Cost Evaluation
The proposed component has a higher purchase price.
However, the engineering team estimates potential reductions in:
- Emergency maintenance.
- Production downtime.
- Secondary component damage.
- Replacement frequency.
- Maintenance labour.
Safety Evaluation
The proposed component is expected to reduce the probability of sudden failure and therefore reduce exposure to mechanical hazards.
Implementation
The upgrade plan includes:
- Controlled isolation.
- Removal of the existing component.
- Inspection of interfaces.
- Installation of the replacement.
- Alignment verification.
- Torque verification.
- Functional testing.
- Condition monitoring.
Verification
Performance is monitored through:
- Vibration.
- Temperature.
- Failure frequency.
- Maintenance requirements.
- Downtime.
The results are compared against the pre-upgrade baseline.
Engineering Conclusion
The higher initial cost is justified because the upgrade provides a combined safety, reliability and lifecycle benefit that cannot be adequately represented by purchase price alone.
Practical Decision Checklist
Before approving a safety upgrade recommendation, confirm that:
- The existing hazard has been clearly identified.
- Failure evidence has been reviewed.
- Operating conditions have been verified.
- The proposed component is technically suitable.
- Safety benefits are clearly defined.
- Lifecycle costs have been considered.
- Installation requirements are understood.
- QA/QC requirements are identified.
- Residual risk has been considered.
- Performance indicators have been established.
- Post-installation verification is planned.
Conclusion
Justifying safety upgrade proposals requires engineering professionals to balance immediate investment against long-term improvements in safety, reliability, quality and operational performance. A high-quality component should not be recommended simply because it is newer or more expensive. Its selection should be supported by evidence demonstrating that the existing component presents a meaningful performance or safety limitation and that the proposed alternative provides a technically credible improvement under actual operating conditions.
The strongest justification combines historical failure data, inspection findings, operating information, maintenance records, risk assessment and lifecycle cost analysis. It considers not only the purchase price of the new component but also installation, maintenance, downtime, emergency repair, secondary damage and the potential consequences of continued operation. This creates a more complete engineering comparison between the cost of upgrading and the cost and risk of maintaining the existing condition.
A professionally developed safety upgrade proposal should ultimately demonstrate three things: the existing condition creates a credible risk or performance weakness, the proposed upgrade provides measurable risk reduction and technical improvement, and the long-term benefits justify the investment. By applying this structured approach, mechanical QA/QC and engineering teams can make defensible safety decisions that strengthen component reliability, reduce workplace hazards, improve asset integrity and support safer, more efficient long-term operations.