
Lesson 5: Implement control charts, KPIs, and performance metrics to maintain high-quality standards.
Maintaining consistently high-quality standards in mechanical engineering and manufacturing requires more than periodic inspection; it depends on continuous measurement, statistical control, and timely management intervention. Lesson 5, “Implement control charts, KPIs, and performance metrics to maintain high-quality standards”, develops a practical understanding of how quality professionals can use control charts, key performance indicators (KPIs), and engineering performance metrics to monitor process stability, detect variation, and support evidence-based quality decisions. The lesson examines how statistical process monitoring can distinguish normal process behaviour from emerging instability, while performance metrics provide structured evidence about dimensional conformity, defect rates, rework, productivity, equipment reliability, process capability, and overall quality performance.
Effective implementation requires the integration of data collection, analysis, interpretation, escalation, and continual improvement into the quality management process. Control charts can provide an early indication of unusual process behaviour, while appropriately selected KPIs help engineering and QA/QC teams evaluate whether manufacturing processes remain within defined quality and operational expectations. By connecting statistical evidence with practical engineering judgement, organisations can identify emerging problems before they develop into repeated defects, excessive rework, equipment-related failures, or customer non-conformities. The lesson therefore supports a systematic approach to quality control in machining, fabrication, welding, mechanical assembly, inspection, and production environments.
From a professional QA/QC perspective, the effective use of control charts and performance metrics strengthens process visibility, accountability, traceability, and continual improvement. It enables engineering teams to move from reactive defect detection towards proactive process control by establishing measurable quality objectives, monitoring trends, investigating significant variation, and implementing corrective or preventive actions based on reliable evidence. The principles covered in this lesson are applicable across modern mechanical engineering and manufacturing environments where maintaining dimensional accuracy, process consistency, component reliability, production efficiency, and regulatory or organisational quality expectations is essential.
1 Construct appropriate control charts, such as X-bar and R charts, to visually monitor daily variations in critical mechanical dimensions
Statistical process control (SPC) provides a structured method for determining whether a mechanical manufacturing process remains statistically stable over time. In machining, fabrication, welding, grinding, turning, milling, drilling and mechanical assembly, critical dimensions can vary because of tool wear, machine condition, material characteristics, temperature, operator practices, fixture condition and measurement influences. The purpose of an appropriate control chart is not simply to display measurements; it is to transform repeated dimensional observations into a visual representation of process behaviour so that engineering and QA/QC personnel can identify unusual variation, investigate potential causes and maintain control before non-conforming components are produced.
For Level 6 mechanical engineering practice, constructing an X-bar and R chart requires more than plotting a series of numbers. The engineer must understand the characteristic being measured, define a rational sampling subgroup, establish a suitable measurement system, calculate the relevant statistical parameters, determine control limits, interpret points and patterns correctly, and connect statistical signals with physical manufacturing conditions. When applied correctly, control charts become an important part of a data-driven quality management system because they provide evidence about process stability and support timely engineering intervention.
Understanding statistical process control in mechanical engineering
Statistical process control is a method of monitoring process performance using statistical information collected from production activities. In a mechanical manufacturing environment, SPC can be applied to characteristics such as shaft diameter, bore diameter, plate thickness, component length, hole position, surface-related measurements where appropriate, pressure-related production characteristics, or other measurable quality characteristics that are critical to product conformity.
A control chart normally contains measured process data plotted against an ordered sequence, together with a central line and statistically derived upper and lower control limits. These limits describe the expected range of process variation under the conditions represented by the data. They are not the same as engineering specification limits.
This distinction is fundamental. Specification limits define what the product is required to achieve. Control limits describe how the process is behaving. A process can be statistically stable but still produce components outside specification if its natural variation is centred incorrectly or is too wide. Conversely, a process can remain within specification while showing evidence of instability that requires investigation.
Key SPC principles include:
Collecting measurements in a consistent manner.
Using an appropriate sampling strategy.
Grouping observations rationally.
Establishing a representative baseline.
Calculating control limits from process data.
Plotting observations in chronological order.
Distinguishing common-cause and special-cause variation.
Investigating statistically unusual patterns.
Avoiding unnecessary process adjustment.
Linking statistical findings with physical engineering evidence.
Why control charts are important for critical mechanical dimensions
Critical mechanical dimensions frequently have a direct relationship with component fit, function, interchangeability, load transfer, sealing, alignment and assembly performance. A small dimensional shift can therefore become significant when tolerances are narrow or when components operate within demanding mechanical systems.
For example, consider a machined shaft with a specified nominal diameter. Measurements may initially remain close to the target value, but gradual tool wear could cause the diameter to drift in one direction. If inspection occurs only after a large production batch has been completed, numerous components may already require rework or rejection.
A control chart can provide earlier visibility of the change.
The chart may reveal:
A gradual upward or downward trend.
An unusual isolated measurement.
A sudden shift in process level.
Increasing spread between measurements.
Repeated cycles of variation.
A concentration of points on one side of the centre line.
Evidence that the process has changed from its established behaviour.
This allows the QA/QC engineer to investigate before the situation becomes a larger quality problem.
X-bar charts and R charts
An X-bar chart is used to monitor changes in the average value of a process. The term “X-bar” represents the arithmetic mean of observations within a subgroup.
An R chart monitors the within-subgroup range. The range is calculated as the difference between the largest and smallest observation in the subgroup.
The two charts are normally interpreted together.
The X-bar chart primarily answers:
“Has the process average changed?”
The R chart primarily answers:
“Has the short-term process variation changed?”
This combination is valuable because a process may experience a shift in its average while maintaining similar variation, or it may experience an increase in variation without a substantial change in its average.
Related definitions and key concepts
| Term | Definition | Mechanical engineering application |
|---|---|---|
| Statistical Process Control | A statistical approach for monitoring and controlling process behaviour | Monitoring machining or fabrication characteristics |
| Control chart | A graphical tool showing process observations against a centre line and control limits | Tracking dimensional stability over production |
| X-bar chart | A chart used to monitor subgroup averages | Monitoring average shaft diameter |
| R chart | A chart used to monitor within-subgroup range | Monitoring short-term dimensional variation |
| Subgroup | A defined set of observations collected under similar conditions | Five consecutive shaft measurements |
| Centre line | The estimated central process value represented on a control chart | Average shaft diameter |
| Upper Control Limit | Statistical boundary above which process behaviour may indicate unusual variation | Detecting an unusual dimensional increase |
| Lower Control Limit | Statistical boundary below which process behaviour may indicate unusual variation | Detecting an unusual dimensional decrease |
| Common-cause variation | Variation arising from the normal system of process causes | Routine machine and material variation |
| Special-cause variation | Variation associated with an identifiable unusual influence | Tool damage or fixture disturbance |
| Specification limit | Engineering acceptance boundary for the product | Drawing tolerance |
| Process stability | Condition in which process behaviour remains statistically predictable | Consistent machining performance |
| Process capability | Ability of a stable process to meet specification requirements | Producing shafts within tolerance |
Selecting the mechanical characteristic to monitor
The first practical decision is determining which dimensional characteristic requires statistical monitoring. Not every measurement needs an X-bar and R chart. SPC is most useful when the characteristic has a meaningful relationship with product quality, process performance or functional requirements.
Appropriate characteristics may include:
Shaft diameter.
Bore diameter.
Component thickness.
Length of a precision-machined feature.
Hole diameter.
Keyway dimensions.
Bearing-seat dimensions.
Flange thickness.
Critical alignment dimensions.
Machined shoulder dimensions.
Repeated dimensional features affecting assembly.
The engineer should consider:
The importance of the characteristic to component function.
The tolerance width.
The frequency of measurement.
The stability of the measurement method.
The production volume.
The consequences of dimensional drift.
The availability of reliable historical data.
The suitability of the selected chart type.
Establishing a reliable measurement system
A control chart is only as reliable as the measurements used to construct it. If the measurement system introduces excessive variation, the chart may indicate instability even when the manufacturing process is reasonably stable.
Before collecting SPC data, the measurement system should therefore be assessed for suitability.
Important considerations include:
Appropriate instrument resolution.
Calibration status.
Measurement range.
Instrument condition.
Correct measurement technique.
Fixture or gauge condition.
Environmental influences.
Operator consistency.
Measurement location on the component.
Unit consistency.
Data recording accuracy.
For example, if shaft diameter is being monitored using a micrometer, the engineer should confirm that the micrometer is suitable for the required dimensional range and resolution and is correctly calibrated. Measurements should be taken consistently at the defined measurement locations.
Designing rational subgroups
One of the most important concepts in constructing X-bar and R charts is rational subgrouping.
A subgroup should contain observations collected under sufficiently similar process conditions so that the within-subgroup variation represents short-term process variation.
For example, five consecutive components produced by the same machine, using the same tool condition and material batch, may form a rational subgroup.
A possible sampling structure could be:
Subgroup 1: Components 1–5.
Subgroup 2: Components 6–10.
Subgroup 3: Components 11–15.
Subgroup 4: Components 16–20.
The process should be monitored consistently rather than randomly combining unrelated measurements.
Poor subgrouping can make the control chart difficult to interpret. If measurements from different machines, material batches and operating conditions are mixed without consideration, the range may become artificially large and the chart may fail to represent the intended process behaviour.
Constructing the X-bar chart

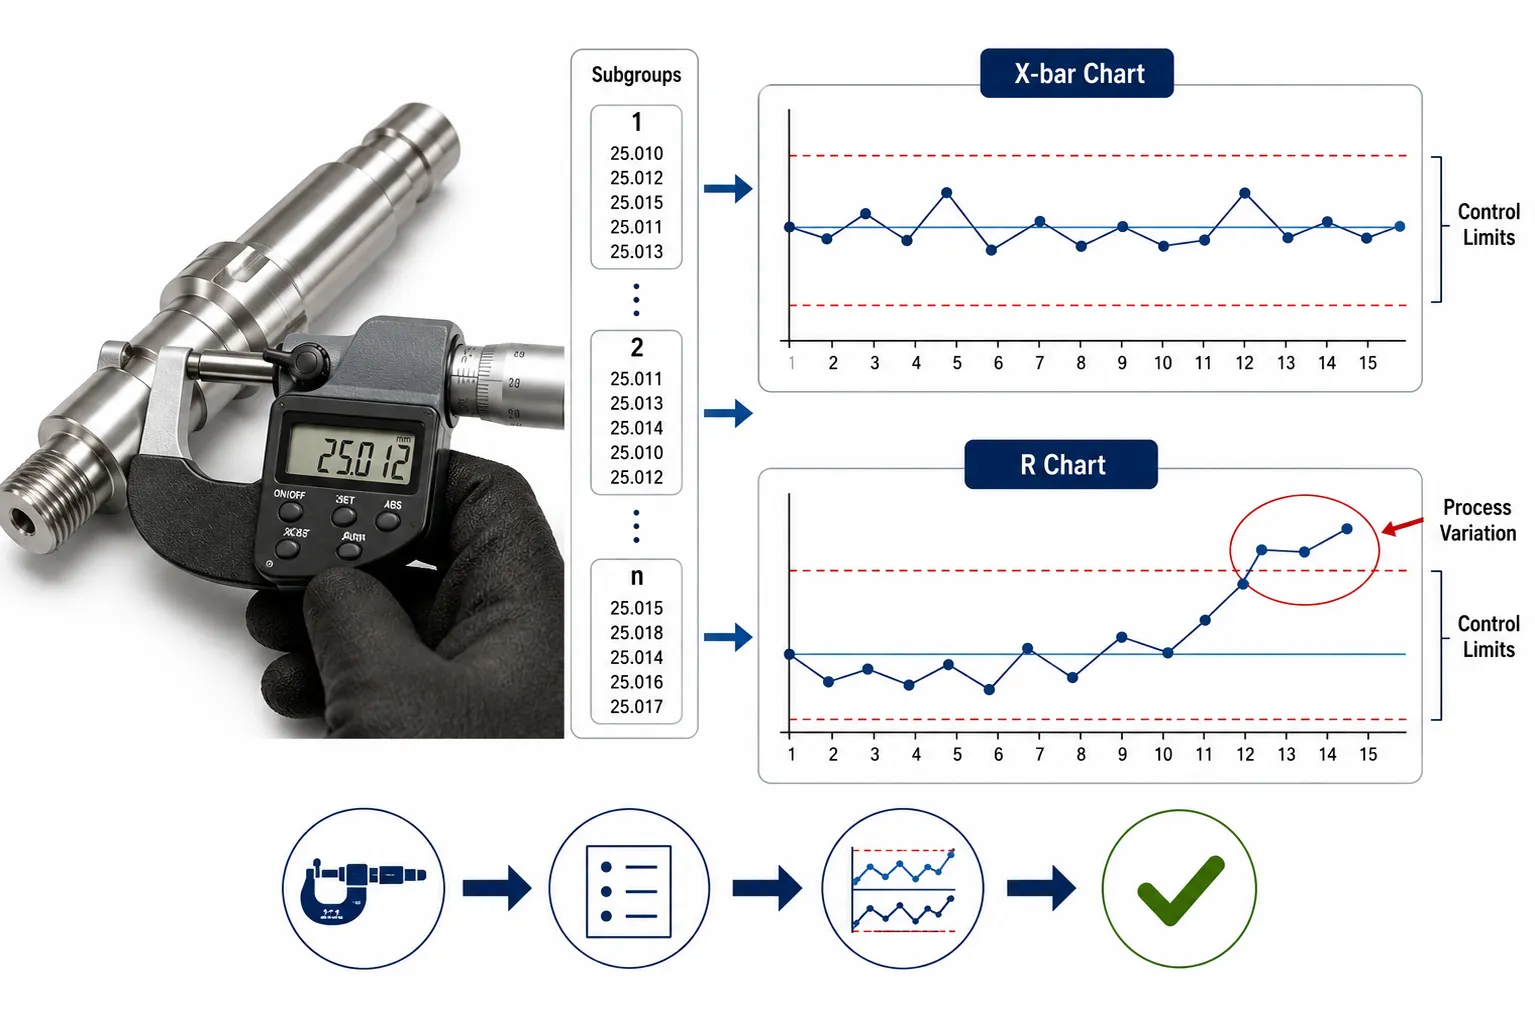
The X-bar chart begins with the calculation of the mean for each subgroup.
For a subgroup containing five observations:
[
\bar{X}=\frac{X_1+X_2+X_3+X_4+X_5}{5}
]
Suppose the measured shaft diameters for one subgroup are:
50.01 mm
50.02 mm
50.00 mm
50.01 mm
50.02 mm
The subgroup average is:
[
\bar{X}=\frac{50.01+50.02+50.00+50.01+50.02}{5}
]
[
\bar{X}=50.012\text{ mm}
]
The same calculation is repeated for each subgroup.
The subgroup averages are then plotted chronologically.
The engineer can subsequently assess whether the average process position remains consistent or whether there is evidence of a shift.
Constructing the R chart
The range for each subgroup is calculated as:
[
R=X_{\text{maximum}}-X_{\text{minimum}}
]
For the example above:
[
R=50.02-50.00
]
[
R=0.02\text{ mm}
]
The range is calculated for every subgroup.
The resulting R values are plotted chronologically on the R chart.
The R chart provides information about short-term variation within each subgroup. A sudden increase in range can indicate that the process has become less consistent even when the subgroup average remains close to the target.
Calculating the average range
Once the subgroup ranges have been calculated, the average range is determined:
[
\bar{R}=\frac{R_1+R_2+\cdots+R_k}{k}
]
where:
(\bar{R}) is the average range.
(R_1, R_2,\ldots,R_k) are subgroup ranges.
(k) is the number of subgroups.
The average range contributes to the calculation of X-bar and R chart control limits.
Establishing control limits
For an X-bar and R chart, control limits are generally calculated using established statistical constants appropriate to the subgroup size.
For the X-bar chart:
[
UCL_{\bar{X}}=\bar{\bar{X}}+A_2\bar{R}
]
[
CL_{\bar{X}}=\bar{\bar{X}}
]
[
LCL_{\bar{X}}=\bar{\bar{X}}-A_2\bar{R}
]
For the R chart:
[
UCL_R=D_4\bar{R}
]
[
CL_R=\bar{R}
]
[
LCL_R=D_3\bar{R}
]
where:
(\bar{\bar{X}}) is the average of subgroup averages.
(\bar{R}) is the average subgroup range.
(A_2), (D_3) and (D_4) are statistical constants determined by subgroup size.
In professional practice, the appropriate constants should be taken from a recognised statistical reference or validated SPC software rather than being guessed.
Control limits versus specification limits
This distinction should be emphasised throughout mechanical QA/QC practice.
Control limits are derived from process behaviour.
Specification limits are derived from engineering requirements.
For example, a shaft may have:
Nominal dimension: 50.00 mm.
Lower specification limit: 49.95 mm.
Upper specification limit: 50.05 mm.
These limits describe product acceptance.
The control chart may have narrower or differently positioned control limits based on the actual statistical behaviour of the process.
A point beyond a control limit indicates unusual process behaviour, while a point beyond a specification limit indicates a product conformity issue.
The two situations can overlap, but they are not interchangeable.
Interpreting the X-bar chart
The X-bar chart should be reviewed for evidence that the process average has changed.
Important signals may include:
A point outside the control limits.
A sustained run of points on one side of the centre line.
A consistent upward trend.
A consistent downward trend.
A sudden shift following a process intervention.
Repeated patterns associated with specific production conditions.
An isolated point outside the control limit should not automatically lead to an adjustment of the machine. The engineer should first investigate whether the measurement is valid and whether a special cause can be identified.
Possible physical causes include:
Tool replacement.
Tool damage.
Fixture movement.
Machine adjustment.
Material change.
Temperature change.
Operator intervention.
Incorrect machine setting.
Measurement-system issue.
Interpreting the R chart
The R chart should be considered before making conclusions from the X-bar chart because it provides information about within-subgroup variation.
An increasing R value can indicate:
Tool deterioration.
Fixture instability.
Material inconsistency.
Measurement inconsistency.
Increased machine vibration.
Operator variation.
Process disturbance.
A stable average with an unstable range is particularly important because the process may still be centred around the desired value while becoming increasingly unpredictable.
Why the R chart should not be ignored
Suppose five measurements in each subgroup have an average of approximately 25.00 mm. The X-bar chart may appear stable.
However, if the individual values progressively spread from:
24.99–25.01 mm
to:
24.95–25.05 mm,
the average could remain close to 25.00 mm while variation increases significantly.
This is precisely why the X-bar and R charts should normally be interpreted together.
The X-bar chart identifies changes in process location.
The R chart identifies changes in short-term dispersion.
Recognising common-cause and special-cause variation
A control chart supports the distinction between expected process variation and unusual variation.
Common-cause variation arises from the normal combination of influences inherent in the process.
Examples may include:
Normal machine variation.
Routine material variation.
Typical environmental conditions.
Normal tool behaviour.
Established operator technique.
Special-cause variation arises from an identifiable unusual influence.
Examples may include:
Broken cutting tool.
Loose fixture.
Incorrect machine offset.
Damaged gauge.
Incorrect material batch.
Sudden machine malfunction.
Unusual temperature condition.
The engineering response should differ depending on the type of variation identified.
Recommended control-chart workflow
A practical SPC implementation can follow this sequence:
Identify the critical mechanical characteristic.
Define the measurement method.
Confirm measurement-system suitability.
Select the appropriate control-chart type.
Define rational subgroup size.
Establish the sampling frequency.
Collect measurements consistently.
Calculate subgroup averages.
Calculate subgroup ranges.
Calculate overall average values.
Establish statistically appropriate control limits.
Plot the data chronologically.
Monitor the X-bar chart.
Monitor the R chart.
Investigate unusual signals.
Identify potential special causes.
Document findings.
Implement justified corrective action.
Continue monitoring after intervention.
Review the chart periodically as part of continual improvement.
Practical example: monitoring a machined shaft
A precision machining cell produces shafts with a nominal diameter of 40.00 mm. The engineering team identifies shaft diameter as a critical characteristic because dimensional variation affects downstream assembly.
Five consecutive shafts are measured at defined intervals.
The data is grouped into rational subgroups of five observations.
The QA/QC engineer then:
Records each measurement.
Calculates the subgroup average.
Calculates the subgroup range.
Establishes the overall average.
Calculates the average range.
Establishes X-bar and R control limits.
Plots each subgroup chronologically.
Reviews the chart for unusual signals.
After several production periods, the X-bar chart begins to show a gradual upward movement.
The R chart remains relatively stable.
This pattern suggests that the process average may be shifting while short-term variation remains relatively consistent. The engineer should therefore investigate factors capable of changing the process centre, such as tool wear, machine offset or process-setting changes.
A suitable investigation might examine:
Tool age.
Number of components machined since tool replacement.
Machine offset history.
Operator adjustments.
Material batch.
Machine temperature.
Recent maintenance.
Measurement records.
The chart does not itself identify the physical cause. It provides statistical evidence that directs the engineering investigation.
Practical example: increasing range during drilling
A drilling operation produces holes with a nominal diameter of 12.00 mm. The X-bar chart remains close to the process centre, but the R chart begins showing increasingly large ranges.
The QA/QC engineer should not conclude that the process is fully satisfactory simply because the average remains stable.
Potential causes may include:
Drill deterioration.
Fixture instability.
Increased vibration.
Material hardness variation.
Measurement inconsistency.
Machine spindle condition.
The appropriate response is to investigate the source of increasing short-term variation before the process produces non-conforming components.
Using control charts for preventive quality management
Control charts are particularly valuable because they support proactive quality management. Traditional inspection often identifies defects after they have occurred. SPC can provide earlier warning of changing process behaviour.
This supports:
Early intervention.
Reduced scrap.
Reduced rework.
Better dimensional consistency.
Improved production stability.
More predictable manufacturing performance.
Improved equipment monitoring.
Evidence-based process adjustment.
Stronger QA/QC decision-making.
However, control charts should not be treated as automatic decision systems. Statistical evidence should be interpreted alongside engineering knowledge, production conditions, measurement information and relevant quality requirements.
Common errors when constructing X-bar and R charts
Several mistakes can reduce the value of SPC.
Using specification limits as control limits
Specification limits are acceptance requirements, whereas control limits describe statistical process behaviour. Substituting one for the other can result in incorrect process interpretation.
Using inconsistent measurement methods
Changing gauges, measurement locations or procedures during data collection can introduce artificial variation.
Mixing unrelated processes
Data from different machines, tools or operating conditions may not represent a single homogeneous process.
Adjusting the process after every small movement
Routine variation should not automatically trigger machine adjustments. Excessive adjustment can increase instability rather than reduce it.
Ignoring the R chart
Focusing only on subgroup averages can conceal increasing process variation.
Failing to investigate special causes
A statistically unusual signal should lead to a structured investigation rather than being ignored.
Using insufficient or unrepresentative data
Control limits based on unsuitable baseline data may not represent actual process behaviour.
Key benefits of X-bar and R charts
When appropriately designed and maintained, X-bar and R charts provide several benefits to mechanical engineering quality systems:
Visual identification of process changes.
Early detection of unusual variation.
Improved dimensional consistency.
Reduced dependence on reactive inspection.
Better understanding of process behaviour.
Evidence-based engineering intervention.
Improved machine-process monitoring.
Reduced unnecessary process adjustment.
Reduced scrap and rework opportunities.
Stronger production traceability.
Better communication between production and QA/QC teams.
Support for continual improvement.
Integrating control charts with QA/QC decision-making
A control chart should form part of a broader quality-control workflow rather than operate independently. When a significant statistical signal occurs, the QA/QC team should determine whether the signal represents a measurement problem, a genuine special cause or a change that has already been formally introduced into the process.
A structured response can include:
Verify the measurement.
Confirm the data entry.
Check the relevant machine.
Review tool condition.
Examine fixture condition.
Review material information.
Check process settings.
Review maintenance activity.
Identify recent interventions.
Determine whether affected product requires additional evaluation.
Record the investigation.
Implement corrective action where justified.
Continue monitoring after intervention.
Using SPC results for continual improvement
The long-term value of control charts extends beyond detecting individual problems. Historical control-chart information can reveal recurring process behaviour and support broader improvement programmes.
Engineering teams can examine:
Long-term process centring.
Changes in process variation.
Relationship between tool life and dimensional drift.
Effect of maintenance interventions.
Impact of parameter changes.
Performance differences between machines.
Relationship between production conditions and quality results.
This information can subsequently support process capability studies, preventive maintenance decisions, process optimisation and engineering improvement plans.
Conclusion
Constructing X-bar and R charts for critical mechanical dimensions provides a disciplined statistical method for monitoring process stability and identifying changes before they develop into significant quality problems. The X-bar chart provides visibility of changes in the subgroup average, while the R chart provides visibility of within-subgroup variation. Together, they allow mechanical engineering and QA/QC teams to distinguish stable process behaviour from unusual signals that may require investigation. Correct application depends on suitable characteristics, reliable measurement systems, rational subgrouping, representative data, statistically appropriate control limits and disciplined interpretation.
The greatest value of SPC is achieved when statistical information is connected with practical engineering knowledge. A control chart does not replace professional judgement; it strengthens that judgement by providing objective evidence about process behaviour. When control charts are integrated with inspection records, machine-condition information, tool history, production data and corrective-action processes, organisations can move towards proactive quality management. This supports dimensional consistency, reduces avoidable defects and rework, strengthens process reliability and provides a measurable foundation for continual improvement across mechanical manufacturing and engineering operations.
2 Define clear Key Performance Indicators (KPIs) that accurately measure the quality, rejection rate, and efficiency of a mechanical inspection team
Key Performance Indicators (KPIs) provide a structured way to translate mechanical inspection activities into measurable evidence about quality, conformity, efficiency and operational performance. In a mechanical engineering QA/QC environment, an inspection team may perform dimensional inspections, material verification, visual examinations, mechanical testing, assembly checks, documentation reviews and final product verification. Without clearly defined KPIs, large volumes of inspection information can remain disconnected from management decision-making. A well-designed KPI framework converts inspection results into meaningful measures that can reveal recurring defects, rejection patterns, inspection productivity, process weaknesses and opportunities for continual improvement.
For Level 6 mechanical engineering practice, KPI development requires more than selecting easily measurable numbers. A technically appropriate KPI must have a clear purpose, defined calculation method, reliable data source, responsible owner, reporting frequency and meaningful performance threshold. It should also support the organisation’s quality objectives without encouraging behaviours that compromise inspection integrity. For example, measuring only the number of inspections completed may encourage speed while overlooking the quality of inspection decisions. A stronger framework combines quality, rejection, effectiveness, efficiency, responsiveness and process-performance indicators so that inspection performance is evaluated as a balanced system.
Understanding KPIs in mechanical QA/QC
A Key Performance Indicator is a measurable value used to evaluate whether a defined objective or performance expectation is being achieved. In mechanical inspection, KPIs should provide useful evidence about the effectiveness and efficiency of inspection activities and their contribution to overall product quality.
A KPI normally connects four elements:
A defined performance objective.
A measurable indicator.
A reliable data source.
A decision or action associated with the result.
For example, if the objective is to improve inspection effectiveness, a KPI might measure the percentage of inspection findings correctly identified before product release. If the objective is to improve inspection efficiency, the KPI might measure inspection cycle time while maintaining required inspection coverage.
A strong KPI should therefore answer a practical question such as:
Are inspections identifying significant defects?
Are rejection rates changing?
Are inspection activities being completed within planned times?
Is rework increasing?
Are inspection findings recurring?
Are inspectors identifying defects early enough?
Are inspection resources being used effectively?
Is inspection performance supporting production without compromising quality?
Difference between metrics and KPIs
Not every measurement is automatically a KPI. A metric may simply record information, whereas a KPI is deliberately selected because it provides evidence about an important organisational or operational objective.
For example:
Number of inspections completed is a metric.
Percentage of planned inspections completed on time may be a KPI.
Number of rejected components is a metric.
Rejection rate against the defined quality objective may be a KPI.
Inspection hours is a metric.
Average inspection time per accepted unit, when used against a defined efficiency objective, can function as a KPI.
This distinction is important because an organisation can collect hundreds of measurements without gaining meaningful performance insight.
Core KPI categories for a mechanical inspection team

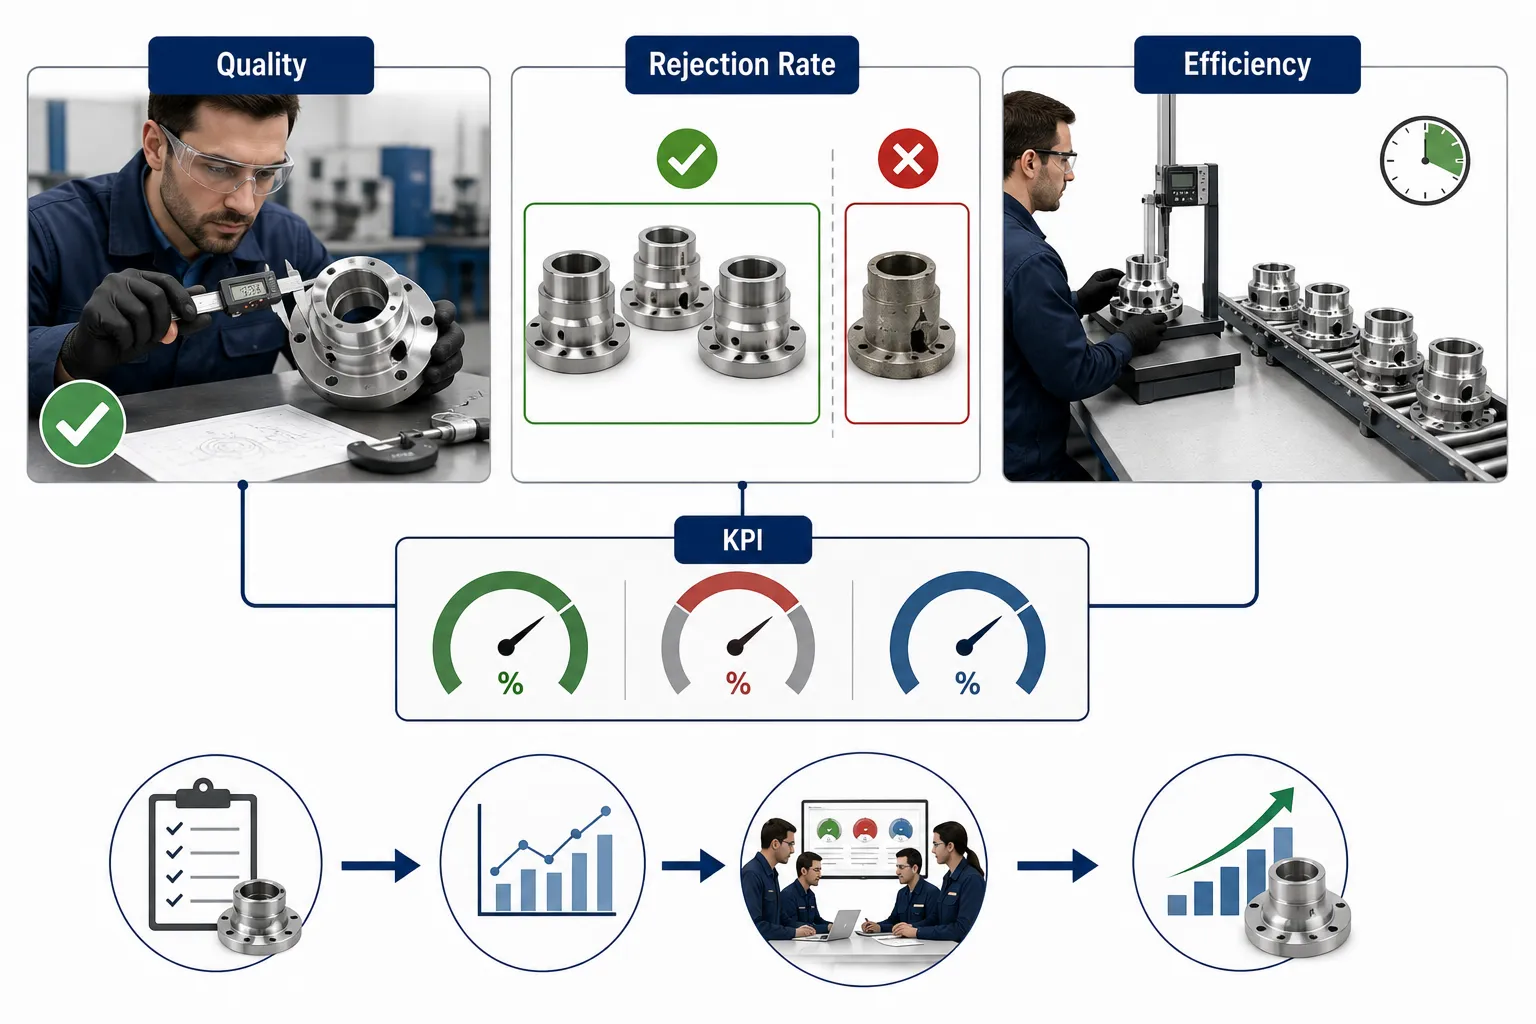
A balanced mechanical inspection KPI framework can be organised around several categories.
Quality performance.
Rejection performance.
Inspection effectiveness.
Inspection efficiency.
Rework and defect recurrence.
Timeliness.
Data and documentation quality.
Corrective-action performance.
Process improvement.
Customer or internal acceptance performance.
The exact KPI set should reflect the inspection team’s responsibilities, the nature of the mechanical processes and the organisation’s quality objectives.
Related definitions and key concepts
| Term | Definition | Mechanical inspection application |
|---|---|---|
| KPI | A measurable indicator linked to an important performance objective | Measuring inspection quality or efficiency |
| Quality KPI | Indicator measuring conformity or effectiveness of quality activities | First-pass acceptance rate |
| Rejection rate | Percentage of inspected units rejected against a defined population | Monitoring rejected mechanical components |
| Inspection efficiency | Relationship between inspection resources used and inspection output | Inspection time per component |
| First-pass acceptance | Percentage of items accepted without rework or repeat inspection | Measuring initial inspection effectiveness |
| Defect rate | Frequency of identified defects within a defined population | Tracking dimensional or assembly defects |
| Rework rate | Percentage of items requiring corrective processing | Monitoring inspection-related rework |
| Inspection cycle time | Time required to complete a defined inspection activity | Measuring dimensional inspection duration |
| KPI target | Defined performance level expected for an indicator | Target rejection or completion rate |
| KPI threshold | Boundary that triggers review or intervention | Escalation level for rising rejection |
| Data integrity | Accuracy, completeness and reliability of performance data | Ensuring inspection KPI calculations are trustworthy |
| Trend | Direction or pattern of KPI performance over time | Detecting increasing rejection rates |
| Baseline | Established reference performance used for comparison | Previous-quarter inspection performance |
| Corrective action | Action taken to address an identified problem or cause | Addressing recurring inspection failures |
Establishing the purpose of each KPI
The first step in KPI development is to define what the organisation wants to understand or improve.
A KPI should not be selected simply because the data is easy to collect. Instead, the engineering team should first identify the management question that requires evidence.
For example:
Are mechanical components meeting specified requirements?
Is the inspection team identifying defects effectively?
Are inspection activities taking too long?
Are rejection levels increasing?
Is rework being driven by recurring defects?
Are inspections being completed according to schedule?
Are quality findings being closed within expected times?
Once the question has been established, the team can select the appropriate indicator.
Measuring inspection quality
Quality KPIs should demonstrate whether inspection activities effectively support conformity and defect prevention.
Potential quality indicators include:
First-pass acceptance rate.
Defect detection rate.
Defect recurrence rate.
Inspection finding accuracy.
Percentage of inspection records completed correctly.
Percentage of critical inspection points completed.
Repeat inspection rate.
Non-conformance identification rate.
Inspection-related escape rate.
Corrective-action effectiveness.
The purpose is not to encourage inspectors to find either more or fewer defects. The purpose is to determine whether inspection activities are effectively identifying genuine quality conditions and supporting appropriate action.
First-pass acceptance rate
First-pass acceptance measures the proportion of inspected items accepted without requiring rework or additional corrective processing.
A basic calculation can be expressed as:
First-Pass Acceptance Rate=Total items inspectedItems accepted at first inspection×100
For example, if 950 components are inspected and 902 pass first inspection:
950902×100=94.95%
This KPI can help identify whether the manufacturing process is consistently producing acceptable components.
However, the inspection team should avoid interpreting this KPI in isolation. A very high first-pass acceptance rate could be positive, but it could also indicate inadequate inspection coverage if other quality evidence shows significant defects escaping detection.
Rejection rate
Rejection rate is one of the most important indicators for mechanical inspection teams.
A basic formula is:
Rejection Rate=Total units inspectedRejected units×100
For example, if 40 components are rejected from 1,000 inspected:
100040×100=4%
The KPI becomes particularly useful when tracked over time and segmented by relevant categories.
The inspection team may analyse rejection rate by:
Production line.
Machine.
Component type.
Supplier.
Material batch.
Shift.
Defect category.
Manufacturing process.
Product family.
Inspection stage.
This prevents a single overall rejection figure from hiding important patterns.
Why rejection rate requires careful interpretation
A rising rejection rate does not automatically mean that inspection performance has deteriorated.
Several different situations may produce an increase:
Manufacturing quality has declined.
Inspection coverage has increased.
A previously missed defect is now being detected.
Acceptance criteria have changed.
A new component has been introduced.
A particular material batch is defective.
Measurement methods have changed.
A supplier has changed its production process.
Therefore, rejection rate should be interpreted alongside other KPIs and supporting evidence.
Inspection efficiency KPIs
Inspection efficiency concerns how effectively the team uses time, equipment and personnel while maintaining the required inspection standard.
Potential efficiency indicators include:
Average inspection cycle time.
Inspections completed per inspector-hour.
Percentage of planned inspections completed on schedule.
Average turnaround time for inspection reports.
Repeat inspection time.
Waiting time caused by inspection bottlenecks.
Inspection resource utilisation.
Percentage of inspection tasks completed within planned duration.
Efficiency must never be interpreted as simply “inspect faster”.
A mechanical inspection team must maintain appropriate inspection depth, measurement accuracy, traceability and technical judgement. An inspection process that is faster but produces unreliable results is not genuinely efficient.
Inspection cycle time
Inspection cycle time is the elapsed time required to complete a defined inspection activity.
For example, an organisation may monitor the average time required to complete dimensional inspection of a particular component.
A basic calculation is:
Average Inspection Time=Number of inspectionsTotal inspection time
If 1,200 minutes are spent completing 100 inspections:
1001200=12 minutes per inspection
This KPI can help identify opportunities to improve inspection workflows.
However, the organisation should distinguish between legitimate inspection time and avoidable delay.
Avoidable time may include:
Searching for inspection equipment.
Waiting for documents.
Re-entering data.
Waiting for component identification.
Repeating measurements because records were incomplete.
Waiting for access to equipment.
Measuring defect detection effectiveness
An effective inspection team should identify significant non-conformities before they progress to later stages or reach the customer.
Possible indicators include:
Defects detected at incoming inspection.
Defects detected during in-process inspection.
Defects detected at final inspection.
Defects detected after release.
Internal quality escapes.
Customer-reported defects.
Repeat defects following corrective action.
A particularly useful principle is to examine where defects are being detected.
If many defects are identified only at final inspection, the organisation may need to strengthen earlier process controls rather than simply increasing final inspection capacity.
Quality escapes
A quality escape occurs when a non-conforming condition passes through the intended inspection or control system and is discovered later.
Quality escape indicators can therefore provide valuable evidence about inspection effectiveness.
A quality escape KPI may consider:
Number of escapes.
Escape rate per defined production volume.
Severity of escaped defects.
Detection stage.
Recurrence.
Corrective-action effectiveness.
The severity of an escape should also be considered because one critical defect may be more significant than numerous minor discrepancies.
Rework rate
Rework represents additional processing required to bring a component or assembly into conformity.
A basic rework rate may be calculated as:
Rework Rate=Total units processed/Units requiring rework×100
Tracking rework can help identify the relationship between inspection findings and manufacturing process performance.
An increase in rework may indicate:
Process instability.
Poor parameter control.
Inadequate first-stage inspection.
Recurring dimensional problems.
Material issues.
Assembly errors.
Weak process controls.
KPI design using SMART principles
Effective KPIs should be clearly defined and measurable. A useful framework is to ensure that each KPI is:
Specific.
Measurable.
Achievable.
Relevant.
Time-bound.
For example, instead of stating:
“Improve inspection efficiency.”
A stronger KPI objective would be:
“Reduce average dimensional inspection cycle time by 10% over the next reporting period while maintaining defined inspection coverage and record accuracy.”
This formulation gives the team a measurable objective while preventing efficiency from being pursued at the expense of inspection quality.
Establishing KPI baselines
Before setting improvement targets, the organisation should establish a baseline.
A baseline provides a realistic reference point for current performance.
Baseline information can include:
Current rejection rate.
Current first-pass acceptance.
Current average inspection time.
Current rework rate.
Current quality escape rate.
Current inspection backlog.
Current corrective-action closure time.
Historical data should be checked for comparability before being used as a baseline.
For example, a rejection rate from a previous period may not be directly comparable if:
The component population changed.
Inspection criteria changed.
Production volume changed significantly.
Measurement methods changed.
The inspection scope changed.
Setting meaningful KPI targets
KPI targets should reflect organisational requirements and actual process capability.
Targets should be:
Realistic.
Evidence-based.
Relevant to quality objectives.
Clearly defined.
Time-bound.
Reviewed periodically.
A target that is excessively aggressive may encourage inappropriate behaviour.
For example, setting an objective of “zero rejected components” may appear desirable, but if it causes inspectors or production teams to avoid recording genuine defects, the KPI has become counterproductive.
A better approach may be to monitor:
Rejection rate.
Defect severity.
Defect recurrence.
Process capability.
Escape rate.
Corrective-action effectiveness.
Balancing quality and efficiency KPIs
A sophisticated KPI system should avoid relying on a single performance measure.
For example, measuring only inspections completed per hour could create pressure to shorten inspection times. The team may then risk overlooking important defects.
A balanced KPI framework might combine:
First-pass acceptance rate.
Rejection rate.
Quality escape rate.
Inspection cycle time.
Inspection record accuracy.
Repeat inspection rate.
Corrective-action closure.
Defect recurrence.
This creates a more complete picture of performance.
Example KPI framework for a mechanical inspection team
| KPI | Example measurement | Purpose | Possible management response |
|---|---|---|---|
| First-pass acceptance | Accepted first inspection ÷ total inspected | Monitor initial conformity | Investigate declining performance |
| Rejection rate | Rejected ÷ inspected × 100 | Monitor non-conforming output | Analyse defect trends |
| Inspection cycle time | Total inspection time ÷ inspections | Monitor efficiency | Remove avoidable delays |
| Rework rate | Reworked units ÷ processed units × 100 | Identify process quality issues | Investigate recurring causes |
| Quality escape rate | Escaped defects ÷ defined output | Assess inspection effectiveness | Strengthen controls |
| Record accuracy | Correct records ÷ audited records × 100 | Assess documentation quality | Improve data controls |
| Inspection completion | Completed inspections ÷ planned inspections × 100 | Monitor schedule adherence | Address capacity constraints |
| Defect recurrence | Repeated defects ÷ total defects | Assess corrective-action effectiveness | Conduct deeper investigation |
| Corrective-action closure | Actions closed within target period | Monitor responsiveness | Escalate overdue actions |
| Inspection productivity | Completed inspections ÷ inspector-hours | Assess resource efficiency | Review workload and workflow |
Practical example: improving a dimensional inspection team
Consider a mechanical manufacturing facility where the inspection team verifies machined shafts, sleeves and housings.
Management initially uses only one KPI:
“Number of components inspected per shift.”
The team consistently meets the target, but production records show increasing rework and several dimensional issues reaching final assembly.
The KPI framework is therefore redesigned.
New indicators include:
First-pass acceptance rate.
Rejection rate.
Average inspection cycle time.
Rework rate.
Dimensional defect recurrence.
Quality escapes.
Inspection record accuracy.
After several reporting periods, the data shows that the inspection team completes a high number of inspections but spends significant time repeating measurements because measurement records are incomplete.
The organisation responds by improving data-entry procedures and standardising inspection documentation.
The result is:
Reduced repeat inspection.
Better traceability.
More reliable KPI data.
Improved inspection turnaround.
Better visibility of recurring defects.
This illustrates why inspection productivity should not be evaluated through a single output measure.
Practical example: analysing a rising rejection rate
Suppose the monthly rejection rate changes as follows:
January: 2.1%.
February: 2.4%.
March: 3.0%.
April: 4.2%.
The increase should trigger investigation rather than an immediate conclusion.
The QA/QC team may segment the data by:
Machine.
Component.
Defect type.
Supplier.
Material batch.
Shift.
Inspection stage.
Suppose the analysis shows that most of the increase originates from one machining cell and involves bore diameter.
The team can then investigate:
Tool condition.
Machine alignment.
Fixture condition.
Process parameters.
Measurement method.
Recent maintenance.
Operator adjustments.
The KPI therefore acts as an early warning signal rather than merely a monthly reporting figure.
Practical example: balancing inspection speed and quality
An inspection team reduces average inspection time from 15 minutes to 11 minutes per component.
At first, this appears to be a significant efficiency improvement.
However, the quality escape rate subsequently increases.
The organisation should not conclude that the team has improved simply because inspection cycle time has decreased.
A balanced review should compare:
Inspection cycle time.
First-pass acceptance.
Rejection rate.
Quality escape rate.
Inspection record accuracy.
Repeat inspection rate.
If quality escapes increase, the process requires investigation. The objective should be to remove unnecessary inspection delay while preserving the effectiveness of technical verification.
Using KPI trends rather than isolated values
A single KPI value may provide limited information. Trends often provide more useful evidence.
For example:
A rejection rate of 3% may appear acceptable when viewed independently.
However, if the trend is:
1.4%.
1.7%.
2.1%.
2.6%.
3.0%.
the direction of movement suggests a developing problem.
Trend analysis can therefore help identify:
Gradual deterioration.
Seasonal influences.
Effects of process changes.
Recurring defects.
Performance improvements.
Emerging resource constraints.
KPI review frequency
Different KPIs may require different review frequencies.
Daily monitoring may be appropriate for:
Critical rejection rates.
Inspection backlog.
Production-related defects.
Inspection completion.
Weekly review may be suitable for:
Rework.
Defect recurrence.
Inspection productivity.
Corrective actions.
Monthly or quarterly review may be appropriate for:
Long-term quality trends.
Quality escape trends.
Reliability-related inspection findings.
Strategic inspection resource performance.
The frequency should reflect how quickly the KPI can change and how quickly intervention is required.
Data integrity in KPI management
KPI decisions are only as reliable as the data behind them.
Inspection data should therefore be:
Accurate.
Complete.
Traceable.
Consistently recorded.
Properly identified.
Correctly dated.
Associated with the relevant component or batch.
Protected against unauthorised alteration.
The organisation should define:
Who records the information.
When it is recorded.
Where it is stored.
Who validates it.
Who calculates the KPI.
Who reviews the result.
How discrepancies are corrected.
Avoiding KPI manipulation
A KPI system can produce unintended behaviour if poorly designed.
For example, if inspectors are judged solely on low rejection rates, there may be pressure to classify borderline findings differently.
If inspectors are judged solely on the number of inspections completed, they may be encouraged to shorten inspection activities.
If production teams are judged solely on first-pass acceptance, they may become reluctant to report defects.
A robust KPI system should therefore promote accurate reporting rather than artificially favourable numbers.
Common KPI implementation errors
Measuring too many indicators
An excessive number of KPIs can make reporting complicated and reduce attention on important measures.
Using poorly defined formulas
If different departments calculate the same KPI differently, comparisons become unreliable.
Ignoring data quality
Incomplete or inconsistent inspection records can produce misleading results.
Focusing only on efficiency
Fast inspection is not useful if defects escape detection.
Focusing only on rejection
A high rejection rate may reflect improved defect detection rather than deteriorating inspection quality.
Setting unrealistic targets
Targets that cannot realistically be achieved can encourage undesirable behaviours.
Ignoring trends
A KPI that appears acceptable today may still show a deteriorating long-term pattern.
Benefits of a well-designed KPI system
A balanced inspection KPI framework can provide:
Improved visibility of inspection performance.
Earlier identification of quality deterioration.
Better understanding of rejection trends.
Improved resource allocation.
More effective inspection planning.
Better management of inspection workload.
Reduced avoidable inspection delays.
Improved traceability.
Stronger corrective-action monitoring.
Better communication between QA/QC and production.
More evidence-based management decisions.
Improved continual improvement.
Integrating KPIs with control charts
KPIs and control charts provide complementary information.
A KPI can show the overall performance level, while a control chart can reveal process variation and stability.
For example:
Rejection rate may show that quality performance has deteriorated.
An X-bar chart may reveal dimensional drift.
An R chart may reveal increasing variation.
Tool-history data may indicate increasing tool wear.
Maintenance records may reveal equipment deterioration.
Combining these sources creates a stronger engineering evidence base than relying on any single measure.
A practical KPI implementation process
A mechanical inspection team can establish its KPI framework through the following process:
Define the inspection team’s quality objectives.
Identify critical inspection activities.
Determine the decisions management needs to make.
Select a limited number of meaningful KPIs.
Define each KPI precisely.
Establish the calculation formula.
Identify the required data source.
Assign KPI ownership.
Establish the baseline.
Set realistic performance targets.
Define reporting frequency.
Establish escalation thresholds.
Validate the data collection method.
Pilot the KPI framework.
Review the results.
Adjust poorly performing indicators.
Integrate KPI results into management review.
Use trends to identify improvement opportunities.
Monitor unintended consequences.
Periodically review whether the KPIs remain relevant.
Conclusion
Clear and balanced KPIs provide mechanical inspection teams with an objective framework for evaluating quality, rejection performance and operational efficiency. Indicators such as first-pass acceptance, rejection rate, rework rate, inspection cycle time, quality escape rate, inspection completion and defect recurrence can transform inspection records into actionable management information. However, each KPI must be precisely defined, supported by reliable data, linked to a meaningful objective and interpreted in the context of other quality evidence. A single indicator rarely provides sufficient information to judge the effectiveness of a technical inspection function.
The most effective KPI systems combine quality and efficiency measures without allowing one objective to undermine another. When KPI trends are integrated with control charts, inspection records, process data, defect analysis and corrective-action information, mechanical engineering organisations gain a stronger evidence base for controlling quality and improving performance. This data-driven approach supports proactive QA/QC management by identifying emerging rejection trends, recurring defects, inspection bottlenecks and opportunities for process improvement while maintaining the technical integrity, traceability and reliability expected from professional mechanical inspection operations.
3 Implement a live quality dashboard or tracking matrix on the production floor to give assembly teams immediate feedback on their quality performance
A live quality dashboard or production-floor tracking matrix provides a visible, structured and continuously updated method for communicating quality performance directly to the people carrying out mechanical assembly activities. In a modern mechanical engineering and manufacturing environment, quality information is most valuable when it reaches the point of work quickly enough to influence decisions. If inspection results remain exclusively within QA/QC reports, spreadsheets or end-of-shift summaries, assembly teams may continue producing components without knowing that a defect trend, rejection increase, rework issue or process deviation is developing. A well-designed dashboard closes this information gap by connecting inspection data, production information and quality indicators with immediate operational feedback.
For Level 6 mechanical engineering practice, implementing a live quality dashboard involves considerably more than displaying a collection of numbers on a screen. The dashboard must identify relevant quality measures, establish reliable data flows, define ownership, protect data integrity, present information clearly, establish escalation rules and ensure that production personnel understand what the information means and what action is expected. The system may be digital, using a manufacturing execution system, quality management platform, spreadsheet-linked display or industrial dashboard, or it may use a structured physical tracking matrix where digital infrastructure is unavailable. In every case, the objective is the same: provide timely, accurate and actionable information that enables assembly teams and QA/QC personnel to identify quality conditions and respond before defects become systemic.
Understanding live quality dashboards in mechanical manufacturing
A live quality dashboard is a visual information system that displays current or recently updated quality performance data in a format that allows production and quality personnel to understand process conditions quickly. The information may include inspection results, rejection rates, first-pass acceptance, defects by category, rework, process capability indicators, inspection completion and corrective-action status.
A production-floor tracking matrix performs a similar function but may be structured as a physical or digital matrix showing quality status by workstation, production batch, assembly stage, component or shift.
The fundamental principle is:
Collect quality information → analyse it → display it clearly → communicate the condition → trigger appropriate action.
The system should therefore provide information that is both timely and meaningful.
A dashboard should not simply answer:
“What happened?”
It should also help answer:
- What is happening now?
- Where is the problem occurring?
- What type of defect is involved?
- Is the problem increasing?
- Which production area is affected?
- Does the issue require immediate escalation?
- What action has been initiated?
- Has the condition returned to control?
Purpose of immediate quality feedback
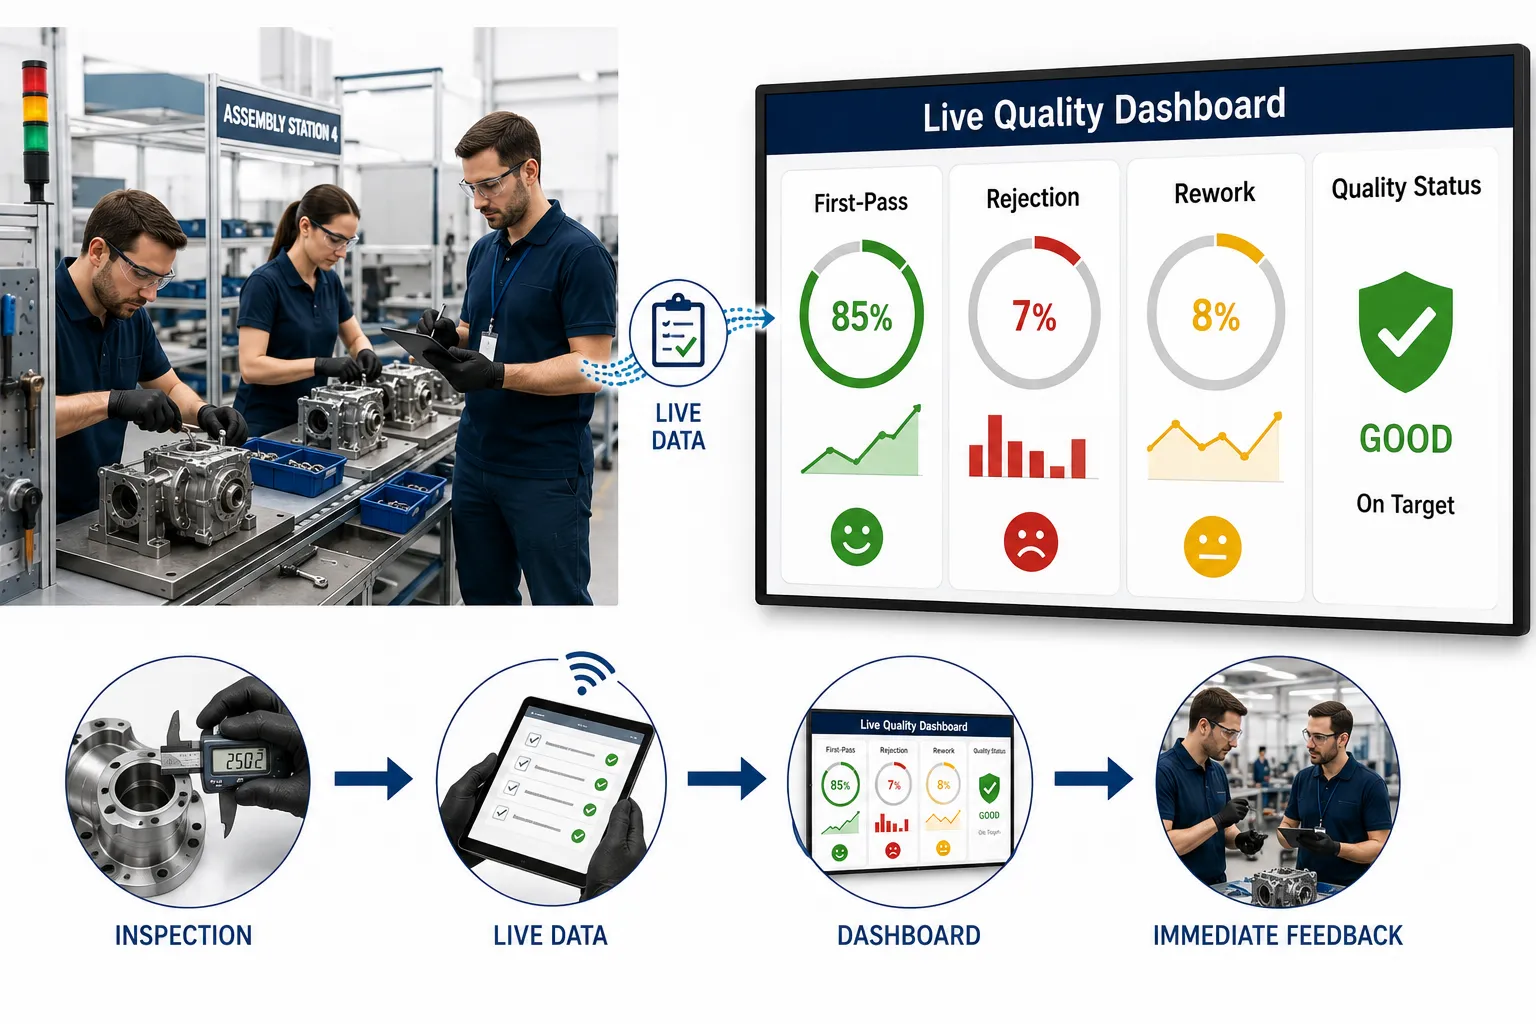
Immediate feedback supports a shift from reactive quality management towards proactive process control.
Without timely feedback, a typical sequence may be:
- Assembly produces a batch.
- Inspection identifies defects later.
- Results are compiled into a report.
- Production receives the report after several hours.
- The same process continues.
- Additional defective components are produced.
- Rework or segregation becomes necessary.
A live quality dashboard can shorten this feedback cycle.
The alternative sequence may be:
- Assembly produces components.
- Inspection results are entered or transmitted.
- Quality indicators update.
- A developing defect trend becomes visible.
- Assembly personnel and supervisors are informed.
- The process is investigated.
- Appropriate corrective action is initiated.
- Subsequent performance is monitored.
This difference can significantly influence the cost and extent of quality problems.
Related definitions and key concepts
| Term | Definition | Mechanical manufacturing application |
|---|---|---|
| Live quality dashboard | Visual display providing current or recently updated quality information | Displaying assembly rejection and defect trends |
| Tracking matrix | Structured table showing quality status across defined categories | Monitoring quality by workstation or production batch |
| Real-time data | Information available with minimal delay after collection | Immediate inspection result reporting |
| Quality status | Current condition of a defined process or product against requirements | Green, amber or red quality condition |
| First-pass acceptance | Percentage of items accepted without rework | Monitoring initial assembly conformity |
| Rejection rate | Percentage of inspected items rejected | Tracking assembly defects |
| Rework | Additional processing required to achieve conformity | Correcting assembly errors |
| Defect trend | Pattern showing how defect frequency changes over time | Detecting increasing alignment failures |
| Escalation threshold | Defined condition requiring management or technical intervention | Triggering review after repeated defects |
| Andon-style signal | Visual indication of a process or quality condition requiring attention | Alerting supervisors to an assembly issue |
| Data latency | Time between data generation and availability | Measuring delay in inspection reporting |
| Traceability | Ability to connect data to a specific product, batch or process | Linking defects to assembly station and batch |
Designing the dashboard around decisions
The most important principle in dashboard design is that every displayed metric should have a practical purpose.
A production-floor dashboard should not be designed simply because management wants more data visibility. It should support defined decisions.
For example:
- A rising rejection rate may require process investigation.
- An increasing rework rate may require review of assembly instructions.
- A repeated dimensional defect may require fixture or tooling inspection.
- A quality escape may require immediate containment.
- A missed inspection may require resource allocation.
- A worsening first-pass acceptance rate may require process review.
The dashboard should therefore connect:
Data → Information → Interpretation → Action.
Selecting appropriate quality indicators
A mechanical assembly dashboard might include:
- First-pass acceptance rate.
- Rejection rate.
- Defect count.
- Defect rate.
- Rework rate.
- Inspection completion.
- Open non-conformances.
- Recurring defect count.
- Quality escape count.
- Inspection cycle time.
- Corrective-action status.
- Process capability indicators where applicable.
The exact selection should remain focused. Displaying too many metrics can reduce clarity and make important information difficult to identify.
Designing a balanced quality dashboard
A useful dashboard should balance several dimensions of performance.
Quality
Indicators may include:
- First-pass acceptance.
- Defect rate.
- Rejection rate.
- Quality escapes.
Efficiency
Indicators may include:
- Inspection turnaround time.
- Assembly cycle time.
- Rework hours.
Stability
Indicators may include:
- Control-chart status.
- Recurring defect trends.
- Process variation.
Responsiveness
Indicators may include:
- Open corrective actions.
- Time to contain a defect.
- Time to close quality issues.
Compliance and traceability
Indicators may include:
- Inspection completion.
- Record completion.
- Traceability status.
Choosing between a dashboard and a tracking matrix
A dashboard is usually most suitable when data is available electronically and frequent updates are required.
A tracking matrix can be effective where:
- Production volume is moderate.
- Digital systems are limited.
- The process is visually managed.
- Teams need simple status information.
- Quality conditions can be represented clearly.
A physical matrix might contain:
| Assembly Station | Units Checked | Accepted | Rejected | Rework | Current Status |
|---|---|---|---|---|---|
| Station A | 48 | 46 | 2 | 1 | Review |
| Station B | 52 | 51 | 1 | 0 | Controlled |
| Station C | 45 | 42 | 3 | 2 | Action |
| Station D | 50 | 49 | 1 | 0 | Controlled |
The same information could be displayed electronically.
Establishing data sources
A dashboard depends on reliable data inputs.
Potential data sources include:
- Dimensional inspection records.
- Mechanical test results.
- Assembly inspection forms.
- Non-conformance reports.
- Rework records.
- Production quantities.
- Quality-control databases.
- Barcode or QR-based traceability systems.
- Manufacturing execution systems.
- Quality management systems.
- Approved spreadsheets.
- Inspection equipment interfaces.
The data source should be clearly identified so that personnel understand where the displayed information originates.
Establishing data ownership
A live dashboard requires defined responsibility.
The organisation should establish:
- Who collects the data.
- Who enters the data.
- Who validates it.
- Who maintains the dashboard.
- Who reviews quality trends.
- Who investigates abnormal results.
- Who authorises status changes.
- Who closes quality actions.
Without clear ownership, dashboards can become outdated or unreliable.
Data accuracy and integrity
The value of a live dashboard depends on the accuracy of the information displayed.
Poor data can result from:
- Incorrect component identification.
- Wrong batch numbers.
- Duplicate entries.
- Missing inspection results.
- Incorrect units.
- Manual transcription errors.
- Delayed data entry.
- Unauthorised modifications.
- Inconsistent defect classifications.
Controls should therefore include:
- Standardised data fields.
- Defined measurement units.
- User access controls.
- Validation checks.
- Required fields.
- Time stamps.
- Traceability identifiers.
- Revision control.
- Periodic data audits.
Managing data latency
A dashboard does not necessarily need second-by-second information. The required update frequency depends on the risk and speed of the production process.
For example:
- Critical assembly quality conditions may require immediate updates.
- Routine dimensional results may be updated every defined inspection interval.
- Daily performance summaries may be adequate for strategic KPIs.
The organisation should therefore define an acceptable data-latency period.
The key question is:
“How quickly must this information be available for it to influence the decision?”
Using visual status indicators
Production-floor dashboards often use simple visual status categories.
A common approach is:
- Green: Process performing within defined expectations.
- Amber: Performance approaching an intervention threshold.
- Red: Defined condition requiring immediate action.
However, colour should never be the only information provided. Personnel should also understand the reason for the status.
For example:
Green — First-pass acceptance within target.
Amber — Rejection rate approaching escalation threshold.
Red — Critical defect detected; production review required.
Designing clear visual hierarchy
Production personnel often have limited time to interpret information. The dashboard should therefore communicate the most important information first.
The display should prioritise:
- Current quality status.
- Critical defects or alerts.
- Current KPI performance.
- Recent trend.
- Affected workstation or batch.
- Required action.
- Responsible person.
- Action status.
Avoid unnecessary decorative graphics or excessive technical detail.
Applying Pareto analysis to production-floor quality information
A dashboard can display Pareto information to identify the most frequent defect categories.
For example:
- Incorrect alignment.
- Incorrect torque.
- Dimensional deviation.
- Missing component.
- Surface damage.
If most defects originate from two categories, the production team can focus improvement resources on those areas.
A Pareto display should support the principle of concentrating attention on the relatively small number of defect categories that contribute substantially to overall quality loss.
Using trends instead of isolated values
A current value can be misleading if viewed without historical context.
For example:
Current rejection rate = 3%.
That number alone does not reveal whether performance is improving or deteriorating.
A dashboard can instead show:
- Week 1: 1.8%.
- Week 2: 2.0%.
- Week 3: 2.4%.
- Week 4: 3.0%.
The upward trend provides a stronger reason for investigation.
Integrating control charts with the dashboard
Control charts can be incorporated into the dashboard to provide statistical information about critical process characteristics.
For example, a mechanical assembly line may monitor:
- Shaft alignment.
- Bearing-seat dimension.
- Bolt torque.
- Component clearance.
A dashboard could display:
- Current process value.
- X-bar chart status.
- R-chart status.
- Specification status.
- Recent defect count.
This creates a connection between statistical process control and operational decision-making.
Example: live dashboard for a mechanical assembly line
Consider an assembly line producing industrial pump units.
The dashboard displays:
- 96% first-pass acceptance.
- 2.8% rejection rate.
- 1.2% rework rate.
- 98% inspection completion.
- Two open dimensional non-conformances.
- One recurring alignment defect.
- Current assembly quality status: Amber.
The dashboard identifies that alignment defects have increased during the current shift.
The supervisor can immediately review:
- Assembly fixture condition.
- Alignment procedure.
- Component identification.
- Operator instructions.
- Inspection measurements.
- Recent maintenance activity.
The problem can be addressed before the entire production batch is completed.
Example: dashboard identifying a recurring defect
A production dashboard records defect categories for a mechanical assembly line.
Over several shifts, the data shows:
- Alignment defects: 38%.
- Torque deviations: 26%.
- Surface damage: 18%.
- Missing components: 10%.
- Other defects: 8%.
The dashboard highlights alignment and torque issues as the dominant categories.
The QA/QC engineer can then prioritise:
- Fixture verification.
- Torque-tool calibration.
- Assembly method review.
- Operator guidance.
- Additional targeted inspection.
The dashboard therefore becomes an improvement tool rather than simply a reporting tool.
Establishing escalation rules
A dashboard should define what happens when performance exceeds a threshold.
For example:
| Condition | Dashboard status | Immediate response |
|---|---|---|
| KPI within target | Green | Continue monitoring |
| KPI approaching threshold | Amber | Supervisor review |
| KPI exceeds intervention threshold | Red | Investigation and containment |
| Critical defect detected | Red | Immediate quality escalation |
| Recurring defect confirmed | Red/Amber | Root-cause investigation |
| Data unavailable | System alert | Restore data flow |
The actual thresholds should be established according to organisational requirements, product risk and process characteristics.
Immediate feedback must lead to controlled action
The objective of a live dashboard is not to encourage uncontrolled reactions.
Suppose an assembly operator sees that the latest dimensional measurement is slightly different from previous values. The operator should not automatically adjust the machine.
Instead, the defined process should determine:
- Whether the result is within specification.
- Whether it represents a control-chart signal.
- Whether the measurement should be verified.
- Whether the process requires investigation.
- Who is authorised to make adjustments.
This prevents over-adjustment and maintains process discipline.
Creating an effective production-floor feedback loop
A strong feedback loop can be structured as:
- Perform assembly activity.
- Conduct defined inspection.
- Record result.
- Validate data.
- Update dashboard.
- Compare with KPI and control limits.
- Identify abnormal condition.
- Notify responsible personnel.
- Contain affected product where required.
- Investigate cause.
- Implement authorised action.
- Verify effectiveness.
- Continue monitoring.
- Close the issue when evidence confirms control.
Integrating operators into the dashboard system
Production personnel should understand what the dashboard means and how they should respond.
Training should cover:
- Meaning of each KPI.
- Status categories.
- Defect classification.
- Escalation rules.
- Data-entry requirements.
- Traceability requirements.
- When to stop or pause a process.
- Who to contact.
- How corrective actions are recorded.
The dashboard should support operators rather than create additional administrative burden.
Preventing dashboard overload
A common implementation problem is displaying too much information.
A production-floor screen containing dozens of graphs, tables and technical indicators may appear sophisticated but become difficult to use.
A better approach is to prioritise:
- Critical quality indicators.
- Current status.
- Short-term trend.
- Major defect categories.
- Required actions.
Detailed technical analysis can remain available within the underlying quality system for QA/QC engineers and management.
Managing dashboard access and security
Where a digital dashboard is used, access should be controlled according to role.
Possible roles include:
- Operator.
- Supervisor.
- QA/QC inspector.
- Quality engineer.
- Production manager.
- System administrator.
Users may have different permissions for:
- Viewing information.
- Entering inspection results.
- Editing records.
- Approving corrections.
- Changing KPI definitions.
- Closing actions.
This supports data integrity and reduces the risk of unauthorised changes.
Traceability and auditability
Every quality result should ideally be traceable to the relevant:
- Component.
- Batch.
- Work order.
- Assembly station.
- Inspection activity.
- Inspector.
- Date and time.
- Measurement equipment where applicable.
Traceability becomes particularly important when a defect is discovered after several production stages.
The organisation should be able to determine:
- Which components were affected.
- Which production period was involved.
- Which inspection results were recorded.
- Which actions were taken.
- Whether similar components require review.
Dashboard implementation process
A structured implementation process can include:
- Define the purpose of the dashboard.
- Identify critical assembly quality requirements.
- Select relevant KPIs.
- Define data sources.
- Establish data ownership.
- Define update frequency.
- Establish quality thresholds.
- Design the dashboard layout.
- Establish escalation rules.
- Configure data connections.
- Validate calculations.
- Test the dashboard against known records.
- Train users.
- Pilot the system.
- Review usability.
- Correct data or display problems.
- Launch the production-floor system.
- Monitor performance.
- Audit data integrity.
- Review and improve the dashboard periodically.
Practical benefits of a live quality dashboard
A properly implemented dashboard can provide:
- Faster visibility of quality problems.
- Earlier defect detection.
- Improved communication between QA/QC and assembly.
- Reduced information delay.
- Better production-floor awareness.
- Improved traceability.
- Faster escalation.
- More effective containment.
- Reduced defect recurrence.
- Better resource allocation.
- Improved accountability.
- More effective continual improvement.
- Stronger evidence-based decision-making.
Common implementation failures
Displaying too many KPIs
Excessive information can obscure the indicators that actually require attention.
Using unreliable data
A visually impressive dashboard is ineffective if its source data is incomplete or inaccurate.
Failing to define ownership
If no one is responsible for updating and reviewing the information, the system can quickly become outdated.
Treating dashboard alerts as automatic instructions
A statistical or KPI signal should initiate an appropriate review rather than encourage uncontrolled adjustments.
Ignoring data latency
Information that arrives after the relevant production decision may have limited operational value.
Focusing on appearance rather than usability
The dashboard should support rapid understanding rather than simply look technically sophisticated.
Failing to connect alerts with actions
Every important threshold should have a defined response pathway.
Measuring dashboard effectiveness
The dashboard itself should be evaluated using measurable indicators.
Possible measures include:
- Time from defect detection to notification.
- Time from notification to containment.
- Percentage of dashboard data updated within the defined period.
- Number of unresolved data-quality issues.
- Reduction in repeated defects.
- Reduction in quality escapes.
- Improvement in first-pass acceptance.
- Reduction in avoidable rework.
- User adoption rate.
- Corrective-action response time.
This ensures that the dashboard becomes part of continual improvement rather than a static visual display.
Conclusion
A live quality dashboard or tracking matrix provides a practical mechanism for bringing quality information directly to the mechanical assembly environment. By displaying relevant KPIs, rejection rates, defect trends, inspection results, rework information and quality status in a clear and timely format, the system enables production and QA/QC personnel to recognise developing problems earlier and respond through defined quality-control processes. Its effectiveness depends on reliable data, clear KPI definitions, appropriate update frequency, traceability, role-based responsibilities and well-established escalation rules.
The most valuable production-floor dashboard is therefore not necessarily the most complex one. It is the system that presents accurate and actionable information at the right time, in a format that assembly teams can understand and use. When integrated with control charts, inspection records, defect analysis and corrective-action workflows, live quality monitoring can strengthen process control, reduce information delays, prevent recurring defects and support continual improvement. For mechanical engineering organisations, this creates a more responsive QA/QC environment in which quality performance becomes visible, measurable and actively managed at the point where production decisions are made.
4 Review established performance metrics periodically to ensure they remain aligned with changing client specifications and international engineering standards
Performance metrics are only valuable when they remain relevant to the requirements they are intended to measure. In mechanical engineering, manufacturing and QA/QC environments, client specifications, contractual requirements, engineering standards, inspection criteria, production technologies and organisational quality objectives can change over time. A KPI or performance metric that was appropriate when it was introduced may become incomplete, misleading or unsuitable after a design revision, specification change, new customer requirement, updated standard, process modification or change in product risk profile. Periodic review is therefore essential to ensure that quality performance measurement continues to reflect current technical, contractual and operational expectations.
For a professional mechanical inspection and QA/QC function, periodic KPI review should be treated as a controlled engineering activity rather than an informal management exercise. The review should examine whether each metric remains technically valid, whether its calculation method remains appropriate, whether its target remains realistic, whether the underlying data remains reliable and whether the metric continues to support current client and regulatory expectations. It should also confirm that performance indicators are aligned with applicable international engineering standards and the latest approved project or client requirements. This approach helps prevent outdated metrics from creating a false impression of quality performance and supports continual improvement across mechanical manufacturing, inspection, fabrication and assembly operations.
Understanding performance metric alignment
Performance metric alignment means ensuring that the indicators used by an organisation continue to measure the characteristics that matter to current engineering, quality and customer requirements.
A metric is properly aligned when:
- Its purpose reflects current quality objectives.
- Its calculation method remains technically appropriate.
- Its data source is reliable.
- Its target reflects current expectations.
- Its scope matches current production activities.
- Its acceptance criteria correspond to current specifications.
- Its reporting frequency is appropriate.
- Its interpretation supports sound engineering decisions.
For example, an inspection department may have historically used a dimensional rejection-rate KPI based on a particular component specification. If the client later changes the dimensional tolerance, continuing to compare current results against the previous target may produce misleading conclusions.
The metric itself may still be useful, but its calculation, target, baseline or interpretation may need to be revised.
Why periodic KPI review is necessary
Mechanical engineering environments are dynamic. Changes may occur in:
- Product design.
- Drawing revisions.
- Client specifications.
- Contract requirements.
- Manufacturing processes.
- Inspection technology.
- Measurement equipment.
- Materials.
- Supplier arrangements.
- Production volumes.
- Risk profiles.
- Applicable standards.
- Organisational quality objectives.
A KPI framework that does not respond to such changes can gradually become disconnected from actual performance requirements.
Periodic review helps determine whether:
- Existing KPIs remain relevant.
- Targets remain appropriate.
- New KPIs are required.
- Existing KPIs should be retired.
- Data definitions need modification.
- Inspection frequency needs adjustment.
- Reporting thresholds need revision.
- Client-specific requirements have been incorporated.
- International engineering requirements have been considered.
Related definitions and key concepts
| Term | Definition | Mechanical QA/QC application |
|---|---|---|
| Performance metric | A measurable value used to evaluate process or operational performance | Inspection cycle time |
| KPI | A selected performance metric linked to a significant organisational objective | Rejection rate against target |
| Metric alignment | Maintaining consistency between a metric and current requirements | Updating inspection KPIs after a drawing revision |
| Client specification | A defined technical or quality requirement issued by the customer | Dimensional or testing requirement |
| Engineering standard | A recognised technical framework used to establish engineering requirements or practices | Applicable ASME, API or ISO requirements |
| Baseline | Reference performance used for comparison | Historical rejection performance |
| Target | Desired level of performance | Maximum acceptable rejection rate |
| Threshold | Defined level that triggers review or action | Escalation limit for quality failures |
| Specification revision | An approved change to a technical requirement | Revised component tolerance |
| KPI owner | Person or function responsible for maintaining a KPI | QA/QC manager |
| Review cycle | Defined interval for evaluating continued KPI suitability | Quarterly KPI review |
| Change control | Controlled method for evaluating and implementing changes | Updating metrics after specification revision |
| Traceability | Ability to link a metric to its source records and requirements | Linking rejection data to inspection reports |
| Continual improvement | Ongoing effort to improve process performance | Refining quality metrics after trend analysis |
Difference between client requirements and engineering standards
Client specifications and engineering standards are related but should not automatically be treated as interchangeable.
Client requirements may define:
- Specific product characteristics.
- Contractual acceptance criteria.
- Inspection frequencies.
- Reporting requirements.
- Documentation requirements.
- Additional testing requirements.
- Specific tolerances.
International engineering standards may provide:
- Technical principles.
- Design requirements.
- Manufacturing requirements.
- Inspection practices.
- Testing approaches.
- Quality-control provisions.
A KPI review should therefore determine which requirements apply to the specific project, product, process or contract.
Establishing a controlled KPI review process

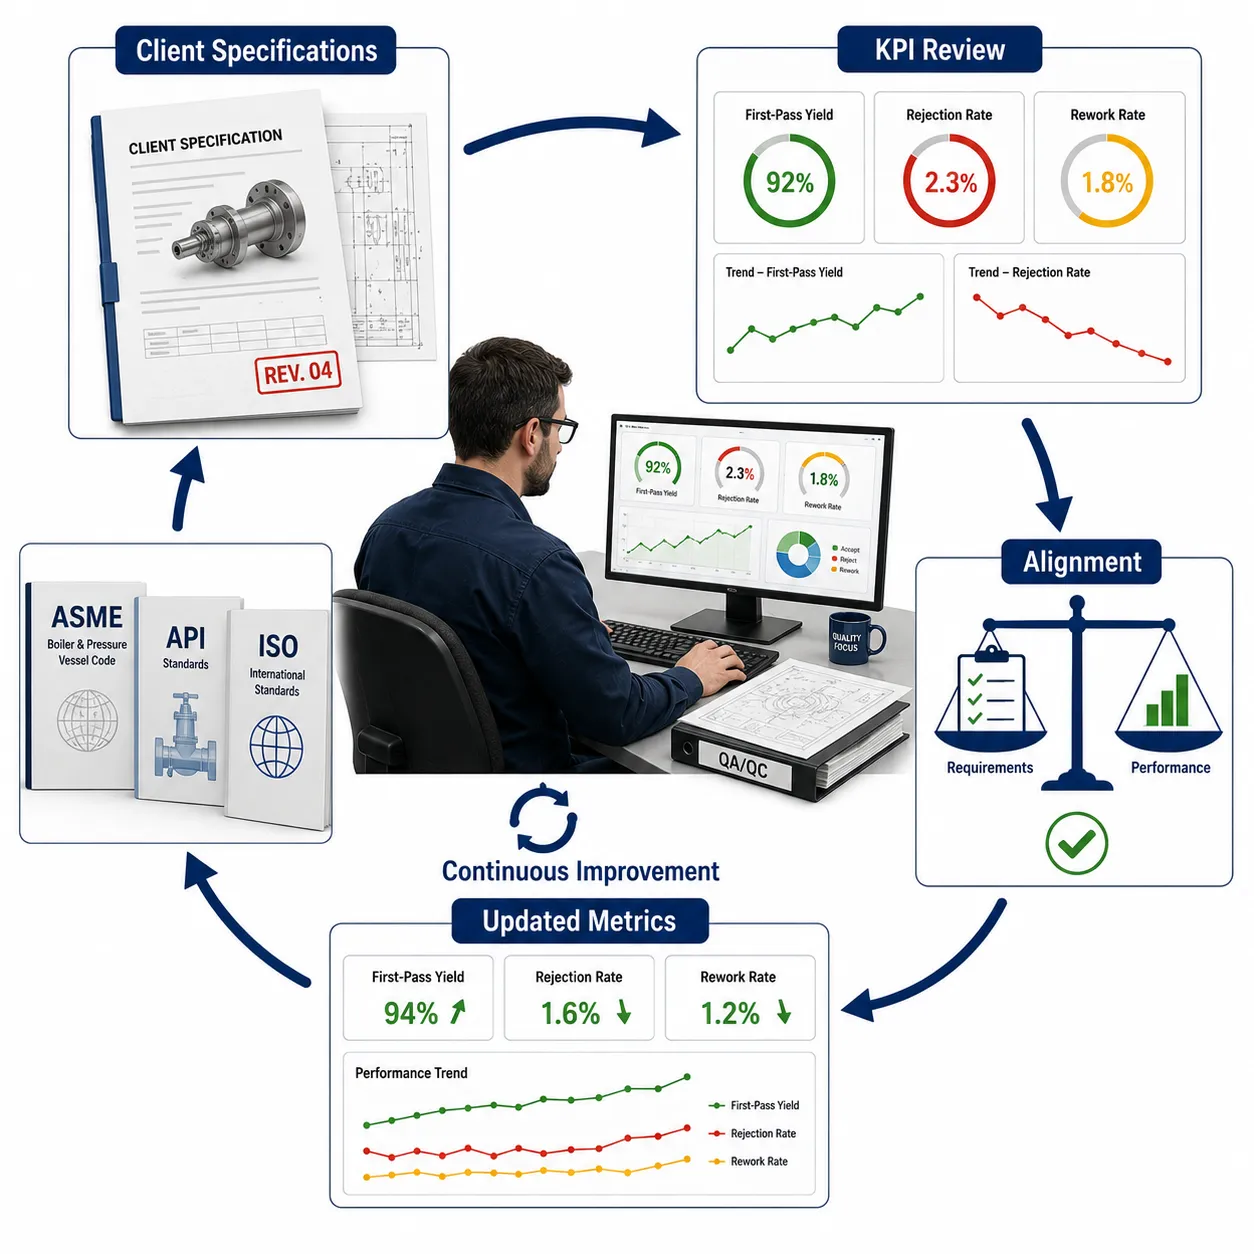
A periodic KPI review should follow a defined procedure rather than relying on informal discussion.
A practical process is:
- Identify the current KPI set.
- Confirm the current approved client requirements.
- Review applicable engineering standards.
- Check current drawings and specifications.
- Identify process or equipment changes.
- Review recent quality performance.
- Evaluate KPI relevance.
- Review KPI calculation methods.
- Verify data sources.
- Review targets and thresholds.
- Compare current and historical performance.
- Identify gaps.
- Propose KPI changes.
- Obtain appropriate technical approval.
- Implement approved revisions.
- Communicate changes to affected personnel.
- Update reporting tools.
- Monitor the revised metrics.
- Record the review.
- Schedule the next review.
Reviewing current client specifications
The first part of an alignment review is confirming that the organisation is working from the latest approved client information.
Relevant documents may include:
- Approved engineering drawings.
- Technical specifications.
- Inspection and test plans.
- Quality plans.
- Purchase specifications.
- Contract requirements.
- Approved deviations.
- Concession records.
- Engineering change notices.
- Revision-controlled procedures.
The QA/QC team should confirm that obsolete requirements have not remained embedded in KPI definitions or reporting templates.
Importance of document revision control
A KPI can become invalid if it continues to measure performance against an obsolete document revision.
For example, suppose a client changes the allowable dimensional tolerance for a machined component.
The old KPI may classify components using the previous tolerance.
If the inspection system is not updated, management may receive apparently accurate statistics that are actually based on obsolete requirements.
The KPI review should therefore confirm:
- Current document revision.
- Effective date.
- Approved status.
- Relevant acceptance criteria.
- Applicable measurement method.
- Applicable inspection frequency.
Reviewing international engineering standards
International engineering standards can change through revisions, amendments or new editions. Organisations should establish a controlled method for determining which editions or requirements apply to their activities.
Depending on the mechanical engineering context, relevant frameworks may include recognised standards and codes from organisations such as:
- ASME.
- API.
- ISO.
- ASTM.
- EN.
- BS.
- Other contractually or technically applicable standards.
The exact standard and edition applicable to a particular activity should always be verified against the contract, project requirements, organisational procedures and approved engineering documentation.
Why standard revisions matter to KPIs
A revised standard may alter:
- Inspection methodology.
- Acceptance criteria.
- Testing frequency.
- Sampling requirements.
- Documentation expectations.
- Qualification requirements.
- Measurement practices.
If the performance metric does not reflect these changes, the organisation may continue reporting a historical measure that no longer represents current compliance or quality performance.
Reviewing KPI definitions
Every KPI should have a controlled definition.
A KPI definition should normally state:
- KPI name.
- Purpose.
- Formula.
- Unit of measurement.
- Data source.
- Reporting period.
- Responsible owner.
- Target.
- Threshold.
- Escalation requirement.
- Scope.
- Exclusions.
- Review frequency.
For example:
KPI: Mechanical inspection rejection rate
Formula:
Rejection Rate=Total inspected unitsRejected units×100
Scope:
Defined mechanical assembly population.
Data source:
Approved inspection records.
Review:
Monthly, with immediate escalation for defined critical defects.
This level of definition helps ensure consistent interpretation.
Reviewing KPI formulas
A KPI formula that was appropriate previously may become unsuitable when the production process changes.
For example, a production facility may change from low-volume custom manufacturing to higher-volume automated production.
An indicator based purely on the number of inspections completed per inspector-hour may no longer represent meaningful inspection efficiency because automated inspection equipment has changed the relationship between labour and inspection output.
The formula should therefore be reviewed whenever:
- Production technology changes.
- Inspection methods change.
- Data structures change.
- Product mix changes.
- Quality requirements change.
- Resource models change.
Reviewing KPI targets
Targets should not remain unchanged indefinitely.
A target may need revision because:
- Client requirements have become stricter.
- Process capability has improved.
- Production technology has changed.
- Product risk has increased.
- Quality objectives have changed.
- Historical performance has changed significantly.
- A new contract imposes different requirements.
For example, a previous rejection target of 3% may have been appropriate for a general component population. A new high-precision component with significantly tighter requirements may require a different performance objective.
Reviewing thresholds and escalation limits
Targets and escalation thresholds serve different purposes.
A target describes desired performance.
A threshold identifies when additional review or action is required.
For example:
- Target rejection rate: below 2%.
- Review threshold: 2.5%.
- Immediate escalation threshold: 4%.
These values should be established using relevant quality evidence rather than arbitrary numbers.
Reviewing KPI baselines
A historical baseline can become misleading after major process changes.
For example, a machining line may have:
- New CNC equipment.
- New tooling.
- New material.
- Revised tolerance.
- Automated inspection.
Comparing the new process directly against a five-year-old baseline may not provide a fair assessment.
The organisation may need to establish a new baseline after sufficient validated production data has been collected.
Practical example: revised client tolerance
A manufacturer produces precision mechanical housings.
The original client specification allows a dimensional tolerance of ±0.10 mm.
The client later revises the requirement to ±0.05 mm.
The existing KPI reports a dimensional rejection rate of 1.8%.
However, when the revised tolerance is applied, the rejection rate increases to 4.1%.
The organisation should not interpret this simply as a sudden manufacturing deterioration.
The correct analysis should consider:
- The specification changed.
- The KPI definition was based on the old requirement.
- The baseline is no longer directly comparable.
- The manufacturing process may need capability review.
- The KPI target may need revision.
- Production controls may require improvement.
The KPI review therefore provides a mechanism for connecting the new client requirement with process performance.
Practical example: updated inspection standard
Suppose an organisation changes its applicable inspection procedure following adoption of a newer edition of an engineering standard.
The updated requirements increase inspection coverage for a critical mechanical characteristic.
The inspection team subsequently records more defects.
A simplistic KPI might interpret this as declining quality.
A more appropriate review would recognise that:
- Inspection coverage increased.
- Detection sensitivity changed.
- More defects are now being identified.
- Historical KPI comparisons require qualification.
The organisation should therefore distinguish between changes in actual product quality and changes in defect-detection effectiveness.
Reviewing metrics after engineering changes
Engineering changes should trigger KPI review when they affect:
- Product design.
- Materials.
- Manufacturing process.
- Equipment.
- Inspection method.
- Tolerances.
- Testing requirements.
- Assembly sequence.
- Supplier source.
A change-control process should therefore include a question such as:
“Does this change affect existing quality KPIs, targets, data sources or acceptance criteria?”
If the answer is yes, the KPI framework should be reviewed before the change becomes fully operational.
Integrating KPI review with management of change
A robust management-of-change process can include:
- Identification of the proposed change.
- Technical evaluation.
- Quality impact assessment.
- Client requirement review.
- Applicable standard review.
- KPI impact assessment.
- Approval.
- Implementation.
- Verification.
- Post-change performance monitoring.
This prevents performance measurement from becoming disconnected from engineering change management.
Reviewing data sources
A KPI may appear appropriate but still produce unreliable results if its data source is weak.
The review should assess:
- Data completeness.
- Data accuracy.
- Measurement consistency.
- Record traceability.
- Data-entry controls.
- System integration.
- Time stamps.
- Revision status.
- Duplicate records.
- Missing records.
If the data source has changed, the KPI calculation should be revalidated.
Reviewing measurement methods
Changes in measurement equipment or techniques can affect KPI comparability.
For example:
An organisation historically uses manual dimensional inspection.
It later introduces automated optical measurement.
The new system may identify smaller deviations or measure characteristics differently.
The KPI review should therefore assess whether the old and new datasets remain directly comparable.
Reviewing KPI scope
KPI scope defines what population the metric represents.
Scope may be based on:
- Product type.
- Production line.
- Machine.
- Customer.
- Contract.
- Component category.
- Inspection stage.
- Supplier.
- Production shift.
If the scope changes without documentation, performance comparisons may become misleading.
Reviewing client-specific requirements
Different clients may require different:
- Acceptance criteria.
- Inspection points.
- Reporting formats.
- Testing frequencies.
- Traceability requirements.
- Quality documentation.
- Escalation processes.
A single organisation-wide KPI may therefore need controlled segmentation.
For example, a general rejection KPI may be supplemented with client-specific acceptance indicators.
Building a KPI alignment matrix
A KPI alignment matrix can help QA/QC teams establish traceability between performance indicators and requirements.
| KPI | Current requirement | Relevant standard/framework | Data source | Target | Review action |
|---|---|---|---|---|---|
| Rejection rate | Current client acceptance criteria | Applicable quality requirements | Inspection records | Defined percentage | Investigate rising trend |
| First-pass acceptance | Current production specification | Applicable process controls | Inspection database | Defined percentage | Review recurring defects |
| Inspection completion | Approved inspection plan | Applicable project requirements | Inspection schedule | Defined completion level | Address missed inspections |
| Dimensional conformity | Current drawing revision | Applicable engineering standard | Measurement records | Defined conformity level | Review process capability |
| Quality escape rate | Contractual quality expectations | Applicable QA requirements | NCR and customer records | Defined threshold | Escalate critical escapes |
| Corrective-action closure | Current quality procedure | Applicable management system | CAPA/NCR records | Defined closure period | Escalate overdue actions |
Reviewing KPIs against risk
Not every KPI deserves equal attention.
Critical characteristics should normally receive stronger monitoring where failure could affect:
- Structural integrity.
- Mechanical reliability.
- Product functionality.
- Safety.
- Regulatory compliance.
- Customer acceptance.
Risk-based KPI review helps ensure that important technical characteristics are not hidden by general production indicators.
Reviewing performance metrics after recurring defects
Recurring defects are a strong signal that the KPI framework may require refinement.
For example, if repeated alignment defects occur but the current KPI only measures total rejection, the organisation may need to introduce:
- Alignment defect rate.
- Alignment defect recurrence.
- Defects by assembly station.
- Defects by component batch.
- Corrective-action effectiveness.
This provides greater diagnostic value.
Monitoring leading and lagging indicators
A mature KPI system should contain both leading and lagging indicators.
Lagging indicators show what has already happened.
Examples include:
- Rejection rate.
- Rework rate.
- Customer complaints.
- Quality escapes.
Leading indicators provide earlier information about potential problems.
Examples may include:
- Inspection completion.
- Calibration status.
- Preventive maintenance completion.
- Control-chart warnings.
- Corrective-action ageing.
- Training completion.
- Measurement-system verification.
Combining both types creates stronger quality visibility.
Periodic review frequency
There should be a defined KPI review schedule.
For example:
- Daily: critical production quality status.
- Weekly: operational quality trends.
- Monthly: KPI performance review.
- Quarterly: detailed KPI alignment review.
- Annually: comprehensive framework review.
- Immediately: following significant client, specification, standard or process changes.
The exact frequency should reflect organisational risk and contractual requirements.
Triggers for an immediate KPI review
A review should occur outside the normal schedule when:
- A client specification changes.
- An engineering drawing is revised.
- A new applicable standard is introduced.
- An existing standard is revised.
- A major process change occurs.
- New inspection equipment is introduced.
- A serious non-conformance occurs.
- A significant quality escape occurs.
- A recurring defect emerges.
- Production technology changes.
- A new customer or contract introduces different requirements.
Practical KPI review procedure
A professional review can follow this sequence:
- Retrieve the approved current KPI register.
- Confirm each KPI’s purpose.
- Review current client specifications.
- Review applicable engineering standards.
- Check current drawing and process revisions.
- Identify changes since the previous review.
- Assess each KPI for continued relevance.
- Verify KPI formulas.
- Verify data sources.
- Review target values.
- Review escalation thresholds.
- Compare recent performance trends.
- Assess whether baseline data remains valid.
- Identify missing performance indicators.
- Identify obsolete indicators.
- Evaluate risk implications.
- Propose changes.
- Obtain technical and quality approval.
- Update controlled documents and dashboards.
- Communicate changes.
- Implement revised KPIs.
- Monitor initial results.
- Record the review.
- Establish the next review date.
Communicating revised performance metrics
Changing a KPI without communicating the change can create confusion.
Affected personnel may include:
- QA/QC inspectors.
- Quality engineers.
- Production supervisors.
- Assembly teams.
- Engineering personnel.
- Maintenance teams.
- Project managers.
- Client representatives where required.
Communication should clarify:
- What changed.
- Why it changed.
- When the change takes effect.
- How the KPI is calculated.
- What the new target means.
- What action is required when thresholds are exceeded.
Controlling historical comparisons
When a KPI definition changes, historical data should not automatically be discarded.
Instead, the organisation should determine whether historical values can be:
- Recalculated using the new definition.
- Segmented into old and new periods.
- Used as contextual information only.
- Retained as historical records.
This preserves traceability while preventing misleading comparisons.
Avoiding KPI drift
KPI drift occurs when an indicator gradually loses its connection with the objective it was originally intended to measure.
This may happen when:
- Processes change.
- Responsibilities change.
- Client requirements evolve.
- Standards change.
- Data systems change.
- Production technology changes.
Periodic review prevents this gradual loss of relevance.
Benefits of periodic KPI alignment
Regular performance-metric review provides:
- Continued alignment with client expectations.
- Better consistency with applicable standards.
- More accurate quality reporting.
- Improved management decision-making.
- Stronger technical traceability.
- Earlier identification of performance gaps.
- Better response to engineering changes.
- Improved risk management.
- More meaningful benchmarking.
- Reduced reliance on obsolete targets.
- Improved continual improvement.
- Stronger customer confidence.
Common mistakes in performance-metric review
Keeping old KPIs indefinitely
A metric should not remain in use simply because it has always been reported.
Updating targets without updating definitions
Changing a target without confirming the calculation method can create inconsistency.
Ignoring client specification revisions
A KPI based on an obsolete specification can produce misleading quality information.
Treating every standard revision as automatically applicable
The organisation should determine which requirements actually apply to its products, processes and contracts.
Comparing incomparable datasets
Changes in measurement methods, product mix or specification requirements can invalidate direct comparisons.
Focusing only on lagging indicators
Historical defect data is valuable, but leading indicators can provide earlier warning.
Failing to document KPI changes
Undocumented changes undermine traceability and confidence in performance reports.
Integrating KPI review with continual improvement
Performance metrics should be part of a continual improvement cycle:
Plan → Measure → Analyse → Review → Improve → Re-measure.
For example:
- A rejection KPI identifies deterioration.
- Trend analysis identifies a recurring dimensional problem.
- Engineering investigation identifies tool wear.
- A process intervention is implemented.
- KPI performance improves.
- The revised process is monitored.
- The KPI framework is reviewed to confirm continued relevance.
This creates a feedback loop between measurement and engineering improvement.
Conclusion
Periodic review of established performance metrics is essential for maintaining an effective mechanical engineering QA/QC system. Client specifications, engineering standards, product requirements, manufacturing technologies and inspection methods can change, meaning that KPIs must be regularly evaluated to ensure that they continue to measure the right characteristics against the right expectations. A controlled review should examine KPI definitions, formulas, targets, thresholds, data sources, baselines, scope and reporting frequency while confirming alignment with current approved client and engineering requirements.
A mature organisation should treat KPI review as part of continual improvement and change management rather than as an administrative exercise. When performance metrics are systematically compared with current specifications, applicable international engineering standards, process risks and recent quality trends, QA/QC teams can identify obsolete measures, introduce more meaningful indicators and maintain reliable performance visibility. This strengthens traceability, supports evidence-based engineering decisions and ensures that quality reporting remains relevant to current mechanical manufacturing and inspection conditions.