
Lesson 5: Analyse and optimise QA/QC processes to improve efficiency, safety, and reliability.
Analysing and optimising QA/QC processes is essential for improving the efficiency, safety, reliability, and overall performance of mechanical engineering operations. Lesson 5: Analyse and Optimise QA/QC Processes to Improve Efficiency, Safety, and Reliability focuses on evaluating existing quality processes to determine where weaknesses, inefficiencies, risks, and recurring failures may be affecting project performance. Effective QA/QC optimisation involves more than increasing inspections; it requires systematic analysis of process data, non-conformance trends, rework, inspection results, testing performance, equipment reliability, documentation, resource utilisation, and operational risks. By understanding how these factors interact, mechanical engineering teams can develop targeted improvements that strengthen quality control while reducing unnecessary delays, waste, and repeat work.
A robust QA/QC optimisation process uses objective evidence and performance indicators to identify opportunities for improvement across mechanical manufacturing, fabrication, assembly, installation, inspection, and testing activities. Relevant information may include first-pass acceptance rates, rework levels, NCR frequency, inspection turnaround time, material defects, testing failures, supplier performance, calibration issues, equipment downtime, and recurring process deviations. Analytical techniques such as trend analysis, process mapping, Pareto analysis, root cause analysis, risk assessment, and performance comparison can help identify whether problems are isolated events or symptoms of wider systemic weaknesses. Optimisation should also consider the relationship between quality, cost, programme, safety, and reliability so that improvements in one area do not unintentionally create new risks elsewhere.
For advanced mechanical QA/QC professionals, process optimisation requires professional judgement, structured decision-making, and continual evaluation. An effective improvement should be technically appropriate, measurable, realistic, and capable of being sustained through controlled procedures and competent personnel. Safety-critical and quality-critical activities should receive appropriate priority, while unnecessary duplication, excessive process delays, avoidable rework, and inefficient inspection workflows should be identified and addressed. This lesson develops an understanding of how QA/QC processes can be analysed, evaluated, redesigned, and monitored to achieve more efficient operations while maintaining required quality and safety controls. Through evidence-based optimisation, organisations can strengthen mechanical process reliability, improve resource utilisation, reduce recurring defects, support compliance, and establish a more resilient QA/QC management system.
1: Evaluate How Changing Specific Variables in Mechanical Fabrication Processes Impacts Overall Plant Safety and Equipment Reliability
Mechanical fabrication processes are controlled systems in which changes to one variable can influence product quality, equipment condition, operational safety, maintenance requirements, and long-term plant reliability. In a modern mechanical engineering environment, fabrication activities such as cutting, forming, machining, welding, heat treatment, grinding, assembly, bolting, alignment, inspection, and testing must operate within defined technical and quality controls. A change that appears minor at process level can create significant consequences elsewhere in the plant. For example, changing welding heat input may affect distortion, residual stress, joint properties, dimensional accuracy, and subsequent equipment performance. Similarly, changing machining parameters can influence surface finish, dimensional tolerance, tool wear, vibration, component fatigue behaviour, and ultimately equipment reliability.
Evaluating these relationships is an important responsibility within advanced QA/QC management. The objective is not simply to determine whether a fabrication variable has changed, but to understand how the change affects the complete engineering system. A professional evaluation should consider the original process condition, the proposed change, the technical reason for the change, applicable acceptance requirements, foreseeable hazards, equipment sensitivity, failure modes, inspection requirements, and evidence generated after implementation. This approach supports evidence-based decision-making and prevents uncontrolled process modifications from becoming hidden sources of mechanical failure or operational risk.
For mechanical engineering projects, process variables may include welding temperature, heat input, welding speed, machining speed, feed rate, cutting conditions, forming force, dimensional tolerances, bolt torque, alignment, material condition, heat-treatment parameters, surface preparation, curing conditions, inspection frequency, testing parameters, and equipment settings. Each variable should be evaluated in relation to its intended function and acceptable operating range. A Level 6 QA/QC professional should therefore be able to distinguish between a controlled process optimisation and an uncontrolled process deviation, assess the consequences of changing variables, and establish appropriate verification before the modified process is accepted for routine production.
Understanding Process Variables in Mechanical Fabrication
A process variable is a measurable or controllable factor that can influence the outcome of a mechanical fabrication activity.
Examples include:
- Welding current.
- Welding voltage.
- Welding travel speed.
- Heat input.
- Preheat temperature.
- Interpass temperature.
- Machining speed.
- Feed rate.
- Cutting depth.
- Forming force.
- Material temperature.
- Heat-treatment temperature.
- Holding time.
- Cooling rate.
- Bolt torque.
- Alignment tolerance.
- Surface roughness.
- Dimensional tolerance.
- Inspection frequency.
- Testing parameters.
Process variables should not be considered independently. They often interact with one another.
For example, welding current, voltage and travel speed collectively influence heat input. Changing one variable without considering the others can therefore alter the characteristics of the completed weld.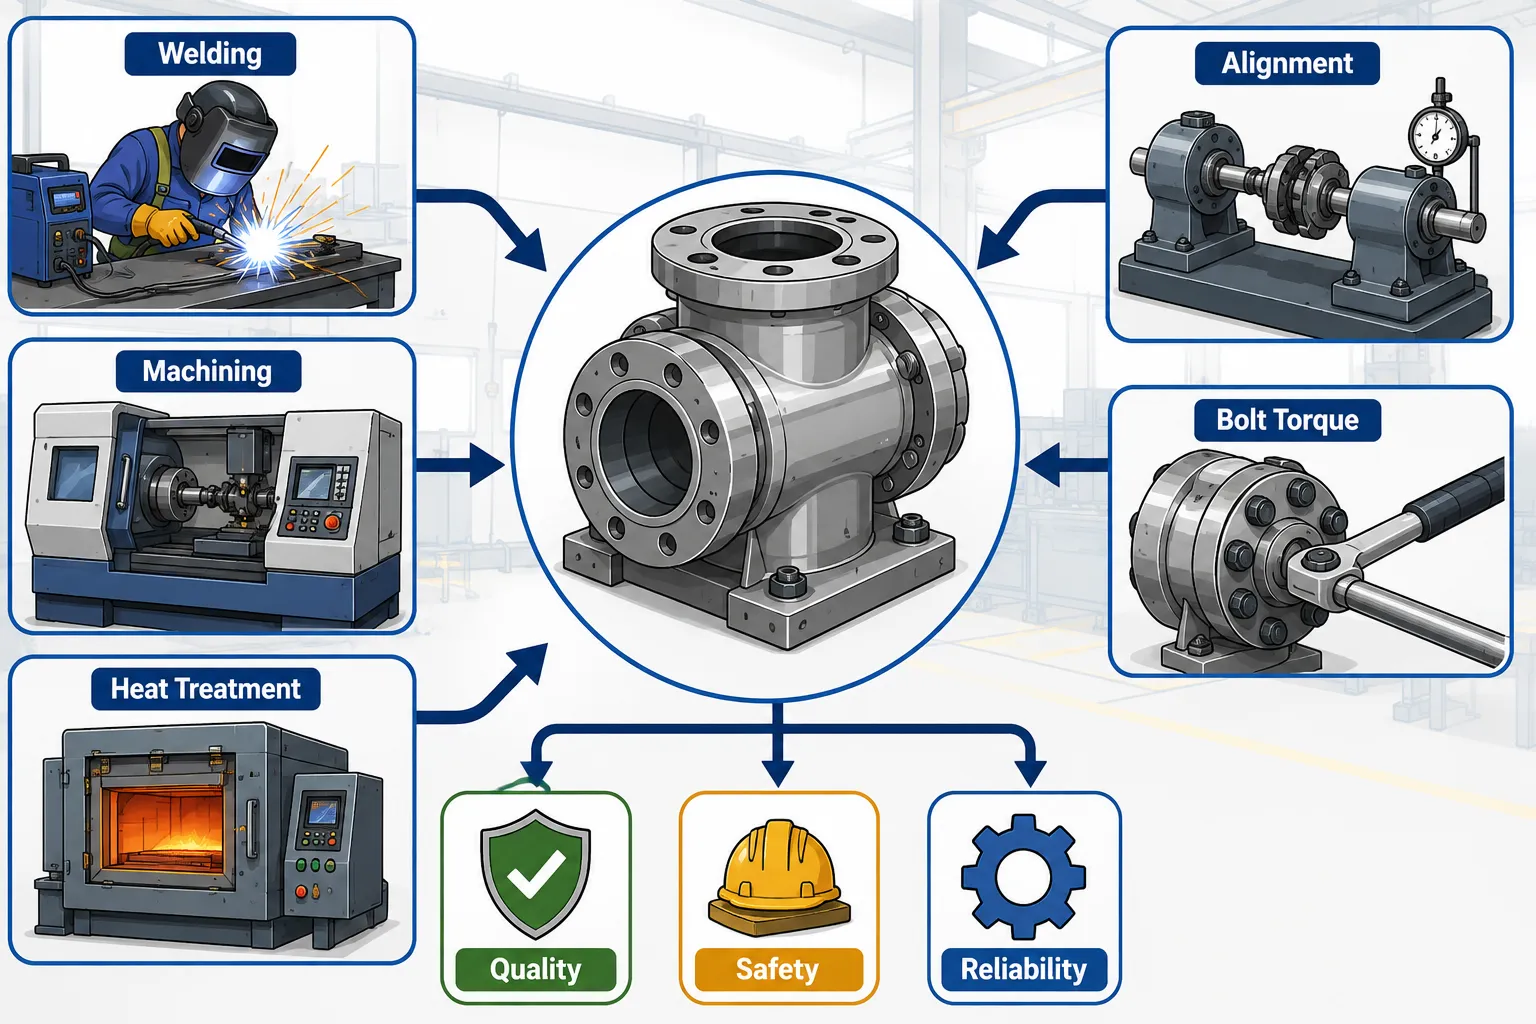
Key Definitions and Concepts
| Term | Definition | Mechanical QA/QC Application |
|---|---|---|
| Process Variable | A measurable factor influencing process output | Welding current, machining speed or bolt torque |
| Process Parameter | Defined setting or condition used to control an operation | Approved welding or machining settings |
| Process Control | Methods used to maintain a process within specified limits | Monitoring temperature and dimensional conditions |
| Plant Safety | Protection of personnel, equipment, processes and operations from unacceptable hazards | Preventing fabrication defects that could contribute to equipment failure |
| Equipment Reliability | Ability of equipment to perform its intended function consistently | Maintaining reliable pumps, vessels, rotating equipment or assemblies |
| Process Deviation | Departure from an approved or specified process condition | Welding outside approved parameters |
| Change Control | Formal process for evaluating and controlling proposed changes | Assessing a revised fabrication method before implementation |
| Failure Mode | Specific way in which a component or process may fail | Cracking, distortion, fatigue or leakage |
| Risk | Effect of uncertainty on intended outcomes | Potential consequence of process changes |
| Verification | Confirmation through objective evidence that requirements are fulfilled | Inspection or testing after a process modification |
| Validation | Demonstration that a process can consistently achieve intended results | Establishing that a revised fabrication method produces acceptable components |
| Reliability | Ability to perform required functions over a defined period | Long-term mechanical equipment performance |
| Residual Stress | Stress remaining in material after processing | Stress generated during welding or forming |
| Distortion | Unintended change in shape or dimensions | Weld-induced deformation affecting assembly |
| Tolerance | Permissible variation from a specified value | Dimensional limits for fabricated components |
Why Process Variables Matter to Plant Safety
Plant safety depends partly on the integrity of mechanical components and systems. Fabricated components may form part of:
- Pressure-containing equipment.
- Structural assemblies.
- Piping systems.
- Rotating machinery.
- Mechanical supports.
- Storage systems.
- Heat-transfer equipment.
- Process equipment.
- Lifting-related structures.
- Access and maintenance systems.
If fabrication variables are poorly controlled, defects may develop that are not immediately visible.
Potential consequences include:
- Cracking.
- Distortion.
- Leakage.
- Loss of structural integrity.
- Premature fatigue.
- Excessive vibration.
- Misalignment.
- Fastener failure.
- Reduced pressure resistance.
- Accelerated corrosion.
- Mechanical seizure.
- Unexpected equipment downtime.
The QA/QC function therefore has an important role in identifying how process changes can influence safety-critical characteristics.
Relationship Between Fabrication Quality and Equipment Reliability
Equipment reliability is influenced by the quality of its individual components and assemblies.
A simplified relationship can be represented as:
Process Control → Component Quality → Assembly Integrity → Equipment Performance → Plant Reliability
If process control deteriorates at the beginning of this chain, the effects may appear much later.
For example:
Poor machining → Incorrect fit → Misalignment → Vibration → Bearing deterioration → Equipment downtime
The original fabrication deviation may therefore occur long before the operational failure becomes visible.
Types of Variables That Require Evaluation
Welding Variables
Important variables may include:
- Current.
- Voltage.
- Travel speed.
- Heat input.
- Preheat.
- Interpass temperature.
- Consumable condition.
- Welding sequence.
- Joint preparation.
- Shielding conditions.
Machining Variables
These may include:
- Cutting speed.
- Feed rate.
- Depth of cut.
- Tool condition.
- Coolant condition.
- Workpiece temperature.
- Machine rigidity.
- Dimensional tolerance.
Forming Variables
Relevant factors may include:
- Forming force.
- Material temperature.
- Tool geometry.
- Forming speed.
- Bend radius.
- Number of forming operations.
Heat-Treatment Variables
These may include:
- Heating temperature.
- Heating rate.
- Holding time.
- Cooling rate.
- Cooling medium.
- Material condition.
Assembly Variables
These may include:
- Bolt torque.
- Fastening sequence.
- Alignment.
- Clearances.
- Fit.
- Lubrication.
- Component orientation.
Evaluating a Variable Change
A structured evaluation should begin by establishing the original process condition.
The QA/QC professional should determine:
- What is currently specified?
- Why is the current parameter used?
- What evidence supports the existing condition?
- What is being changed?
- Why is the change proposed?
- What component characteristics could be affected?
- What hazards could arise?
- What inspection or testing is required?
- What acceptance criteria apply?
This prevents a process change from being treated simply as an operational preference.
Process of Change Evaluation
Stage 1: Identify the Proposed Change
Clearly define the variable being changed.
For example:
- Increase welding travel speed.
- Reduce machining feed rate.
- Change bolt torque.
- Increase forming temperature.
- Modify heat-treatment duration.
Stage 2: Establish the Baseline
Record existing conditions and performance.
Baseline information may include:
- Defect rates.
- Rework.
- Dimensional conformity.
- Test results.
- Equipment performance.
- Maintenance history.
- Previous NCRs.
Stage 3: Identify Potential Effects
Determine which characteristics could change.
These may include:
- Strength.
- Hardness.
- Geometry.
- Surface finish.
- Residual stress.
- Distortion.
- Fatigue behaviour.
- Fit.
- Alignment.
- Leakage resistance.
Stage 4: Assess Safety and Reliability
Consider potential effects on:
- Personnel safety.
- Equipment integrity.
- Process containment.
- Operational reliability.
- Maintenance.
- Inspection.
- Future failure.
Stage 5: Define Controls
Establish:
- Acceptable ranges.
- Inspection requirements.
- Testing requirements.
- Monitoring arrangements.
- Approval requirements.
Stage 6: Verify the Modified Process
Collect objective evidence.
This may involve:
- Dimensional inspection.
- Mechanical testing.
- NDT.
- Functional testing.
- Performance monitoring.
- Equipment inspection.
Stage 7: Review Results
Compare results with the baseline and defined requirements.
Stage 8: Approve or Reject the Change
The change should only become part of routine production when the required evidence demonstrates acceptable performance.
Welding Heat Input as a Critical Variable
Welding provides an excellent example of how changing one variable can influence multiple outcomes.
Heat input can influence:
- Weld characteristics.
- Cooling behaviour.
- Distortion.
- Residual stress.
- Microstructural development.
- Mechanical properties.
- Heat-affected zone behaviour.
If welding speed increases significantly without appropriate control of other parameters, the resulting weld may behave differently from the qualified or approved process.
Conversely, excessive heat input may increase thermal effects and distortion.
The QA/QC professional should therefore evaluate changes against the applicable welding procedure and project requirements rather than treating heat input as an isolated production setting.
Welding Sequence and Distortion
Welding sequence can influence distortion.
An uncontrolled sequence may create:
- Uneven thermal expansion.
- Localised deformation.
- Misalignment.
- Excessive residual stress.
This can affect later assembly.
A component may technically contain acceptable welds but still fail dimensional requirements because distortion was not adequately controlled.
The relationship is therefore:
Welding Sequence → Thermal Distribution → Distortion → Dimensional Accuracy → Assembly Reliability
Welding Speed
Changing travel speed can influence heat input and weld formation.
Potential consequences may include:
- Changed penetration.
- Altered weld profile.
- Increased defect potential.
- Changed thermal effects.
- Increased rework.
Any change should therefore be assessed against the approved procedure and applicable acceptance requirements.
Machining Variables and Reliability
Machining parameters can have a direct relationship with equipment reliability.
For example:
Incorrect cutting conditions → Poor surface finish → Increased contact stress → Accelerated wear → Reduced component life
Important machining variables include:
- Cutting speed.
- Feed rate.
- Depth of cut.
- Tool condition.
- Coolant condition.
Surface Finish
Surface condition can influence:
- Friction.
- Wear.
- Sealing.
- Fatigue behaviour.
- Contact performance.
A component that meets basic dimensional requirements may still have unacceptable surface characteristics for its intended application.
QA/QC evaluation should therefore consider the complete set of specified characteristics.
Dimensional Tolerance
Changing dimensional tolerances may appear to improve manufacturing efficiency because wider tolerances can sometimes reduce production difficulty.
However, excessive tolerance changes may affect:
- Interchangeability.
- Fit.
- Alignment.
- Clearance.
- Load distribution.
- Seal performance.
- Equipment reliability.
A tolerance should therefore not be changed solely for production convenience.
Alignment as a Reliability Variable
Alignment is particularly important in mechanical assemblies.
Poor alignment can contribute to:
- Vibration.
- Uneven loading.
- Coupling stress.
- Bearing wear.
- Seal problems.
- Premature equipment failure.
For rotating equipment, an apparently small fabrication or assembly deviation can therefore produce significant operational consequences.
Bolt Torque as a Process Variable
Fastener torque affects joint behaviour.
Insufficient torque may contribute to:
- Joint movement.
- Leakage.
- Loosening.
- Reduced clamping force.
Excessive torque may contribute to:
- Fastener damage.
- Thread damage.
- Distortion.
- Reduced joint reliability.
The correct torque requirement should therefore be established from the applicable engineering requirements rather than determined informally.
Heat Treatment Variables
Heat treatment can influence material characteristics.
Variables may include:
- Temperature.
- Heating rate.
- Holding duration.
- Cooling conditions.
Changing these parameters without suitable technical evaluation may affect:
- Hardness.
- Strength.
- Toughness.
- Residual stresses.
- Dimensional stability.
Where heat treatment is quality-critical, process control and verification should be particularly robust.
Material Condition
Material condition can also influence fabrication results.
Important factors may include:
- Material grade.
- Thickness.
- Surface condition.
- Temperature.
- Storage condition.
- Previous processing.
A change in material condition may alter how a fabrication process behaves.
Effect of Process Changes on Plant Safety
A process change can influence safety through several pathways.
Direct Effects
The change may directly create a hazard.
Indirect Effects
The change may create a defect that later contributes to equipment failure.
Long-Term Effects
The change may accelerate deterioration during service.
Human Factors
The change may make the process more difficult to perform consistently.
Failure Pathway Analysis
A useful way to assess changes is to trace the potential failure pathway.
For example:
Process Change
↓
Fabrication Characteristic Changes
↓
Component Defect
↓
Assembly Effect
↓
Equipment Performance Change
↓
Operational Risk
This approach helps prevent narrow decision-making.
Risk Assessment of Process Variables
A process-variable change can be assessed using:
Risk = Likelihood × Consequence
Additional considerations may include:
- Detectability.
- Exposure.
- Process criticality.
- Failure history.
- Uncertainty.
A high-consequence process should generally receive stronger verification.
Risk Assessment Questions
The evaluator should ask:
- What can change?
- What can fail?
- Why could it fail?
- What would happen if it failed?
- How likely is failure?
- Can the failure be detected?
- What controls exist?
- What additional verification is required?
Failure Mode Thinking
Potential failure modes may include:
- Cracking.
- Distortion.
- Leakage.
- Wear.
- Fatigue.
- Misalignment.
- Corrosion.
- Loosening.
- Fracture.
- Excessive vibration.
The purpose is not to assume that failure will occur but to evaluate credible consequences systematically.
Plant Safety Versus Production Efficiency
A common challenge is balancing production efficiency with quality and safety.
For example, reducing inspection frequency may decrease production waiting time.
However, if the removed inspection was important for detecting critical defects, the overall risk may increase.
Similarly, increasing machining speed may increase output but could:
- Increase tool wear.
- Increase surface defects.
- Increase dimensional variation.
A professional QA/QC decision should therefore consider the entire process rather than a single efficiency metric.
Process Optimisation Without Loss of Control
Optimisation should seek to improve:
- Efficiency.
- Quality.
- Safety.
- Reliability.
- Cost effectiveness.
It should not simply seek to minimise:
- Inspection.
- Documentation.
- Labour.
- Process time.
A successful optimisation maintains or improves required controls while removing unnecessary inefficiencies.
Monitoring Before and After a Change
A strong change evaluation uses baseline and post-change data.
Useful indicators may include:
- Defect rate.
- Rework rate.
- First-pass acceptance.
- Inspection failures.
- Equipment downtime.
- Maintenance frequency.
- Dimensional variation.
- Test failures.
- NCR frequency.
Example Performance Comparison
| Performance Indicator | Before Change | After Change | Evaluation |
|---|---|---|---|
| Rework Rate | 8% | 4% | Improvement |
| First-Pass Acceptance | 89% | 95% | Improvement |
| Dimensional Defects | 12 | 5 | Improvement |
| Equipment Downtime | 16 hrs | 18 hrs | Requires investigation |
| NCRs | 9 | 4 | Improvement |
The table demonstrates why a change should be evaluated using multiple indicators. A reduction in rework does not automatically prove that the change is successful if equipment downtime or another critical performance indicator deteriorates.
Practical Example: Increasing Machining Speed
Situation
A workshop proposes increasing machining speed to reduce production time.
Potential Benefits
- Higher throughput.
- Shorter cycle time.
- Improved machine utilisation.
Potential Risks
- Increased tool wear.
- Higher temperature.
- Surface-finish changes.
- Dimensional instability.
- Increased vibration.
QA/QC Evaluation
The team should establish:
- Current machining parameters.
- Proposed parameters.
- Applicable tolerances.
- Tool condition.
- Surface requirements.
- Inspection frequency.
- Baseline defect rates.
The modified process should then be verified through appropriate inspection and performance data.
Practical Example: Changing Welding Parameters
Situation
A fabrication team proposes changing welding speed to reduce production time.
Evaluation
The QA/QC professional reviews:
- Existing approved welding procedure.
- Proposed parameter.
- Heat input implications.
- Weld quality requirements.
- Applicable qualification requirements.
- Inspection requirements.
The change should not simply be accepted because production time is reduced.
Practical Example: Changing Bolt Torque
Situation
Assembly personnel propose increasing torque to prevent fastener loosening.
Potential Risk
Excessive torque may damage the fastener or joint.
Evaluation
The team should review:
- Engineering requirement.
- Fastener characteristics.
- Joint design.
- Applicable procedure.
- Torque equipment.
- Calibration status.
- Verification requirements.
The change should be technically justified and controlled.
Practical Example: Changing Heat-Treatment Duration
Situation
A manufacturer proposes reducing holding time to increase throughput.
Potential Consequences
The change could affect:
- Material properties.
- Residual stress.
- Dimensional stability.
- Reliability.
The proposal should therefore receive appropriate technical assessment before implementation.
Case Study: Optimising a Mechanical Fabrication Process
Background
A mechanical fabrication facility produces components for process equipment.
Management identifies:
- High rework.
- Long fabrication times.
- Increasing equipment maintenance.
- Several dimensional NCRs.
The production team proposes increasing machining speed.
Initial Assessment
The QA/QC team establishes a baseline:
- Current machining parameters.
- Dimensional conformity.
- Surface quality.
- Tool life.
- Rework.
- Equipment downtime.
Risk Assessment
The team identifies potential risks involving:
- Tool wear.
- Vibration.
- Surface finish.
- Dimensional accuracy.
Controlled Trial
The proposed process is evaluated under controlled conditions.
Measurements are taken at defined intervals.
Results
The modified process reduces cycle time but initially produces increased dimensional variation.
Evaluation
The team determines that simply increasing machining speed is not an acceptable optimisation.
Further adjustment is required.
Improved Solution
The process is modified using controlled parameters, tool monitoring and additional verification.
Final Results
The revised process demonstrates:
- Reduced cycle time.
- Stable dimensional performance.
- Lower rework.
- Acceptable equipment performance.
Lesson Learned
The case demonstrates that process optimisation should be evidence-based rather than driven by a single production target.
Change Control Process
A formal change-control process may include:
Step 1: Change Proposal
Define the proposed change.
Step 2: Technical Review
Evaluate technical implications.
Step 3: Risk Assessment
Identify potential failure modes and consequences.
Step 4: Quality Review
Determine inspection and testing requirements.
Step 5: Approval
Obtain appropriate technical and management approval.
Step 6: Controlled Implementation
Introduce the change under defined conditions.
Step 7: Verification
Evaluate results against acceptance requirements.
Step 8: Standardisation
Update controlled documentation where the change is accepted.
Documentation Requirements
A controlled process change may require updates to:
- Procedures.
- Work instructions.
- Inspection plans.
- Quality plans.
- Risk assessments.
- Process parameters.
- Training information.
- Inspection records.
- Equipment settings.
Documentation should reflect the approved process rather than allowing informal practices to become normalised.
Importance of Worker Feedback
Personnel performing fabrication activities can provide valuable information about process-variable effects.
They may identify:
- Difficult operating conditions.
- Excessive vibration.
- Tool-access issues.
- Equipment instability.
- Repeated defects.
- Process bottlenecks.
Worker feedback should be considered alongside objective engineering evidence.
Role of Inspection and Testing
Inspection and testing provide evidence that a process change has achieved its intended result.
Depending on the process, verification may involve:
- Dimensional inspection.
- Visual inspection.
- NDT.
- Functional testing.
- Mechanical testing.
- Pressure testing.
- Surface inspection.
- Performance monitoring.
The verification method should correspond to the characteristic being controlled.
Reliability Monitoring After Process Changes
Some effects may not become visible immediately.
Post-change monitoring may therefore include:
- Maintenance records.
- Equipment vibration.
- Component wear.
- Leakage.
- Repeat defects.
- Failure rates.
- Inspection trends.
This is particularly important where a process change may influence long-term equipment reliability.
Leading and Lagging Indicators
Leading Indicators
These provide information about conditions that may influence future performance.
Examples include:
- Process parameter compliance.
- Inspection completion.
- Training status.
- Calibration status.
- Preventive maintenance completion.
Lagging Indicators
These show results after events occur.
Examples include:
- Equipment failures.
- NCRs.
- Rework.
- Defects.
- Downtime.
A strong QA/QC system should use both.
Common Errors in Evaluating Process Changes
Organisations should avoid:
- Changing parameters without documented approval.
- Optimising only for production speed.
- Ignoring safety implications.
- Ignoring equipment reliability.
- Using insufficient baseline data.
- Failing to assess interaction between variables.
- Relying solely on operator opinion.
- Removing inspections without risk assessment.
- Failing to update procedures.
- Closing trials without reviewing results.
Benefits of Controlled Variable Evaluation
Safety Benefits
- Reduced probability of fabrication-related failures.
- Improved process control.
- Better identification of hazards.
- Stronger safety-critical quality controls.
Reliability Benefits
- Reduced premature failures.
- Better component integrity.
- Improved equipment performance.
- Reduced unplanned downtime.
Quality Benefits
- Lower defect rates.
- Reduced rework.
- Better dimensional control.
- Improved traceability.
Efficiency Benefits
- Reduced unnecessary process time.
- Better equipment utilisation.
- Improved workflow.
- More effective resource allocation.
Management Benefits
- Better decision-making.
- Stronger change control.
- Improved risk visibility.
- Better use of performance data.
Recommended Evaluation Framework
Define the Variable
Clearly identify what will change.
Establish the Baseline
Measure current performance.
Determine the Intended Benefit
Identify why the change is being considered.
Identify Failure Modes
Determine what could go wrong.
Assess Risk
Evaluate likelihood and consequence.
Define Controls
Establish limits, inspections and verification.
Conduct Controlled Implementation
Avoid uncontrolled full-scale implementation.
Measure Results
Compare against baseline.
Evaluate Safety
Confirm that risk has not increased.
Evaluate Reliability
Assess potential long-term consequences.
Standardise
Update procedures if the change is approved.
Professional Decision-Making Framework
A Level 6 QA/QC professional should ask five key questions:
1. Is the change technically justified?
There should be a clear engineering or operational reason.
2. Is the change controlled?
The proposed parameter should be defined and approved appropriately.
3. What could the change affect?
Consider quality, safety, reliability, cost and programme.
4. How will the change be verified?
Define objective evidence before implementation.
5. How will long-term effectiveness be monitored?
Some reliability effects require monitoring after production.
Key Takeaways
Effective evaluation of mechanical fabrication variables requires:
- Understanding process-variable relationships.
- Establishing reliable baseline data.
- Identifying potential failure modes.
- Assessing plant safety implications.
- Assessing equipment reliability.
- Applying risk-based decision-making.
- Using controlled change processes.
- Maintaining defined acceptance criteria.
- Using appropriate inspection and testing.
- Monitoring post-change performance.
- Reviewing worker feedback alongside objective evidence.
- Updating procedures after approved changes.
- Avoiding uncontrolled process deviations.
- Evaluating the complete system rather than isolated parameters.
Conclusion
Evaluating changes to mechanical fabrication variables requires a systems-based approach because process parameters can influence far more than immediate production output. Welding conditions, machining parameters, heat treatment, forming, bolting, alignment, material condition, dimensional tolerances, and inspection controls can affect component integrity, assembly performance, equipment reliability, maintenance requirements, and plant safety. A professional QA/QC assessment therefore begins with a clear understanding of the baseline process, identifies the proposed change, evaluates potential failure modes, considers risk, and establishes appropriate verification before the modified process is accepted. The objective is to ensure that improvements in efficiency do not compromise quality, safety, or long-term reliability.
For advanced mechanical QA/QC management, process-variable evaluation should form part of a controlled continual-improvement and change-management system. Objective evidence should be collected before and after implementation using relevant inspection results, testing data, NCR trends, rework rates, dimensional measurements, equipment-performance indicators, and reliability information. Where a change produces beneficial results, the successful process should be formally controlled through updated procedures, work instructions, training, inspection requirements, and monitoring arrangements. Where the change creates unacceptable risk or deteriorates performance, it should be modified or rejected. By applying this structured approach, mechanical engineering organisations can optimise fabrication operations while maintaining equipment integrity, plant safety, process reliability, regulatory and contractual compliance, and sustainable QA/QC performance.
2: Utilise Statistical Process Control (SPC) Charts and Data Modelling Tools to Identify Bottlenecks and Inefficiencies in Current Mechanical Testing Workflows
Statistical Process Control (SPC) and data modelling provide powerful methods for evaluating the performance, stability, consistency, and efficiency of mechanical testing workflows. In a modern mechanical QA/QC environment, testing activities generate substantial quantities of data, including test measurements, inspection results, equipment readings, test durations, repeat tests, failures, waiting times, non-conformances, calibration information, and approval times. When these data are collected and analysed systematically, they can reveal patterns that may not be visible through routine inspection or individual record reviews. SPC helps distinguish normal process variation from unusual variation, while data modelling can be used to investigate relationships between process variables, identify bottlenecks, predict performance trends, and support evidence-based improvement decisions.
For mechanical engineering projects, testing workflows may include material testing, dimensional verification, pressure testing, leak testing, functional testing, performance testing, inspection activities, non-destructive testing, and other project-specific verification processes. A workflow may appear technically compliant while still containing significant inefficiencies. For example, a test facility may achieve acceptable test results but experience excessive waiting time because equipment is not available when required, reports are delayed by approval bottlenecks, samples are repeatedly prepared, or calibration checks create unnecessary interruptions. Similarly, a testing process may produce acceptable results while showing increasing measurement variation that could indicate deterioration in equipment, inconsistent methods, or changing environmental conditions. SPC and data modelling allow QA/QC professionals to investigate these conditions using objective evidence.
At Level 6, effective application of SPC requires more than producing a chart. The QA/QC professional must understand the process being measured, select appropriate data, establish meaningful control limits, interpret patterns correctly, investigate special causes, and avoid confusing statistical control with specification compliance. A process can be statistically stable while consistently producing results outside customer or engineering requirements. Conversely, a process may experience temporary variation without necessarily being fundamentally incapable. Data modelling should therefore complement engineering judgement rather than replace it. The strongest approach combines statistical evidence, process knowledge, direct observation, risk assessment, and technical requirements to determine where mechanical testing workflows can be improved.
Understanding Statistical Process Control in Mechanical QA/QC
Statistical Process Control is a method of monitoring process behaviour using statistical information collected over time. Its purpose is to identify whether process variation is predictable and stable or whether unusual causes are influencing performance.
In mechanical testing, SPC can be applied to variables such as:
- Test measurement values.
- Dimensional results.
- Pressure readings.
- Temperature readings.
- Test duration.
- Repeat-test frequency.
- Defect rates.
- First-pass acceptance.
- Testing turnaround time.
- Equipment-related interruptions.
- Inspection waiting time.
- Report approval time.
SPC is particularly useful when data are collected repeatedly under reasonably consistent conditions.
Key Definitions and Concepts
| Term | Definition | Mechanical Testing Application |
|---|---|---|
| Statistical Process Control | Statistical method for monitoring process behaviour over time | Monitoring repeated mechanical test results |
| Control Chart | Graphical tool showing process data against calculated control limits | Tracking dimensional or testing variation |
| Control Limit | Statistically derived boundary indicating expected process variation | Identifying unusual testing measurements |
| Specification Limit | Requirement defining acceptable product or test performance | Comparing results with engineering acceptance criteria |
| Common Cause Variation | Natural variation inherent in a process | Normal variation from stable testing conditions |
| Special Cause Variation | Unusual variation caused by an identifiable factor | Faulty equipment or changed test conditions |
| Mean | Arithmetic average of observations | Average test value or turnaround time |
| Range | Difference between highest and lowest observation | Variation among repeated measurements |
| Standard Deviation | Measure of data dispersion around the mean | Assessing consistency of test results |
| Bottleneck | Process stage restricting overall workflow capacity | Limited testing equipment or approval capacity |
| Cycle Time | Time required to complete a process activity | Duration from test preparation to completion |
| Waiting Time | Time spent waiting between activities | Delay before equipment or approval is available |
| Throughput | Quantity of work completed within a period | Tests completed per shift |
| Data Modelling | Analytical representation used to examine relationships or predict outcomes | Modelling testing delays or failure patterns |
| Trend | Directional movement in process performance over time | Gradual increase in test duration |
| Outlier | Observation substantially different from other data | Unusually long testing cycle |
| Process Capability | Ability of a stable process to meet specified limits | Evaluating consistent test performance |
| Correlation | Statistical relationship between variables | Relationship between test workload and turnaround time |
Why SPC Matters in Mechanical Testing
Mechanical testing workflows often contain multiple interconnected activities.
A typical workflow may be:
Test Request → Planning → Sample Preparation → Equipment Allocation → Calibration Verification → Testing → Inspection → Data Recording → Technical Review → Approval → Reporting
A delay at one stage can affect every subsequent activity.
SPC and data modelling can help determine whether delays or variations are:
- Random.
- Recurring.
- Increasing.
- Associated with specific personnel.
- Associated with specific equipment.
- Associated with particular shifts.
- Associated with specific test types.
- Associated with workload.
- Associated with particular suppliers or materials.
This allows improvement resources to be directed towards the actual source of inefficiency.
Understanding Variation
Variation is inherent in real processes. Not every difference between test results indicates a failure.
Two broad categories are important.
Common Cause Variation
This represents normal variation associated with the established process.
Potential sources include:
- Normal equipment variation.
- Environmental conditions.
- Material differences within expected limits.
- Normal operator variation.
- Routine measurement uncertainty.
Special Cause Variation
This represents unusual variation associated with a specific change or abnormal condition.
Examples include:
- Equipment malfunction.
- Incorrect test setup.
- Unusual material condition.
- Incorrect procedure revision.
- Calibration problem.
- Operator error.
- Environmental disturbance.
The purpose of SPC is to help identify when process behaviour indicates a potential special cause.
Control Charts

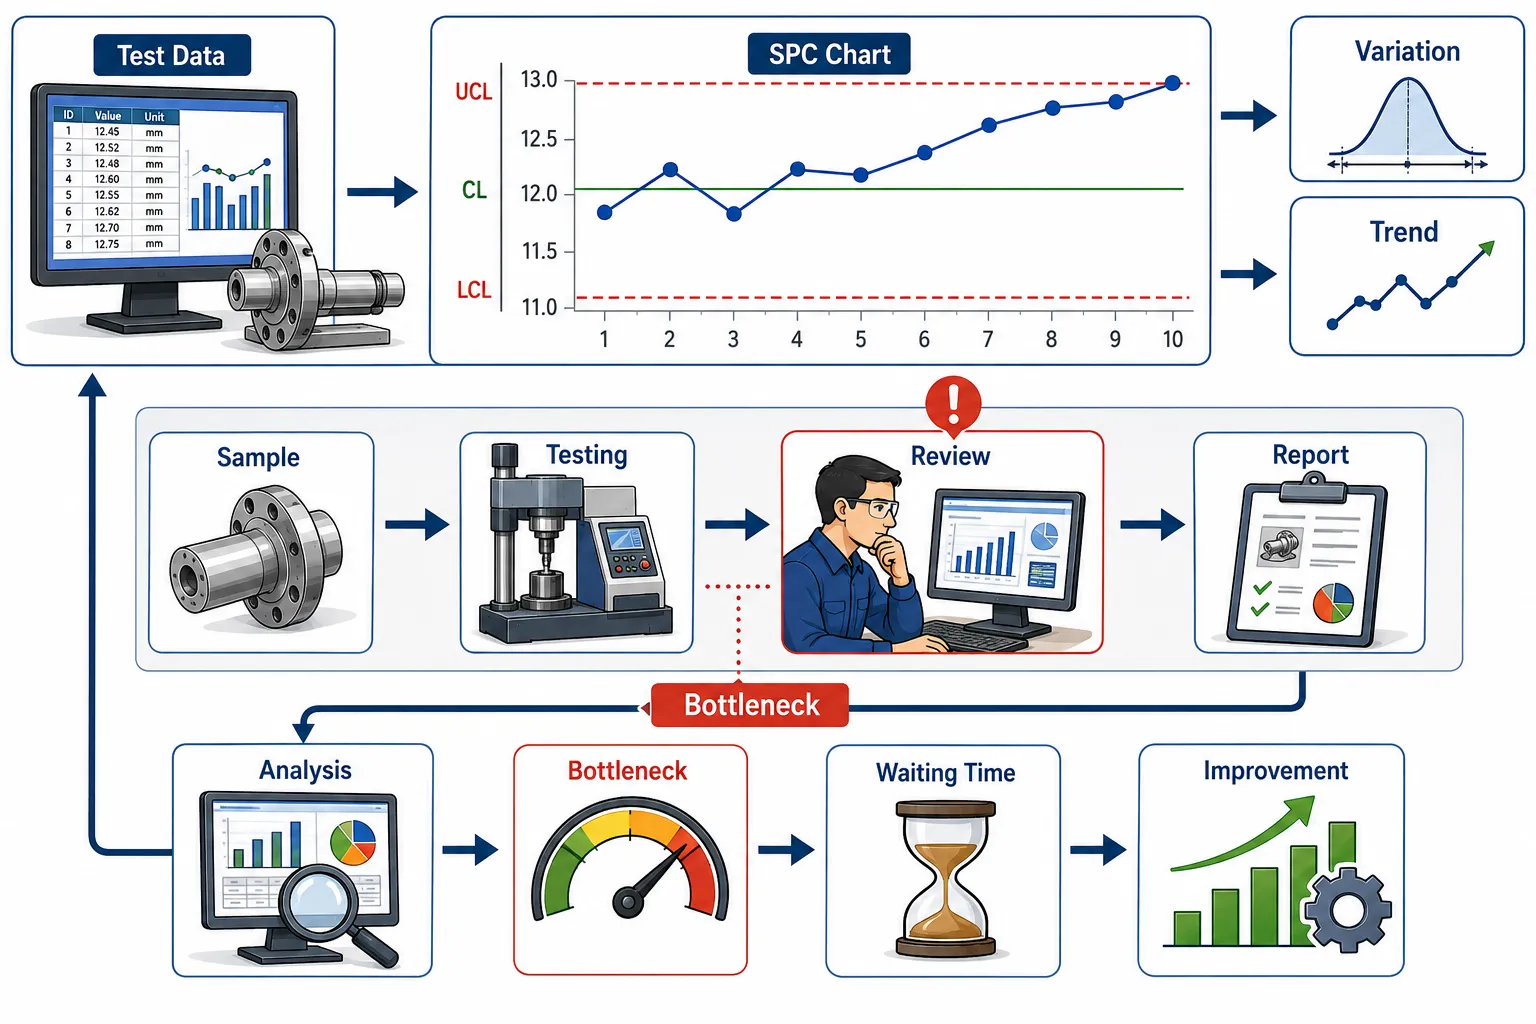
A control chart normally contains:
- A centre line.
- An upper control limit.
- A lower control limit.
- Sequential process observations.
The chart allows the QA/QC professional to examine process behaviour over time.
For example, a testing turnaround-time chart might show whether the process is generally stable or whether particular periods demonstrate unusual delays.
Control Limits Versus Specification Limits
This distinction is fundamental.
Control Limits
Control limits are derived from process data and indicate expected statistical behaviour.
Specification Limits
Specification limits come from technical, contractual, engineering, customer, or regulatory requirements.
These are not interchangeable.
A process can be:
- Stable but outside specification.
- Unstable but currently within specification.
- Stable and capable of meeting specification.
- Unstable and outside specification.
Therefore, an SPC chart should not be used as a replacement for engineering acceptance criteria.
Selecting Appropriate Data
The usefulness of SPC depends heavily on data quality.
Before analysing data, the QA/QC professional should determine:
- What is being measured?
- Why is it being measured?
- How frequently is it measured?
- Is the measurement method consistent?
- Is the equipment appropriately controlled?
- Are units consistent?
- Are timestamps accurate?
- Are missing values identified?
- Are abnormal values investigated?
- Is the sample representative?
Poor data can produce misleading conclusions.
Mechanical Testing Workflow Data
Useful datasets may include:
Quality Data
- Test pass rate.
- Test failure rate.
- NCR frequency.
- Repeat-test rate.
- Defect categories.
- First-pass acceptance.
Time Data
- Preparation time.
- Waiting time.
- Test duration.
- Review time.
- Approval time.
- Report completion time.
Equipment Data
- Equipment utilisation.
- Downtime.
- Calibration status.
- Maintenance interruptions.
- Equipment changeovers.
Workforce Data
- Test workload by shift.
- Test allocation.
- Personnel availability.
- Competence-related trends.
Identifying Bottlenecks
A bottleneck is a stage that limits the overall capacity or flow of a process.
For example:
Five tests prepared per hour → One testing machine → Two tests per hour capacity
The testing machine becomes a likely bottleneck.
However, the apparent bottleneck may not always be the true constraint.
A testing machine may have sufficient capacity but remain underutilised because:
- Samples are not ready.
- Test requests are incomplete.
- Calibration checks are delayed.
- Operators are unavailable.
- Approval is slow.
- Test results require repeated verification.
Data modelling helps investigate these relationships.
Process Mapping Before Statistical Analysis
SPC should be connected to process understanding.
Before building models or charts, map the testing workflow.
Identify:
- Inputs.
- Activities.
- Decision points.
- Inspection stages.
- Waiting periods.
- Approvals.
- Outputs.
- Rework loops.
This helps determine which variables should be measured.
Example Testing Workflow Map
Request
↓
Document Review
↓
Sample Preparation
↓
Equipment Allocation
↓
Calibration Check
↓
Testing
↓
Data Recording
↓
Technical Review
↓
Approval
↓
Report
At each stage, record:
- Processing time.
- Waiting time.
- Errors.
- Rework.
- Resource availability.
This creates a foundation for statistical analysis.
Measuring Cycle Time
Cycle time can be measured from the beginning to the end of a defined activity.
For example:
Test Request Received → Approved Test Report
If the process takes 18 hours for one test and 7 hours for another, the organisation should investigate the causes of the difference rather than assuming that the longer test is inherently inefficient.
Measuring Waiting Time
Waiting time is often overlooked.
Examples include:
- Waiting for equipment.
- Waiting for sample preparation.
- Waiting for an inspector.
- Waiting for calibration verification.
- Waiting for technical approval.
- Waiting for laboratory capacity.
A process may have only 2 hours of actual testing but 10 hours of waiting.
In such circumstances, improving the testing method itself may have limited impact.
Pareto Analysis
Pareto analysis can help prioritise causes of inefficiency.
For example, a testing department may record:
- Equipment waiting: 40%.
- Sample preparation: 25%.
- Report approval: 20%.
- Documentation errors: 10%.
- Other: 5%.
The analysis suggests that equipment waiting and sample preparation represent the largest opportunities.
The organisation can therefore prioritise these areas rather than spreading resources equally.
Trend Analysis
Trend analysis examines performance over time.
Potential trends include:
- Increasing test duration.
- Increasing repeat tests.
- Increasing equipment downtime.
- Decreasing first-pass acceptance.
- Increasing report approval time.
A gradual deterioration may not trigger an individual NCR but can still indicate an emerging process problem.
Moving Averages
Moving averages can help smooth short-term fluctuations and make longer-term patterns easier to observe.
For example, weekly average test turnaround times can be reviewed using a moving average to identify whether performance is gradually deteriorating.
The objective is not to hide variation but to identify meaningful directional patterns.
Standard Deviation
Standard deviation provides information about the dispersion of data around the average.
In a testing workflow, it can help answer:
- Are test durations consistent?
- Are measurement results tightly grouped?
- Is operator-to-operator variation substantial?
- Has process consistency deteriorated?
A high standard deviation may indicate greater variation requiring investigation.
Process Capability
Process capability examines whether a stable process can consistently meet specified requirements.
Common capability concepts include:
- Cp.
- Cpk.
These measures should only be interpreted appropriately when the underlying assumptions and data conditions are suitable.
A QA/QC professional should avoid reporting capability indices without considering:
- Process stability.
- Data distribution.
- Measurement system quality.
- Specification limits.
- Sample size.
- Independence of observations.
Measurement System Considerations
Before using test measurements for SPC, the measurement system itself should be reliable.
The auditor or QA/QC professional should consider:
- Calibration.
- Measurement resolution.
- Repeatability.
- Reproducibility.
- Equipment condition.
- Measurement procedure.
- Operator competence.
If the measurement system is unstable, the resulting SPC analysis may be misleading.
Data Modelling in Mechanical QA/QC
Data modelling uses statistical or analytical methods to explore relationships between variables.
For example, a model may examine whether:
Testing Workload → Waiting Time
or:
Equipment Downtime → Test Delays
or:
Repeat Testing → Total Cycle Time
The purpose is to understand relationships that can support process improvement.
Variables in a Data Model
Dependent Variable
The outcome being investigated.
Examples:
- Test turnaround time.
- Test failure.
- Rework.
- Waiting time.
Independent Variable
A factor potentially influencing the outcome.
Examples:
- Number of test requests.
- Equipment availability.
- Shift.
- Test type.
- Operator.
- Sample complexity.
Correlation
Correlation can help identify whether two variables move together.
For example:
- Higher workload may correlate with longer waiting times.
- Increased equipment downtime may correlate with lower testing throughput.
However, correlation does not automatically prove causation.
Professional judgement is required to determine whether the relationship is technically meaningful.
Regression Modelling
Regression analysis can be used to estimate relationships between variables.
For example, a testing department may model turnaround time using:
- Number of active test requests.
- Equipment availability.
- Sample preparation time.
- Review workload.
The model may indicate which variables have stronger relationships with turnaround time.
Classification Models
Where appropriate, data modelling may also classify outcomes.
For example:
Test Result → Pass / Fail
Potential influencing factors may include:
- Material category.
- Process condition.
- Equipment.
- Test type.
Such models should be used carefully and should not replace technical acceptance requirements.
Predictive Analysis
Historical data may be used to identify potential future conditions.
Examples include predicting:
- Testing workload.
- Equipment demand.
- Likely bottleneck periods.
- Maintenance-related interruptions.
- Increasing failure trends.
Predictive information can support resource planning.
Practical Example: Testing Bottleneck
A mechanical testing facility receives 50 test requests per week.
Data show:
- Average test duration: 1.5 hours.
- Average waiting time: 6 hours.
- Equipment utilisation: 82%.
- Repeat tests: 9%.
- Report approval delay: 4 hours.
The data suggest that actual testing time is not the only constraint.
Further investigation identifies report approval as a significant bottleneck.
The organisation therefore improves:
- Report review workflow.
- Approval responsibilities.
- Data templates.
The improvement reduces total turnaround time without changing the test method.
Practical Example: SPC for Dimensional Testing
A machining department records the diameter of components from repeated production batches.
The data are plotted on an appropriate control chart.
The chart shows a gradual upward trend.
Although individual measurements remain within specification, the trend indicates that the process may be moving away from its established centre.
The QA/QC team investigates:
- Tool wear.
- Machine condition.
- Temperature.
- Measurement system.
The investigation identifies progressive tool wear.
The issue is addressed before dimensions exceed specification.
This demonstrates the preventative value of SPC.
Practical Example: Test Failure Analysis
A testing department records failed tests for six months.
A Pareto analysis identifies:
- Sample preparation errors.
- Equipment-related issues.
- Material defects.
- Procedure deviations.
Sample preparation errors account for the largest proportion.
Instead of increasing final inspection, the organisation improves sample preparation controls.
This targets the actual source of the problem.
Practical Example: Equipment Bottleneck
A workshop operates several testing machines.
Data modelling shows that one machine handles 65% of critical testing activities while other machines remain underutilised.
The organisation investigates:
- Equipment capability.
- Operator competence.
- Scheduling.
- Test compatibility.
The issue is found to be an allocation problem rather than insufficient total capacity.
Work is redistributed.
This reduces waiting without purchasing new equipment.
Practical Example: Repeat Testing
A laboratory observes that repeat tests have increased from 4% to 11%.
SPC analysis shows that the increase began after a process change.
Further investigation identifies:
- Modified sample preparation.
- New personnel.
- Different equipment settings.
The QA/QC team compares the new process against the previous baseline.
The evidence supports targeted process correction.
Statistical Signals That May Require Investigation
Depending on the chart and data characteristics, potential warning signals include:
- A point beyond a control limit.
- Sustained shift in the process mean.
- Persistent trend.
- Unusual clustering.
- Repeated patterns.
- Increasing variation.
- Sudden change in dispersion.
The exact interpretation should follow the control-chart method being used and the characteristics of the dataset.
Avoiding Misinterpretation of Control Charts
A single unusual point should not automatically be treated as proof of process failure.
The auditor should ask:
- Was the measurement recorded correctly?
- Was the test performed normally?
- Was equipment functioning correctly?
- Was there an unusual material condition?
- Was the procedure followed?
- Was there an environmental influence?
The objective is to identify the cause rather than simply react to the data point.
SPC and Safety
SPC can indirectly support safety by identifying deteriorating process performance before failures become significant.
For example:
Increasing dimensional variation → Fit deterioration → Increased vibration → Equipment reliability concern
Similarly:
Increasing pressure-test variation → Test-process instability → Potential containment concern
SPC therefore supports preventative quality management.
SPC and Reliability
Reliability improvement depends partly on identifying conditions that precede failure.
Relevant indicators may include:
- Increasing vibration.
- Increasing dimensional variation.
- Increasing repeat testing.
- Increasing equipment downtime.
- Increasing repair frequency.
Trend analysis can provide early warning.
Data Quality Requirements
Before modelling data, verify:
- Accuracy.
- Completeness.
- Consistency.
- Timeliness.
- Traceability.
- Correct units.
- Correct timestamps.
- Reliable measurement methods.
Data cleaning should not remove unusual observations simply because they are inconvenient.
Outliers should be investigated.
Handling Missing Data
Missing values can arise because:
- Records were not completed.
- Equipment was unavailable.
- Data were entered incorrectly.
- Systems were changed.
The analyst should determine why data are missing before deciding how to treat them.
Data Segmentation
Combining all data into one dataset can hide important patterns.
Data may need to be segmented by:
- Test type.
- Equipment.
- Shift.
- Operator.
- Material.
- Project.
- Location.
- Supplier.
- Time period.
Segmentation may reveal a bottleneck or failure pattern that is invisible in aggregated data.
Workflow Efficiency Indicators
Useful KPIs include:
- Average test turnaround time.
- Median test turnaround time.
- Waiting time.
- Test throughput.
- Repeat-test percentage.
- First-pass acceptance.
- Equipment utilisation.
- Equipment downtime.
- Report approval time.
- NCR frequency.
- Test failure rate.
Example KPI Dashboard
| KPI | Current Result | Trend | Potential Interpretation |
|---|---|---|---|
| Test Turnaround | 14 hrs | Increasing | Possible workflow bottleneck |
| Waiting Time | 7 hrs | Increasing | Resource constraint |
| First-Pass Acceptance | 93% | Stable | Process generally consistent |
| Repeat Testing | 8% | Increasing | Potential process issue |
| Equipment Utilisation | 86% | Increasing | Capacity pressure |
| Report Approval | 4 hrs | Stable | Moderate administrative delay |
| NCR Frequency | 5% | Increasing | Emerging quality concern |
Process Bottleneck Identification Procedure
Step 1: Map the Workflow
Document every major activity.
Step 2: Collect Time Data
Record processing and waiting time.
Step 3: Identify Capacity Constraints
Determine where demand exceeds available capacity.
Step 4: Analyse Variation
Use appropriate SPC methods.
Step 5: Identify Relationships
Use modelling or correlation analysis where suitable.
Step 6: Validate Findings
Compare statistical findings with workplace observations.
Step 7: Implement Improvement
Target the verified constraint.
Step 8: Monitor Results
Continue measuring performance after implementation.
Combining SPC with Root Cause Analysis
SPC identifies unusual or changing process behaviour.
Root Cause Analysis investigates why it occurred.
For example:
SPC → Detects increasing test duration
↓
Data Analysis → Links increase to equipment downtime
↓
RCA → Identifies maintenance scheduling weakness
↓
Corrective Action → Improves maintenance planning
↓
SPC → Confirms improved stability
This creates a strong improvement cycle.
Combining SPC with Lean Thinking
Lean focuses on eliminating waste.
SPC focuses on process variation.
Together they can identify:
- Waiting.
- Rework.
- Excess processing.
- Unnecessary movement.
- Unstable processes.
For example, a testing process may have:
Stable test results but excessive waiting
In this case, Lean analysis may be more useful for the workflow bottleneck than changing the technical test process.
Data Modelling and Professional Judgement
Models provide evidence, but they do not replace engineering judgement.
A model may show that a certain variable is associated with increased testing time.
The QA/QC professional must still determine:
- Whether the relationship is technically credible.
- Whether the data are representative.
- Whether another variable is influencing both factors.
- Whether the result is practically significant.
- Whether intervention is justified.
Case Study: Optimising a Mechanical Testing Workflow
Background
A mechanical engineering facility performs dimensional, pressure, and functional testing.
Management receives complaints about long turnaround times.
Initial Data
Six months of data are collected.
The analysis identifies:
- Increasing waiting time.
- Stable technical test duration.
- Increasing report approval time.
- Increased equipment utilisation.
- Moderate growth in repeat testing.
SPC Analysis
Control charts show that test duration itself remains relatively stable.
This suggests that the technical testing process is not the main source of delay.
Workflow Analysis
Process mapping reveals that tests spend considerable time waiting for review.
Data Modelling
A relationship is identified between workload and report approval time.
Bottleneck
The primary bottleneck is identified as the technical-review stage rather than the testing equipment.
Improvement
The organisation:
- Clarifies review responsibilities.
- Introduces structured reporting templates.
- Prioritises high-risk reports.
- Improves workload allocation.
Results
Following implementation:
- Waiting time decreases.
- Turnaround time improves.
- Testing capacity increases.
- No deterioration in technical test quality is observed.
Lesson
The case demonstrates why organisations should analyse the complete workflow rather than assuming that the testing activity itself is responsible for delays.
Common Mistakes in SPC and Data Modelling
Mechanical QA/QC teams should avoid:
- Using poor-quality data.
- Treating every outlier as a defect.
- Confusing control limits with specification limits.
- Ignoring measurement-system reliability.
- Using inappropriate chart types.
- Analysing insufficient data.
- Ignoring process changes.
- Assuming correlation proves causation.
- Removing inconvenient data without justification.
- Focusing only on averages.
- Ignoring variation.
- Ignoring workplace observations.
- Making decisions from statistical results without engineering review.
Benefits of SPC and Data Modelling
Quality Benefits
- Early detection of process instability.
- Reduced recurring defects.
- Improved consistency.
- Better testing reliability.
- Reduced repeat testing.
Efficiency Benefits
- Identification of bottlenecks.
- Reduced waiting time.
- Improved equipment utilisation.
- Better workload allocation.
- Reduced unnecessary processing.
Safety Benefits
- Earlier detection of deteriorating conditions.
- Improved process stability.
- Reduced probability of uncontrolled variation.
- Better reliability of safety-critical testing.
Reliability Benefits
- Early identification of equipment-related trends.
- Reduced process-related failures.
- Improved consistency.
- Better predictive decision-making.
Management Benefits
- Evidence-based resource planning.
- Better performance monitoring.
- Improved prioritisation.
- Stronger continual improvement.
Recommended SPC and Data Modelling Workflow
Define the Problem
Identify the testing inefficiency or performance concern.
Map the Process
Understand the complete workflow.
Define Metrics
Select meaningful KPIs.
Validate Data
Confirm accuracy and completeness.
Establish Baseline
Determine normal process performance.
Apply SPC
Monitor variation and stability.
Model Relationships
Investigate possible causes and bottlenecks.
Validate Findings
Compare analytical results with technical evidence.
Implement Improvement
Target the verified constraint.
Monitor Effectiveness
Continue measuring performance after implementation.
Key Takeaways
Effective use of SPC charts and data modelling in mechanical testing should:
- Begin with a clear process definition.
- Establish reliable baseline data.
- Identify meaningful quality and efficiency metrics.
- Distinguish common and special causes of variation.
- Use appropriate control charts.
- Separate control limits from specification limits.
- Validate the measurement system.
- Analyse testing cycle and waiting times.
- Identify workflow bottlenecks.
- Use Pareto analysis where prioritisation is required.
- Examine trends over time.
- Use modelling to investigate relationships.
- Avoid assuming correlation proves causation.
- Combine statistical analysis with engineering judgement.
- Consider equipment, personnel, workload and process variables.
- Validate analytical findings through workplace observation.
- Implement targeted improvements.
- Monitor performance after changes.
Conclusion
Statistical Process Control and data modelling provide mechanical QA/QC professionals with structured methods for transforming testing data into actionable quality and operational intelligence. Rather than relying solely on individual inspection results or subjective observations, SPC allows process variation to be monitored over time, while data modelling helps investigate relationships between workload, equipment availability, testing duration, repeat testing, approval delays, and other performance variables. These methods are particularly valuable when mechanical testing workflows become complex and traditional observation alone cannot clearly identify the source of inefficiency. However, statistical tools must always be applied with appropriate understanding of the process, measurement system, data quality, control limits, specification requirements, and engineering context.
The most effective approach is to integrate SPC and data modelling into a wider QA/QC improvement cycle. A testing workflow should first be mapped and measured, reliable baseline data established, and meaningful KPIs selected. Appropriate SPC techniques can then identify instability or changing variation, while data modelling, trend analysis, Pareto analysis, and process investigation can identify bottlenecks and potential causes. The findings should be validated through direct workplace observation and technical judgement before corrective or improvement actions are implemented. Once changes are introduced, the same performance measures should be monitored to verify effectiveness. When applied in this controlled manner, SPC and data modelling can reduce testing delays, improve resource utilisation, reduce repeat testing and rework, strengthen process reliability, and support safer and more efficient mechanical engineering operations.
3: Redesign Existing Inspection and Testing Procedures to Maximise Operational Speed Without Reducing Safety Margins or Violating Design Codes
Redesigning inspection and testing procedures in mechanical engineering requires a careful balance between operational efficiency, technical quality, plant safety, and compliance with applicable design codes and project requirements. The objective is not simply to make inspections faster or reduce the number of verification activities. A professionally designed QA/QC improvement process removes unnecessary delays, duplication, administrative waste, unclear responsibilities, and inefficient sequencing while preserving every inspection or test that is necessary to demonstrate mechanical integrity and compliance. The strongest approach is therefore to optimise the workflow around the existing technical requirements rather than weakening the requirements themselves.
Mechanical inspection and testing procedures can become inefficient over time as projects grow, equipment changes, additional documentation requirements are introduced, or different departments create overlapping verification activities. A procedure may contain repeated approvals, unnecessary data entry, excessive movement of inspection personnel, poorly sequenced tests, or waiting periods that do not contribute to technical assurance. At the same time, certain quality controls may be safety-critical and cannot simply be removed because they appear to slow production. Redesign therefore requires a distinction between value-adding controls, mandatory controls, administrative activities, and unnecessary duplication.
For advanced QA/QC management, procedure optimisation should be based on engineering evidence, risk assessment, process mapping, applicable design codes, approved specifications, inspection and test plans, contractual requirements, and historical quality-performance data. Any proposed change should be formally evaluated before implementation. The redesigned process should continue to provide adequate evidence that materials, fabrication, assembly, installation, inspection, and testing meet defined requirements. In this way, operational speed can improve without compromising mechanical integrity, safety margins, reliability, traceability, or compliance.
Understanding Inspection and Testing Procedure Redesign
Inspection and testing procedure redesign means systematically reviewing an existing process and modifying its sequence, responsibilities, documentation, resources, or methods to improve effectiveness.
The redesign may involve:
- Removing duplicated activities.
- Combining compatible inspection steps.
- Improving inspection sequencing.
- Introducing digital records.
- Reducing unnecessary waiting.
- Clarifying approval responsibilities.
- Improving equipment availability.
- Introducing risk-based inspection planning.
- Improving sample preparation.
- Standardising inspection forms.
- Reducing repeated data entry.
- Improving communication between departments.
- Introducing appropriate automated measurements.
- Improving scheduling.
- Strengthening pre-test preparation.
The critical principle is that efficiency improvements should come from eliminating unnecessary process waste rather than eliminating necessary technical controls.
Key Definitions and Concepts
| Term | Definition | Mechanical QA/QC Application |
|---|---|---|
| Inspection | Examination of a product, component or process against defined requirements | Checking dimensions, welds, materials or assembly conditions |
| Testing | Technical activity used to determine performance or characteristics | Pressure, functional, dimensional or mechanical testing |
| Procedure | Controlled sequence describing how an activity is performed | Mechanical inspection or testing procedure |
| Inspection and Test Plan | Structured plan defining inspection and testing activities | Identifies inspection stages, responsibilities and verification points |
| Safety Margin | Allowance between normal operation and an unacceptable condition | Protecting mechanical systems from excessive operational risk |
| Design Code | Technical requirements governing design, construction or verification | Applicable engineering code controlling component integrity |
| Hold Point | Mandatory stage requiring approval before work proceeds | Inspection must be accepted before the next activity |
| Witness Point | Stage where an authorised party may observe an activity | Client or inspector may attend testing |
| Surveillance | Monitoring of an activity without necessarily stopping progress | Periodic observation of fabrication |
| Risk-Based Inspection | Inspection prioritised according to risk and consequence | Increased verification for critical equipment |
| Traceability | Ability to link materials, processes and records | Linking material certificates to fabricated components |
| Rework | Work required to correct a defect or non-conformity | Reworking defective fabrication or assembly |
| Cycle Time | Total time required to complete a defined process | Time from inspection request to accepted result |
| Bottleneck | Process stage restricting overall workflow | Limited test equipment or slow approval |
| Verification | Confirmation that specified requirements have been fulfilled | Reviewing inspection and test results |
| Validation | Confirmation that a process can achieve its intended outcome | Demonstrating that a revised test process remains effective |
| Process Control | Measures used to maintain consistent process performance | Controlled testing parameters and inspection conditions |
Why Inspection Procedures Become Inefficient
Inspection and testing systems may become inefficient because of:
- Multiple departments checking the same characteristic.
- Repeated approval stages.
- Poorly defined responsibilities.
- Manual record duplication.
- Incomplete inspection requests.
- Unplanned equipment availability.
- Poor test scheduling.
- Late material availability.
- Unclear acceptance criteria.
- Excessive document movement.
- Repeated technical reviews.
- Poor communication between production and QA/QC.
- Unnecessary movement between work areas.
- Inspection requests submitted without adequate preparation.
These inefficiencies can increase project duration without necessarily improving quality.
The Difference Between Speed and Rushing
Operational speed should not be confused with rushing.
Rushing an inspection may create:
- Missed defects.
- Incorrect measurements.
- Incomplete records.
- Unsafe testing.
- Incorrect acceptance decisions.
- Increased rework.
A redesigned procedure should instead improve the flow of work.
The objective should be:
Better Process Design → Less Waiting → Less Duplication → Faster Verification → Maintained Technical Assurance
Establishing the Baseline
Before redesigning a procedure, the existing process should be measured.
Relevant baseline information may include:
- Average inspection duration.
- Average test duration.
- Waiting time.
- Number of inspection requests.
- Number of repeat inspections.
- Number of failed tests.
- Number of NCRs.
- Number of approval stages.
- Rework rate.
- Equipment utilisation.
- Report completion time.
- Inspection personnel utilisation.
Without a baseline, it is difficult to determine whether redesign has actually produced improvement.
Mapping the Existing Process
Process mapping provides a visual representation of how an inspection or test currently operates.
A typical mechanical testing workflow may be:
Work Completion → Inspection Request → Document Review → Inspector Allocation → Equipment Preparation → Pre-Test Inspection → Test → Results Recording → Technical Review → Approval → Final Record
Each stage should be examined for:
- Processing time.
- Waiting time.
- Repetition.
- Responsibility.
- Risk.
- Technical value.
Identifying Value-Adding Activities
A value-adding activity contributes directly to demonstrating conformity or achieving the intended technical outcome.
Examples include:
- Measuring a critical dimension.
- Conducting a required pressure test.
- Performing required NDT.
- Verifying material identification.
- Confirming equipment calibration.
- Reviewing critical test results.
These activities should generally be retained where required by applicable technical requirements.
Identifying Non-Value-Adding Activities
Potential non-value-adding activities include:
- Re-entering identical information into multiple forms.
- Waiting unnecessarily for administrative approval.
- Repeating an inspection because of poor scheduling.
- Moving documents between departments unnecessarily.
- Performing duplicate checks with no additional assurance value.
Such activities should be reviewed for elimination, simplification, or integration.
Identifying Mandatory Controls
Before removing any inspection or test activity, determine whether it is required by:
- Applicable design codes.
- Project specifications.
- Contractual requirements.
- Approved quality plans.
- Regulatory requirements.
- Manufacturer requirements.
- Engineering design requirements.
- Approved inspection and test plans.
Mandatory controls should not be removed merely because they appear inefficient.
Risk-Based Redesign
Risk-based redesign focuses greater resources on activities where failure could have greater consequences.
For example:
High-Criticality Equipment
May require:
- More detailed inspection.
- Additional verification.
- Defined hold points.
- Greater documentation.
- Specialist review.
Lower-Risk Activities
May be suitable for:
- Sampling.
- Surveillance.
- Simplified documentation.
- Combined inspection stages.
This allows resources to be allocated according to technical significance.
Inspection Classification
Inspection activities can be considered according to their role.
Hold Points
Work cannot proceed until the required inspection or approval has been completed.
Witness Points
The authorised party has the opportunity to witness the activity.
Surveillance
The activity is monitored periodically.
Review
Records or documents are examined after the activity.
A well-designed system uses these mechanisms appropriately.
Avoiding Unnecessary Hold Points
Excessive hold points can create significant project delays.
For example, if five sequential activities each require separate approval before work proceeds, the cumulative waiting time may become substantial.
However, hold points associated with critical safety or quality characteristics should not be removed without technical justification.
The improvement opportunity may instead involve:
- Better scheduling.
- Advance notification.
- Digital approvals.
- Defined response times.
- Improved resource allocation.
Combining Compatible Inspection Activities
Where technically appropriate, related inspections may be combined.
For example, a coordinated dimensional and visual inspection may be conducted during the same inspection visit if:
- Both activities require the same personnel.
- The inspection conditions are suitable.
- Applicable requirements remain satisfied.
- Records remain clear.
- No mandatory independent verification is lost.
Combining activities can reduce:
- Travel.
- Waiting.
- Repeated setup.
- Administrative processing.
Improving Inspection Sequencing
The order of activities can significantly affect efficiency.
For example:
Poor Sequence:
Fabrication → Partial inspection → Assembly → Discover missing material evidence → Stop work → Document retrieval → Repeat inspection
Improved Sequence:
Material verification → Fabrication → Required inspection → Assembly → Final verification
Good sequencing prevents downstream work from being disrupted by upstream quality problems.
Pre-Inspection Readiness
One of the most effective ways to reduce wasted inspection time is to establish readiness criteria.
Before requesting inspection, the responsible team should confirm:
- Work is complete.
- Required drawings are available.
- Materials are traceable.
- Required records are prepared.
- Equipment is available.
- Required surfaces are accessible.
- Relevant procedures are current.
- Previous actions are closed.
- Required test conditions are established.
This reduces rejected or aborted inspection requests.
Inspection Readiness Checklist
A practical readiness process may verify:
- Correct component identification.
- Correct drawing revision.
- Material documentation.
- Process records.
- Required measurements.
- Equipment calibration.
- Access and lighting.
- Safety controls.
- Previous NCR status.
- Required personnel availability.
The purpose is not to create excessive paperwork but to prevent avoidable inspection delays.
Digital Inspection Records
Appropriate digital systems can improve speed by reducing:
- Manual transcription.
- Duplicate data entry.
- Document transport.
- Searching time.
- Report compilation time.
Digital systems may support:
- Electronic inspection requests.
- Mobile inspection forms.
- Automated timestamps.
- Digital signatures.
- Photo evidence.
- Controlled document references.
- Automated status tracking.
However, digitalisation should not compromise:
- Data integrity.
- Traceability.
- Access control.
- Record retention.
- Approval authority.
Automated Data Capture
Where technically appropriate, inspection equipment may transfer measurement data directly into controlled records.
Potential benefits include:
- Reduced transcription errors.
- Faster record completion.
- Improved traceability.
- Better data analysis.
- Faster report preparation.
Automation should be validated before becoming part of a controlled inspection process.
Reducing Duplicate Documentation
A common source of inefficiency is entering the same information into:
- Inspection request.
- Inspection report.
- Test report.
- Quality database.
- Project tracker.
Where systems allow, controlled data integration can reduce duplication.
The information should remain traceable and accessible to authorised users.
Inspection Equipment Availability
Testing delays may arise when equipment is unavailable.
Improvement measures can include:
- Advanced scheduling.
- Equipment booking.
- Preventive maintenance.
- Calibration planning.
- Shared equipment registers.
- Backup equipment where justified.
Equipment should remain appropriately controlled and calibrated.
Calibration Cannot Be Bypassed
A critical efficiency principle is that inspection speed must never be achieved by using equipment without the required calibration status.
A faster measurement with unreliable equipment does not represent process improvement.
The correct approach is to improve:
- Calibration scheduling.
- Equipment allocation.
- Equipment tracking.
- Preventive maintenance.
Optimising Testing Sequence
Testing should be sequenced logically.
For example:
Pre-Test Inspection → Equipment Verification → Test Setup → Safety Verification → Test Execution → Data Recording → Technical Review
This prevents unnecessary repetition and ensures prerequisites are satisfied before testing begins.
Safety Verification Before Testing
Mechanical testing may involve:
- Pressure.
- Temperature.
- Rotating equipment.
- Stored energy.
- Heavy components.
- Moving machinery.
- Chemical or process hazards.
The procedure should therefore establish appropriate pre-test safety controls.
Efficiency should never involve:
- Skipping safety checks.
- Reducing required exclusion zones.
- Removing essential monitoring.
- Bypassing protective devices.
- Proceeding without required authorisation.
Maintaining Safety Margins
Safety margins represent the separation between normal operation and potentially unsafe conditions.
When redesigning procedures, the team should determine:
- Which controls are safety-critical.
- Which parameters are mandatory.
- Which limits must remain unchanged.
- Which activities provide essential protection.
- Which delays are caused by process inefficiency rather than necessary safety controls.
The correct target is to remove unnecessary waiting around safety controls, not to remove the controls themselves.
Design-Code Compliance
Inspection and testing procedures must remain consistent with applicable design and construction requirements.
Depending on the project, requirements may arise from:
- Engineering design codes.
- Equipment specifications.
- Piping requirements.
- Welding requirements.
- Pressure equipment requirements.
- Material standards.
- Customer specifications.
- Contract requirements.
The exact requirements depend on the equipment and project.
Code Compliance During Procedure Redesign
Before changing an inspection activity, ask:
- Is this inspection required by the applicable code?
- Is the test mandatory?
- Is the frequency specified?
- Is independent verification required?
- Are acceptance criteria defined?
- Does the proposed change alter compliance evidence?
- Does the change affect design assumptions?
If the answer indicates a mandatory requirement, the process cannot simply be shortened without appropriate technical and contractual review.
Designing Faster Without Reducing Verification
A useful principle is:
Reduce Process Waste, Not Assurance
For example, instead of removing an inspection:
- Schedule it earlier.
- Improve readiness.
- Combine compatible activities.
- Provide digital evidence.
- Allocate personnel more effectively.
- Reduce waiting.
- Improve communication.
The technical control remains intact while the surrounding workflow becomes faster.
Practical Example: Pressure Testing
Existing Process
A pressure test requires:
- Test request.
- Document review.
- Inspector arrival.
- Equipment verification.
- Test setup.
- Safety review.
- Test.
- Result review.
- Report approval.
Delays occur because inspectors are notified only after the system is ready.
Redesigned Process
The project introduces:
- Advance inspection notification.
- Test readiness confirmation.
- Equipment pre-check.
- Standardised test documentation.
- Defined inspector availability.
- Digital result recording.
The actual test requirements remain unchanged.
Result
Waiting time decreases without reducing:
- Safety controls.
- Test requirements.
- Acceptance criteria.
- Required verification.
Practical Example: Dimensional Inspection
A fabrication team requests inspection before completing all required measurements.
The inspector arrives but cannot complete the inspection.
The redesigned process introduces a readiness requirement requiring:
- Drawing verification.
- Component identification.
- Measurement points prepared.
- Access confirmed.
The number of aborted inspections decreases.
Practical Example: Welding Inspection
A welding inspection workflow contains separate visits for:
- Joint preparation.
- Welding completion.
- Visual inspection.
- Dimensional inspection.
Where project requirements permit, some compatible inspections may be coordinated during the same visit.
However, required inspection stages and acceptance requirements remain intact.
Practical Example: Equipment Testing
A test facility experiences delays because equipment calibration records are checked manually before each test.
A controlled digital equipment register is introduced.
The system provides:
- Equipment identification.
- Calibration status.
- Expiry information.
- Equipment availability.
The control remains, but verification becomes faster.
Case Study: Redesigning a Mechanical Testing Procedure
Project Background
A mechanical fabrication facility experiences increasing test turnaround times.
The QA/QC department identifies:
- Long inspection waiting periods.
- Duplicate documentation.
- Repeated test requests.
- Equipment scheduling conflicts.
- Delayed report approval.
Management asks for a procedure redesign.
Stage 1: Baseline Review
The team measures:
- Test duration.
- Waiting time.
- Repeat testing.
- Approval time.
- Equipment utilisation.
Stage 2: Process Mapping
The workflow is mapped from test request to final report.
Stage 3: Bottleneck Identification
The largest delays occur before testing and during report approval.
Stage 4: Risk Review
The team identifies safety-critical controls that must remain.
These include:
- Equipment verification.
- Test setup checks.
- Safety controls.
- Required inspection stages.
- Acceptance criteria.
Stage 5: Redesign
The team introduces:
- Test-readiness confirmation.
- Advance scheduling.
- Standardised documentation.
- Digital result recording.
- Defined review responsibilities.
Stage 6: Controlled Implementation
The revised process is trialled.
Stage 7: Performance Review
The team compares:
- Waiting time.
- Test turnaround.
- Repeat tests.
- NCRs.
- Safety incidents.
- Quality outcomes.
Result
The redesigned procedure improves turnaround time while maintaining the same technical verification requirements.
Lesson Learned
The improvement comes from redesigning the workflow rather than reducing essential quality or safety controls.
Measuring Procedure Effectiveness
After redesign, performance should be monitored.
Useful indicators include:
- Inspection turnaround time.
- Test completion time.
- Waiting time.
- First-pass acceptance.
- Repeat inspection rate.
- Repeat test rate.
- NCR frequency.
- Rework rate.
- Equipment utilisation.
- Report approval time.
- Safety incidents.
- Audit findings.
Balanced Performance Measurement
Speed alone should not determine whether the redesign is successful.
A procedure should be considered successful when it improves efficiency while maintaining or improving:
- Safety.
- Quality.
- Compliance.
- Reliability.
- Traceability.
For example:
| KPI | Before Redesign | After Redesign | Interpretation |
|---|---|---|---|
| Average Test Cycle | 16 hrs | 11 hrs | Improved |
| Waiting Time | 7 hrs | 3 hrs | Improved |
| Repeat Tests | 9% | 6% | Improved |
| NCR Rate | 4.5% | 4.3% | Stable |
| Safety Events | 0 | 0 | Maintained |
| Report Completion | 6 hrs | 3 hrs | Improved |
The data suggest improved efficiency without an evident deterioration in quality or safety.
Procedure Validation
Before full implementation, the redesigned procedure should be validated.
Validation may include:
- Controlled trials.
- Pilot implementation.
- Technical review.
- Risk assessment.
- Comparison against historical data.
- Inspection sampling.
- Testing results.
- Stakeholder feedback.
Procedure Approval
The revised procedure should be approved through the organisation’s established document-control process.
Approval may involve:
- QA/QC.
- Engineering.
- Operations.
- HSE.
- Project management.
- Client representatives where required.
The required approval structure depends on the project and organisation.
Training and Competence
A redesigned procedure is only effective if personnel understand it.
Training should address:
- What changed.
- Why it changed.
- New responsibilities.
- Revised inspection sequence.
- New documentation.
- Safety controls.
- Escalation requirements.
Personnel should understand which controls remain mandatory.
Change Management
Procedure redesign represents a controlled change.
The organisation should evaluate:
- Technical impact.
- Safety impact.
- Quality impact.
- Compliance impact.
- Resource requirements.
- Training needs.
- Documentation changes.
Uncontrolled implementation can create inconsistency.
Handling Exceptions
The procedure should explain what happens when the standard workflow cannot be followed.
Examples include:
- Equipment unavailable.
- Test failure.
- Safety concern.
- Missing documentation.
- Unexpected defect.
- Calibration issue.
- Design change.
The process should define:
- Who can stop work.
- Who can approve deviation.
- How the issue is documented.
- How technical evaluation is performed.
- How work resumes.
Escalation
An efficient procedure should have clear escalation routes.
For example:
Inspector → QA/QC Engineer → QA/QC Manager → Engineering Authority
The exact structure depends on organisational arrangements.
Clear escalation prevents delays caused by uncertainty.
Avoiding Over-Inspection
Over-inspection can create unnecessary workload.
Examples include:
- Duplicate visual checks.
- Repeated document reviews.
- Excessive sampling without risk justification.
- Multiple approvals providing identical assurance.
However, reducing inspection should only occur after confirming that the activity is not required by applicable technical, contractual, regulatory, or project requirements.
Avoiding Under-Inspection
Under-inspection is equally dangerous.
Potential consequences include:
- Undetected defects.
- Reduced mechanical integrity.
- Increased failure probability.
- Increased rework after installation.
- Safety risk.
- Customer rejection.
The redesign should therefore establish a balanced inspection strategy.
Risk-Based Sampling
Where sampling is technically permissible, the sampling strategy should consider:
- Process history.
- Defect rates.
- Component criticality.
- Supplier performance.
- Failure consequences.
- Previous NCRs.
High-risk processes may require greater inspection coverage.
Integration with Continuous Improvement
Procedure redesign should not be treated as a one-time exercise.
After implementation:
Measure → Analyse → Improve → Implement → Monitor → Review
This creates a continual-improvement cycle.
Common Mistakes in Procedure Redesign
Organisations should avoid:
- Removing mandatory inspections.
- Reducing safety checks.
- Ignoring design-code requirements.
- Changing acceptance criteria without authority.
- Reducing inspection simply to meet schedule.
- Introducing unvalidated technology.
- Failing to train personnel.
- Ignoring baseline data.
- Failing to monitor post-change performance.
- Creating overly complex replacement procedures.
- Allowing informal workarounds.
Benefits of Efficient Procedure Redesign
Operational Benefits
- Reduced waiting time.
- Faster testing.
- Better workflow.
- Improved equipment utilisation.
- Reduced administrative burden.
Quality Benefits
- Fewer repeated inspections.
- Reduced rework.
- Improved consistency.
- Better traceability.
- Faster identification of defects.
Safety Benefits
- Maintained safety-critical verification.
- Better pre-test preparation.
- Reduced rushed activities.
- Improved control of testing conditions.
Reliability Benefits
- More consistent inspection.
- Better equipment verification.
- Reduced process variation.
- Improved confidence in test results.
Commercial Benefits
- Reduced project delays.
- Better resource utilisation.
- Lower rework costs.
- Improved productivity.
Recommended Procedure Redesign Framework
1. Define the Objective
Specify what needs to improve.
2. Establish the Baseline
Measure current performance.
3. Map the Workflow
Identify every activity and decision point.
4. Identify Waste
Locate unnecessary waiting, duplication and movement.
5. Identify Mandatory Controls
Protect all required technical and safety requirements.
6. Conduct Risk Assessment
Evaluate the impact of proposed changes.
7. Design the Revised Workflow
Improve sequence, responsibilities and resources.
8. Review Code and Project Requirements
Confirm continued compliance.
9. Conduct a Controlled Trial
Test the redesigned process.
10. Measure Results
Compare with baseline performance.
11. Verify Safety and Quality
Confirm no unacceptable deterioration.
12. Approve and Standardise
Update controlled documentation.
13. Train Personnel
Ensure competent implementation.
14. Monitor Effectiveness
Track KPIs and audit results.
Professional Decision-Making Questions
Before approving a redesigned inspection or testing procedure, the QA/QC professional should ask:
Does the change improve the actual bottleneck?
A change should address a verified source of delay rather than simply make another activity faster.
Are mandatory controls retained?
All required technical and safety controls must remain effective.
Is the change compliant?
Applicable design, contractual, regulatory and project requirements must be considered.
Is the process measurable?
There should be evidence demonstrating whether the redesign works.
Is the change sustainable?
The new process should be practical for routine operations.
Can the change create a new risk?
Every efficiency improvement should be evaluated for unintended consequences.
Key Takeaways
Effective redesign of mechanical inspection and testing procedures should:
- Begin with evidence-based process analysis.
- Establish current performance before changing the process.
- Map the complete inspection or testing workflow.
- Identify bottlenecks and unnecessary waiting.
- Separate value-adding activities from administrative waste.
- Preserve mandatory inspections and tests.
- Maintain safety-critical controls.
- Maintain applicable acceptance criteria.
- Consider relevant design-code requirements.
- Use risk-based inspection strategies where appropriate.
- Improve readiness before inspection.
- Improve equipment scheduling.
- Reduce duplicate documentation.
- Use digital tools appropriately.
- Improve sequencing.
- Clarify responsibilities.
- Establish clear escalation routes.
- Validate revised procedures before full implementation.
- Train affected personnel.
- Monitor quality, safety and efficiency after implementation.
- Use continual improvement to maintain performance.
Conclusion
Redesigning inspection and testing procedures is an important component of advanced mechanical QA/QC optimisation because inefficient quality processes can create unnecessary waiting, duplication, administrative workload, equipment conflicts, rework, and project delays. However, improving operational speed should never mean weakening essential quality controls, bypassing safety requirements, or reducing compliance with applicable design codes and project specifications. A competent QA/QC professional should therefore begin with process mapping and baseline performance data, identify genuine bottlenecks, distinguish necessary technical controls from unnecessary process waste, and develop improvements that increase workflow efficiency while maintaining mechanical integrity and safety.
The most effective redesigns improve the way quality assurance is delivered rather than reducing the amount of assurance required. Advance inspection scheduling, readiness checks, better test sequencing, coordinated inspection activities, digital records, improved equipment availability, clear responsibilities, and risk-based resource allocation can significantly reduce cycle time without compromising technical requirements. Any redesigned procedure should undergo appropriate risk assessment, technical review, controlled implementation, validation, and approval before becoming standard practice. Its effectiveness should then be monitored using indicators such as turnaround time, waiting time, repeat testing, NCRs, rework, equipment utilisation, safety performance, and audit findings.
Ultimately, an efficient QA/QC system is one that provides the right level of assurance at the right stage, using the right resources, without unnecessary delay or duplication. By applying structured process redesign, mechanical engineering organisations can improve productivity while preserving safety margins, equipment reliability, traceability, technical integrity, and compliance. This approach supports sustainable quality performance and ensures that operational efficiency becomes an outcome of better process design rather than a compromise to engineering standards.
4: Demonstrate Competency in Balancing Competing Project Priorities, Ensuring That Process Optimisation Strategies Fully Protect Worker Safety and Mechanical Integrity
Balancing competing project priorities is a fundamental responsibility within advanced mechanical QA/QC management because engineering projects rarely operate under a single objective. Mechanical fabrication, manufacturing, assembly, installation, inspection, and testing activities must commonly satisfy demanding requirements for safety, quality, programme, cost, productivity, reliability, compliance, and client expectations at the same time. Pressure to complete work quickly or reduce project expenditure can create situations where quality controls appear to conflict with production targets. A competent QA/QC professional must be able to evaluate these competing priorities objectively and develop optimisation strategies that improve efficiency without weakening worker safety, mechanical integrity, or required technical controls.
Process optimisation should therefore be understood as improving the way work is performed rather than simply accelerating production. A faster process is not necessarily a better process if it creates increased defect rates, unsafe working conditions, equipment deterioration, rework, or long-term reliability problems. Similarly, reducing inspection time may appear commercially beneficial but can create greater costs if defects remain undetected until later stages. Effective optimisation seeks to identify the root causes of delay and waste, remove unnecessary activities, improve workflow, allocate resources intelligently, and strengthen process control while retaining all safety-critical and quality-critical requirements.
For advanced mechanical QA/QC professionals, balancing competing priorities requires professional judgement supported by objective evidence. Decisions should consider risk, consequence, technical requirements, historical performance, inspection findings, equipment reliability, workforce competence, project constraints, and the potential effect of changes on the complete lifecycle of the mechanical asset. This approach ensures that project efficiency does not become isolated from engineering integrity. Instead, safety, quality, reliability, cost, and programme performance are treated as interconnected objectives that must be managed through a controlled and risk-based decision-making process.
Understanding Competing Project Priorities
Mechanical engineering projects commonly involve several competing priorities.
These may include:
- Worker safety.
- Mechanical integrity.
- Quality.
- Project schedule.
- Cost control.
- Productivity.
- Equipment availability.
- Material availability.
- Inspection requirements.
- Testing requirements.
- Customer expectations.
- Regulatory compliance.
- Reliability.
- Maintainability.
- Documentation and traceability.
A decision that improves one priority can sometimes negatively influence another.
For example:
Reducing inspection duration → Faster production → Potentially less verification
or:
Increasing production speed → Higher output → Potentially increased equipment wear
The professional objective is to identify solutions that improve overall project performance without creating unacceptable risk.
Key Definitions and Concepts
| Term | Definition | Mechanical QA/QC Application |
|---|---|---|
| Project Priority | Objective requiring attention during project delivery | Safety, quality, cost or programme |
| Process Optimisation | Improvement of a process to increase effectiveness and efficiency | Reducing testing delays without reducing required controls |
| Mechanical Integrity | Ability of mechanical equipment and components to remain safe and functional | Maintaining strength, containment and reliability |
| Worker Safety | Protection of personnel from workplace hazards | Safe fabrication, lifting, testing and inspection |
| Risk | Effect of uncertainty on intended outcomes | Potential consequences of changing fabrication parameters |
| Risk Tolerance | Level of risk an organisation is prepared to accept | Determining acceptable operational conditions |
| Safety-Critical Control | Control essential for preventing serious harm or failure | Pressure-test protection or equipment isolation |
| Quality Requirement | Defined characteristic or condition that must be achieved | Dimensional, material or welding requirements |
| Trade-Off | Decision involving competing objectives | Balancing schedule pressure with inspection requirements |
| Residual Risk | Risk remaining after controls are implemented | Remaining risk following engineering controls |
| Escalation | Process for referring significant issues to higher authority | Reporting unacceptable safety or integrity risks |
| Decision Criteria | Factors used to evaluate possible actions | Safety, quality, cost, time and reliability |
| Change Control | Formal process for managing changes | Reviewing revised inspection or fabrication methods |
| Competence | Ability to perform duties effectively using appropriate knowledge and skills | Professional QA/QC judgement |
| Reliability | Ability of equipment to perform its intended function consistently | Long-term performance of mechanical equipment |
| Continuous Improvement | Structured effort to improve processes over time | Reducing rework while maintaining technical controls |
Safety as a Fundamental Priority
Worker safety should remain a fundamental consideration when optimising mechanical processes.
Mechanical engineering activities may involve:
- Heavy components.
- Rotating machinery.
- Pressure systems.
- Hot work.
- Welding.
- Cutting.
- Grinding.
- Lifting operations.
- Stored energy.
- Hazardous environments.
- High temperatures.
- Mechanical movement.
An efficiency improvement should never depend on workers accepting unnecessary exposure to these hazards.
Mechanical Integrity as a Core Priority
Mechanical integrity concerns the ability of equipment and components to perform their intended functions safely and reliably.
Important characteristics may include:
- Material integrity.
- Weld quality.
- Dimensional accuracy.
- Structural strength.
- Pressure containment.
- Alignment.
- Fastener integrity.
- Surface condition.
- Corrosion resistance.
- Fatigue resistance.
- Functional performance.
A process optimisation that damages any critical characteristic may create unacceptable long-term consequences.
Relationship Between Safety and Quality
Safety and quality are often closely connected.
For example:
Poor fabrication control → Defect → Reduced mechanical integrity → Equipment failure → Safety risk
Therefore, preventing defects can also contribute to worker safety.
Similarly:
Unsafe working condition → Rushed work → Increased error → Quality defect
This demonstrates why safety and quality should not be treated as completely separate objectives.
Balancing Safety, Quality, Cost and Schedule
A useful decision-making framework considers four major dimensions:
Safety
Could the change increase risk to personnel?
Quality
Could the change affect conformity?
Cost
Could the change reduce or increase project expenditure?
Schedule
Could the change improve or delay project completion?
The objective is not to give every factor equal weight in every situation. Critical safety and mechanical-integrity risks may require priority over cost or schedule.
The Hierarchy of Priorities
When competing objectives conflict, a practical hierarchy can be applied:
- Protect life and health.
- Protect mechanical and structural integrity.
- Maintain mandatory compliance.
- Maintain required quality.
- Control project schedule.
- Optimise cost and productivity.
This does not mean cost and schedule are unimportant. It means they should not be improved by creating unacceptable safety or integrity risks.
Understanding Risk-Based Decision-Making
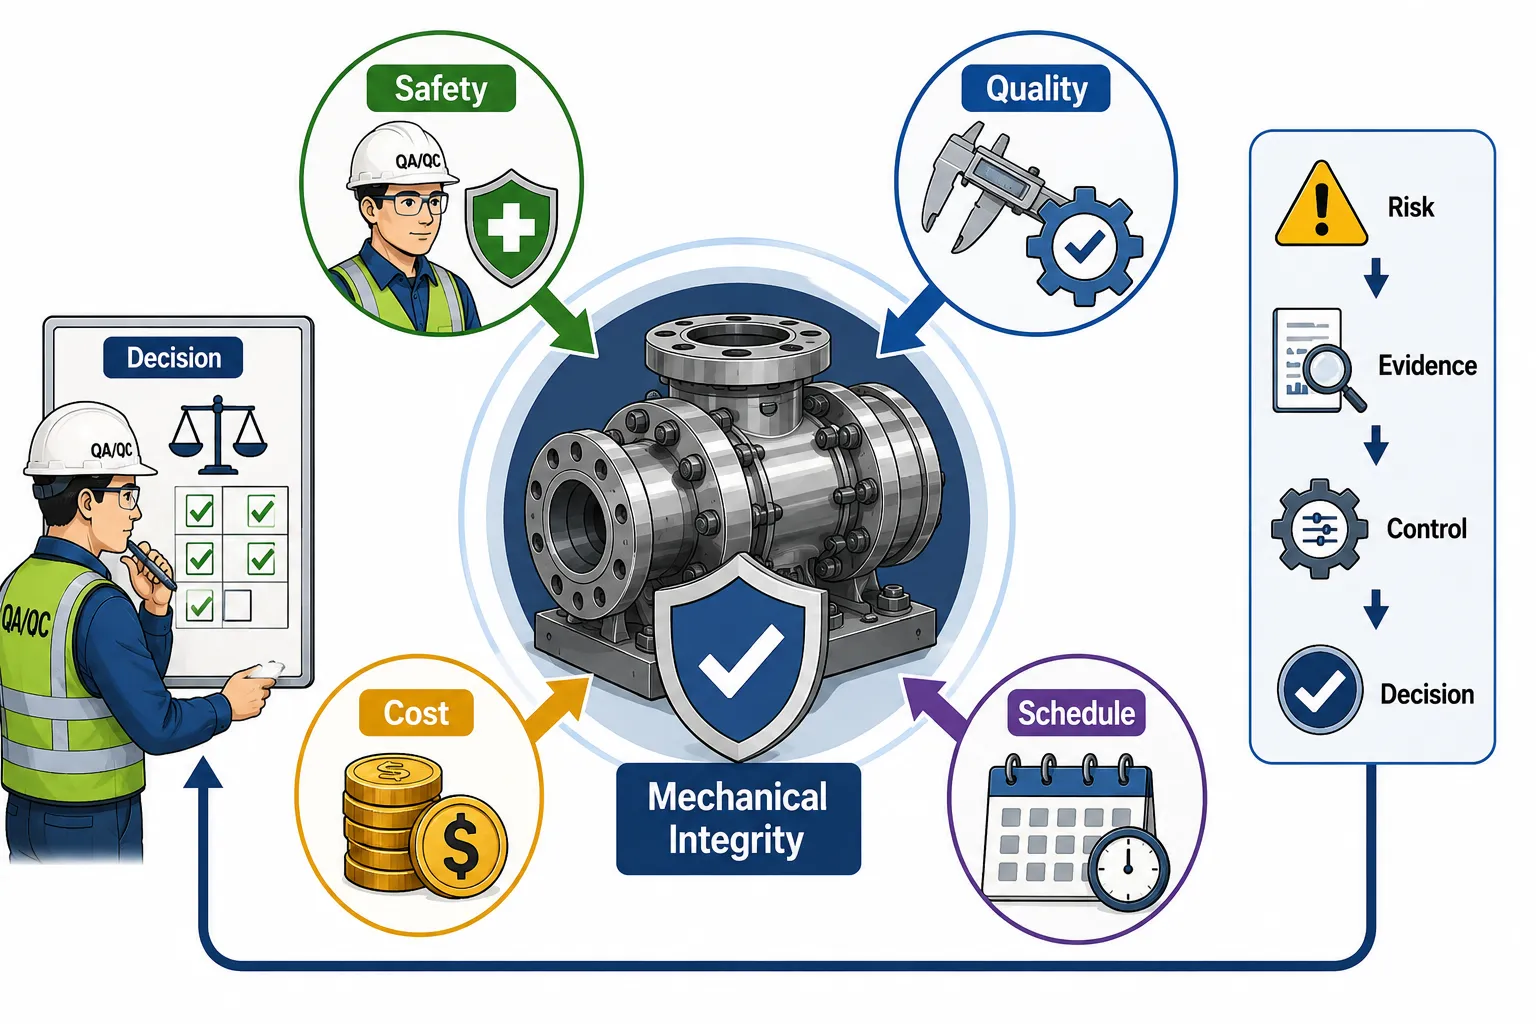
Risk-based decision-making involves identifying possible hazards or failures and determining their significance.
A simplified approach is:
Risk = Likelihood × Consequence
The evaluation may also consider:
- Exposure.
- Detectability.
- Existing controls.
- Failure history.
- Equipment criticality.
- Uncertainty.
A low-cost process change may not be appropriate if it introduces a high-consequence failure mode.
Identifying Competing Priorities
Before making an optimisation decision, identify:
- What is the project trying to achieve?
- What is causing the current inefficiency?
- What constraints exist?
- What controls must remain?
- What could fail?
- Who could be affected?
- What are the consequences?
- What alternative solutions exist?
This prevents decisions being made solely from production pressure.
Example: Schedule Pressure Versus Inspection
A project is behind schedule and management requests that final inspection be shortened.
The QA/QC professional should not simply remove inspection activities.
Instead, potential alternatives include:
- Improve inspection readiness.
- Schedule inspectors earlier.
- Remove duplicated documentation.
- Combine compatible inspection activities.
- Use digital records.
- Prioritise high-risk inspections.
- Improve communication.
This improves schedule performance without weakening necessary verification.
Example: Cost Reduction Versus Equipment Reliability
A project proposes reducing preventive inspection frequency to reduce costs.
The QA/QC professional should evaluate:
- Equipment criticality.
- Failure history.
- Manufacturer requirements.
- Previous inspection findings.
- Consequence of failure.
- Current equipment condition.
If reduced inspection increases the likelihood of undetected deterioration, the proposed saving may create greater lifecycle costs.
Example: Production Speed Versus Worker Safety
A fabrication workshop proposes increasing cutting speed to improve output.
The evaluation should consider:
- Machine capability.
- Tool condition.
- Heat generation.
- Material behaviour.
- Operator exposure.
- Equipment stability.
- Quality effects.
A higher production rate is acceptable only if the process remains within controlled operating conditions.
Example: Rework Versus Schedule
A fabricated component fails dimensional inspection near project completion.
Management proposes accepting the component to avoid schedule delay.
The professional response should evaluate:
- Applicable acceptance criteria.
- Mechanical function.
- Safety implications.
- Design tolerance.
- Engineering assessment.
- Customer requirements.
Schedule pressure should not automatically justify accepting a non-conforming component.
Balancing Priorities Through Process Optimisation
The most effective optimisation strategies often improve several priorities simultaneously.
For example:
Better inspection planning → Less waiting → Faster production → Lower rework → Lower cost → Maintained quality
This is more sustainable than simply reducing inspection.
Process Optimisation Framework
Stage 1: Identify the Problem
Define the actual source of inefficiency.
Stage 2: Establish the Baseline
Measure:
- Current cycle time.
- Defect rates.
- Rework.
- Safety performance.
- Equipment reliability.
Stage 3: Identify Constraints
Determine:
- Resource limitations.
- Equipment limitations.
- Technical requirements.
- Workforce capability.
- Schedule constraints.
Stage 4: Assess Risks
Identify possible consequences of proposed changes.
Stage 5: Develop Alternatives
Create several possible improvement options.
Stage 6: Compare Options
Evaluate each option against:
- Safety.
- Quality.
- Integrity.
- Cost.
- Schedule.
- Reliability.
Stage 7: Select the Best Controlled Option
Choose the option that provides the strongest overall outcome.
Stage 8: Implement Under Change Control
Introduce the change in a controlled manner.
Stage 9: Monitor Performance
Measure whether the intended improvement occurred.
Stage 10: Verify Safety and Integrity
Confirm that no unacceptable risk has been introduced.
Decision Matrix for Competing Priorities
A decision matrix can support professional judgement.
| Option | Safety | Quality | Integrity | Cost | Schedule | Overall Assessment |
|---|---|---|---|---|---|---|
| Reduce inspection | Low | Low | Low | High | High | Unsuitable |
| Improve readiness | High | High | High | Medium | High | Strong |
| Add personnel | High | High | High | Low | High | Suitable if resources allow |
| Digitise records | High | High | High | Medium | High | Strong |
| Remove approvals | Medium | Low | Low | High | High | High risk |
The ratings should be supported by evidence rather than personal preference.
Worker Safety During Optimisation
Process optimisation should consider how changes affect workers.
Potential impacts include:
- Increased work pace.
- Additional manual handling.
- Increased equipment exposure.
- Increased fatigue.
- Reduced rest periods.
- Increased simultaneous activities.
- Changes in work positioning.
- Changes in access arrangements.
A process that improves output but increases worker exposure may not represent genuine optimisation.
Human Factors
Human performance can influence both safety and quality.
Relevant factors include:
- Competence.
- Fatigue.
- Workload.
- Communication.
- Procedure clarity.
- Supervision.
- Experience.
- Work environment.
When redesigning processes, the professional should consider whether the new process is practical for the people who must perform it.
Competence and Training
An optimisation may introduce:
- New equipment.
- New software.
- Revised procedures.
- New inspection techniques.
- Changed responsibilities.
Personnel should be appropriately competent before implementing the change.
Training may address:
- Revised process requirements.
- Safety controls.
- Inspection methods.
- Data recording.
- Escalation requirements.
- Emergency arrangements.
Maintaining Mechanical Integrity During Optimisation
Mechanical integrity should be protected through:
- Defined design requirements.
- Controlled materials.
- Approved fabrication procedures.
- Appropriate inspection.
- Required testing.
- Dimensional control.
- Traceability.
- Equipment calibration.
- Technical review.
Efficiency should be achieved around these controls rather than by weakening them.
Critical Characteristics
Some characteristics require greater attention because their failure could have serious consequences.
Examples include:
- Pressure containment.
- Structural dimensions.
- Critical welds.
- Safety-related fasteners.
- Rotating equipment alignment.
- Critical material properties.
- Pressure-test results.
The optimisation strategy should reflect the significance of these characteristics.
Risk-Based Resource Allocation
Resources should not necessarily be distributed equally.
Higher-risk activities may require:
- More experienced personnel.
- More inspection.
- Additional verification.
- Greater documentation.
- Increased monitoring.
Lower-risk activities may be suitable for:
- Sampling.
- Surveillance.
- Simplified workflows.
This helps maximise the value of available QA/QC resources.
Safety Margins During Process Optimisation
Safety margins should be clearly identified before process changes are made.
The team should determine:
- What limits are defined?
- Which limits are mandatory?
- Which parameters have safety significance?
- What assumptions were used in the design?
- What could reduce the margin?
- What additional verification is required?
An efficiency improvement should not consume safety margin without formal technical justification.
Change Control
Any significant optimisation should be controlled.
A change-control process may include:
- Change proposal.
- Technical assessment.
- Risk assessment.
- QA/QC review.
- Safety review.
- Engineering review.
- Approval.
- Trial implementation.
- Verification.
- Documentation update.
Temporary Versus Permanent Changes
A temporary optimisation should not become an uncontrolled permanent practice.
Temporary arrangements should have:
- Defined duration.
- Defined scope.
- Responsible owner.
- Applicable controls.
- Review date.
- Closure criteria.
Managing Deviations
Unexpected deviations may occur during project execution.
Examples include:
- Equipment failure.
- Material shortage.
- Unexpected defect.
- Design change.
- Inspection delay.
- Testing failure.
A professional should determine whether the proposed response:
- Protects safety.
- Maintains mechanical integrity.
- Meets technical requirements.
- Is formally approved.
Escalating Unacceptable Risk
A QA/QC professional should escalate a situation when:
- Safety controls are being bypassed.
- Mechanical integrity is uncertain.
- Required inspection cannot be completed.
- Testing cannot demonstrate conformity.
- A significant deviation is proposed without technical justification.
- Schedule pressure is driving unsafe decisions.
Escalation protects both the project and the organisation.
Stop-Work Considerations
Where defined procedures allow, work may need to be stopped when an immediate or significant risk exists.
Potential triggers include:
- Unsafe testing conditions.
- Critical equipment defect.
- Loss of containment.
- Uncontrolled fabrication deviation.
- Use of unsuitable equipment.
- Failure of critical safety controls.
The priority should be controlling the hazard before production resumes.
Communicating Competing Priorities
Effective communication is essential when priorities conflict.
The QA/QC professional should communicate:
- The technical issue.
- Evidence.
- Risk.
- Potential consequences.
- Available options.
- Recommended action.
- Required approval.
This makes the decision transparent.
Evidence-Based Decision-Making
Decisions should be supported by:
- Inspection records.
- Test results.
- NCR trends.
- Equipment data.
- Risk assessments.
- Historical performance.
- Engineering calculations where applicable.
- Manufacturer information.
- Approved specifications.
Evidence helps prevent decisions being driven solely by project pressure.
Practical Example: Pressure Test Delay
Situation
A pressure test is delayed because the required inspector is unavailable.
Project Pressure
The project team wants to proceed without the inspector.
QA/QC Assessment
The professional reviews:
- Applicable inspection requirements.
- Test criticality.
- Client requirements.
- Existing approval arrangements.
Alternative Solutions
Instead of bypassing the required control:
- Arrange an authorised alternative inspector.
- Reschedule within the available window.
- Improve future inspection notification.
- Prepare all documentation in advance.
Outcome
The project delay is minimised without compromising required verification.
Practical Example: Welding Rework
Situation
A fabrication team experiences repeated weld repairs.
Competing Priorities
- Production wants faster welding.
- QA/QC wants fewer defects.
- Management wants lower cost.
Analysis
Increasing welding speed may worsen quality.
The team instead investigates:
- Welding parameters.
- Preparation.
- Welder competence.
- Consumable condition.
- Inspection findings.
Improvement
The root cause is addressed.
Outcome
Rework decreases while production efficiency improves.
Practical Example: Rotating Equipment Alignment
Situation
A project is under schedule pressure and proposes reducing alignment checks.
Risk
Poor alignment may contribute to:
- Vibration.
- Bearing wear.
- Seal failure.
- Premature equipment downtime.
Decision
The alignment control is retained.
Efficiency is improved through:
- Better pre-alignment preparation.
- Improved measurement equipment availability.
- Clearer sequencing.
- Early identification of dimensional issues.
Practical Example: Inspection Resource Shortage
Situation
There are insufficient inspectors to cover every activity simultaneously.
Incorrect Response
Remove critical inspections.
Better Response
Use risk-based prioritisation.
High-criticality activities receive appropriate coverage while lower-risk activities may use approved surveillance or sampling arrangements where technically permissible.
Practical Example: Reducing Test Turnaround
Situation
Mechanical testing takes too long.
Analysis
Data show that actual test execution represents only 30% of total cycle time.
The remaining time is associated with:
- Waiting.
- Documentation.
- Equipment allocation.
- Approval.
Optimisation
The team improves workflow rather than shortening the technical test.
Result
Turnaround improves without reducing the technical test requirements.
Case Study: Balancing Schedule, Safety and Mechanical Integrity
Project Background
A large mechanical installation project is approaching a contractual completion date. Several critical mechanical assemblies require final inspection and testing.
The project team identifies a significant schedule risk because inspection requests have accumulated.
Initial Proposal
Management proposes reducing inspection coverage to accelerate completion.
QA/QC Evaluation
The QA/QC team reviews:
- Critical equipment.
- Inspection requirements.
- Applicable project specifications.
- Previous NCRs.
- Equipment failure history.
- Outstanding documentation.
The review identifies that several inspections are mandatory or technically important.
Alternative Strategy
Instead of reducing critical inspection, the team:
- Improves inspection scheduling.
- Prioritises critical equipment.
- Completes documentation before inspection.
- Increases coordination between production and QA/QC.
- Combines compatible inspection activities.
- Uses available competent inspection personnel more effectively.
- Introduces controlled digital record submission.
Safety Review
Safety-critical controls remain unchanged.
Mechanical Integrity Review
Critical dimensions, weld quality, material traceability, alignment and required testing remain subject to defined verification.
Results
The revised approach reduces waiting time while maintaining required assurance.
Lesson Learned
The project demonstrates that competing priorities can often be reconciled through better process design rather than reducing technical controls.
Measuring the Success of Optimisation
An optimisation should be evaluated using balanced performance indicators.
Efficiency Indicators
- Cycle time.
- Waiting time.
- Throughput.
- Resource utilisation.
- Inspection turnaround.
Quality Indicators
- NCR frequency.
- Defect rate.
- Rework.
- First-pass acceptance.
- Repeat testing.
Safety Indicators
- Incidents.
- Near misses.
- Safety observations.
- Unsafe-condition reports.
Reliability Indicators
- Equipment failures.
- Maintenance frequency.
- Vibration trends.
- Leakage.
- Premature component replacement.
Balanced Scorecard Approach
| Performance Area | Example KPI | Desired Outcome |
|---|---|---|
| Safety | Safety events | No deterioration |
| Quality | NCR rate | Reduction |
| Efficiency | Inspection cycle time | Reduction |
| Reliability | Equipment failures | Reduction |
| Compliance | Audit findings | Reduction |
| Rework | Repeat work rate | Reduction |
| Documentation | Report completion time | Reduction |
The objective is balanced improvement rather than maximising one indicator at the expense of others.
Leading and Lagging Indicators
Leading Indicators
These can indicate future performance.
Examples include:
- Inspection readiness.
- Training completion.
- Calibration status.
- Preventive maintenance.
- Procedure compliance.
- Risk assessment completion.
Lagging Indicators
These demonstrate results after events occur.
Examples include:
- Equipment failures.
- NCRs.
- Rework.
- Incidents.
- Customer complaints.
Both categories should be considered.
Avoiding False Efficiency
False efficiency occurs when a process appears faster but creates greater downstream problems.
Examples include:
Fewer inspections → More defects
Faster welding → More rework
Shorter testing → Less reliable evidence
Reduced maintenance → More downtime
Reduced documentation → Poorer traceability
A professional should assess the complete lifecycle effect.
Total Cost of Poor Quality
Quality-related costs can include:
- Rework.
- Scrap.
- Retesting.
- Inspection repetition.
- Delays.
- Equipment failure.
- Warranty claims.
- Customer rejection.
- Emergency maintenance.
A small short-term saving can therefore create much larger long-term costs.
Lifecycle Thinking
Mechanical QA/QC decisions should consider the lifecycle of the equipment.
The stages may include:
Design → Procurement → Fabrication → Installation → Commissioning → Operation → Maintenance
A fabrication decision that saves time today may increase maintenance requirements later.
Therefore, optimisation should consider both immediate and future consequences.
Reliability-Centred Thinking
Reliability-focused decisions ask:
- What function must the equipment perform?
- What can cause failure?
- What are the consequences?
- How can failure be prevented?
- How can deterioration be detected?
This supports better process decisions.
Professional Judgement
Competent decision-making requires the ability to balance:
- Evidence.
- Standards.
- Risk.
- Engineering principles.
- Practical constraints.
- Human factors.
- Commercial considerations.
Professional judgement does not mean ignoring requirements. It means applying technical knowledge appropriately within defined authority and controls.
Common Mistakes in Balancing Project Priorities
Organisations should avoid:
- Treating schedule as more important than safety.
- Removing inspections solely to reduce delays.
- Accepting defects without technical justification.
- Using uncalibrated equipment to save time.
- Ignoring worker fatigue.
- Reducing maintenance without reliability assessment.
- Changing critical parameters informally.
- Failing to communicate risks.
- Treating short-term cost savings as overall optimisation.
- Ignoring lifecycle consequences.
Benefits of Balanced Process Optimisation
Worker Safety Benefits
- Reduced exposure to hazards.
- Better process planning.
- Reduced rushed work.
- Improved competence.
- Stronger safety controls.
Mechanical Integrity Benefits
- Improved component quality.
- Reduced fabrication defects.
- Better inspection coverage.
- Improved reliability.
Quality Benefits
- Reduced NCRs.
- Reduced rework.
- Improved conformity.
- Better traceability.
Efficiency Benefits
- Reduced waiting.
- Better resource allocation.
- Improved workflow.
- Reduced unnecessary administrative activity.
Commercial Benefits
- Lower rework costs.
- Reduced delays.
- Improved productivity.
- Better asset performance.
Recommended Professional Decision Process
Step 1: Define the Competing Objectives
Identify safety, quality, cost, programme and reliability priorities.
Step 2: Establish Evidence
Collect relevant performance information.
Step 3: Identify Critical Controls
Determine which controls cannot be compromised.
Step 4: Assess Risks
Evaluate potential consequences of each option.
Step 5: Develop Alternatives
Look for solutions that improve several objectives simultaneously.
Step 6: Compare Options
Use a structured decision matrix.
Step 7: Obtain Appropriate Approval
Escalate significant technical or safety decisions.
Step 8: Implement Under Change Control
Ensure controlled execution.
Step 9: Monitor Results
Track balanced KPIs.
Step 10: Verify Effectiveness
Confirm that efficiency improved without deterioration in safety or integrity.
Key Takeaways
Effective balancing of project priorities requires:
- Treating worker safety as a fundamental priority.
- Protecting mechanical integrity.
- Maintaining applicable technical requirements.
- Understanding project schedule and cost pressures.
- Using evidence-based decision-making.
- Applying risk-based prioritisation.
- Identifying critical controls.
- Avoiding false efficiency.
- Considering lifecycle consequences.
- Using process optimisation rather than control reduction.
- Maintaining competent personnel.
- Managing changes formally.
- Communicating risks clearly.
- Escalating unacceptable risks.
- Monitoring safety, quality, efficiency and reliability together.
- Verifying optimisation effectiveness after implementation.
Conclusion
Demonstrating competency in balancing competing project priorities requires more than choosing between safety, quality, cost, and schedule. A competent mechanical QA/QC professional must understand how these priorities interact and identify solutions that improve overall project performance without transferring risk from one area to another. Schedule pressure should not be resolved by removing essential inspections, cost pressure should not justify unacceptable reductions in maintenance or quality control, and productivity improvements should not depend on workers accepting increased exposure to hazards. Instead, professional optimisation should focus on improving workflow, eliminating duplication, strengthening readiness, improving resource allocation, applying risk-based inspection, and using reliable performance data.
Worker safety and mechanical integrity should remain protected throughout the optimisation process. This requires clear identification of safety-critical controls, critical mechanical characteristics, applicable technical requirements, and potential failure modes. Proposed changes should be assessed through formal change control, risk assessment, technical review, and appropriate approval. Where competing priorities create significant risk, the issue should be escalated rather than resolved through an informal compromise. Effective communication is essential because engineering, production, QA/QC, HSE, maintenance, and project management teams may view the same situation from different perspectives.
Ultimately, successful QA/QC optimisation is achieved when efficiency improvements produce sustainable benefits without weakening the controls that protect people, equipment, quality, and reliability. By using balanced performance indicators, professional judgement, risk-based decision-making, lifecycle thinking, and continual improvement, mechanical engineering organisations can reduce delays and costs while maintaining high standards of safety and mechanical integrity. This approach creates a resilient QA/QC management system in which productivity and quality support each other rather than becoming competing objectives.