
Lesson 3: Analyse test data to identify defects, safety risks, or non-compliance issues.
Accurate interpretation of mechanical testing data is essential for determining whether components, assemblies, and operational systems meet specified quality, safety, and performance requirements. Test results provide evidence about the actual condition of mechanical equipment, but their value depends on how effectively the data are reviewed, compared, interpreted, and connected to engineering requirements. Analysing mechanical test data involves examining dimensional measurements, NDT indications, material test results, functional performance data, inspection findings, calibration records, and historical trends to identify defects, emerging safety risks, abnormal conditions, and potential non-compliance. A structured approach enables QA/QC professionals to move beyond simply recording test results and make technically defensible engineering decisions.
Mechanical defects can range from dimensional deviations and surface damage to cracks, porosity, lack of fusion, excessive wear, abnormal vibration, material-property variations, and other conditions that may affect mechanical integrity. Not every indication represents a defect, and not every deviation has the same level of significance. Effective analysis therefore requires comparison with approved drawings, specifications, tolerances, acceptance criteria, testing procedures, and relevant engineering requirements. The location, size, orientation, frequency, severity, and potential consequences of an indication should be considered alongside the operating conditions and criticality of the component. This evidence-based approach helps distinguish acceptable variations from conditions requiring further investigation, repair, replacement, or controlled engineering assessment.
Systematic mechanical test-data analysis also supports safety management, asset reliability, quality improvement, and regulatory compliance. By identifying recurring defects and analysing trends across components, production batches, inspection periods, or operating cycles, organisations can recognise systemic weaknesses rather than treating individual failures as isolated events. Data analysis can reveal process instability, ineffective controls, equipment deterioration, inadequate maintenance practices, or weaknesses in inspection procedures. Early identification of these patterns enables corrective and preventive actions to be implemented before defects develop into serious equipment failures, unplanned downtime, or safety incidents. Consequently, effective analysis of mechanical testing data strengthens quality assurance, improves mechanical integrity, supports risk-based decision-making, and contributes to long-term operational reliability and performance excellence.
1: Analyse Complex Test Reports, Material Stress Charts, and Sensor Readings to Locate Deep Subsurface Defects or Hidden Component Weaknesses
Analysing complex mechanical test data is a critical engineering activity because many significant component weaknesses cannot be identified through visual examination alone. A mechanical component may appear clean, correctly assembled, and dimensionally acceptable while containing internal discontinuities, material degradation, fatigue damage, residual stress, or other hidden conditions that could affect its structural integrity. Test reports, material stress charts, sensor readings, and historical inspection records provide different forms of evidence that can be combined to develop a more complete understanding of component condition. A competent QA/QC professional must therefore be able to interpret technical data systematically, distinguish meaningful indications from measurement variation, and determine whether further investigation or corrective action is required.
The objective is not simply to identify an unusual reading. Engineering data must be interpreted in relation to the component’s material, geometry, loading conditions, manufacturing history, operating environment, design requirements, and applicable acceptance criteria. A single abnormal sensor value may have several possible explanations, while a consistent pattern across multiple measurements may provide stronger evidence of an underlying defect. Similarly, an ultrasonic indication should not automatically be classified as an unacceptable defect without considering its location, characteristics, orientation, size, inspection sensitivity, and applicable acceptance requirements.
Complex data analysis therefore requires engineering judgement supported by documented evidence. When test reports, stress charts, sensor readings, NDT results, dimensional measurements, and historical trends are evaluated together, QA/QC teams can identify hidden weaknesses more reliably. This supports safer acceptance decisions, improved mechanical integrity, earlier intervention, reduced equipment failure, and more effective quality management.

Understanding Hidden Mechanical Defects and Component Weaknesses
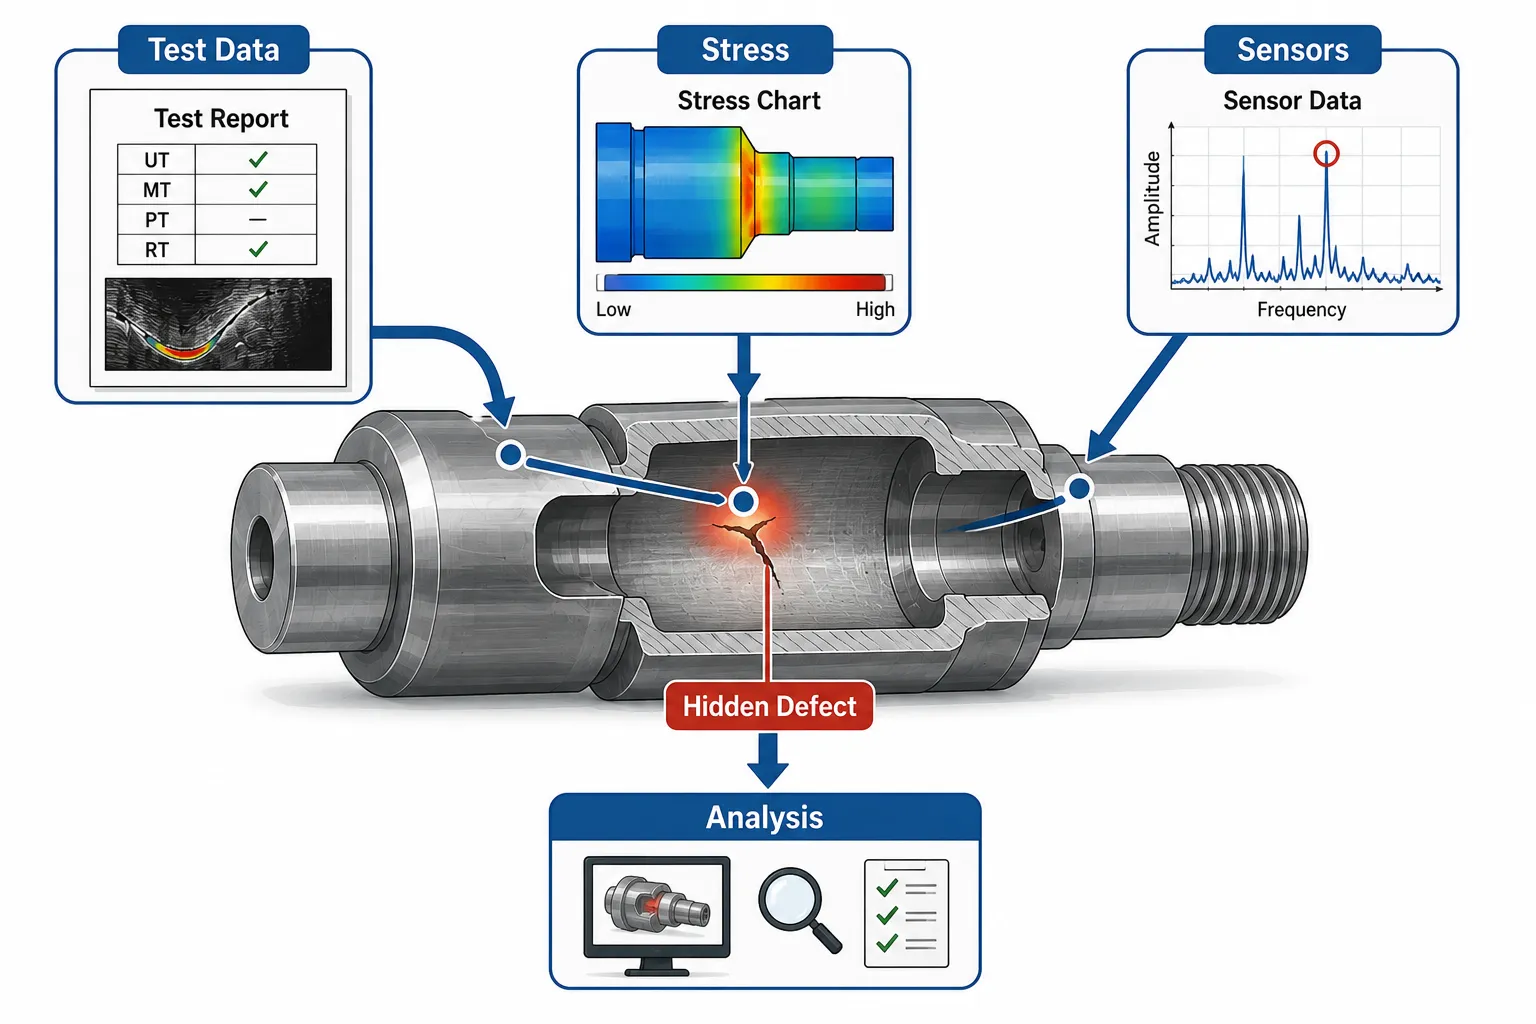
A hidden mechanical weakness is a condition that may not be readily visible during routine external examination but has the potential to reduce component performance, reliability, or structural integrity.
Examples include:
- Internal cracks.
- Subsurface inclusions.
- Internal porosity.
- Lack of fusion within welds.
- Incomplete penetration.
- Internal voids.
- Laminations.
- Subsurface corrosion.
- Fatigue damage.
- Internal material degradation.
- Residual stress concentrations.
- Localised wall thinning.
- Internal geometric discontinuities.
- Microstructural changes.
- Progressive deterioration indicated by sensor trends.
The significance of such conditions depends on several factors.
These include:
- Component function.
- Material type.
- Component thickness.
- Operating stress.
- Defect location.
- Defect orientation.
- Defect dimensions.
- Loading frequency.
- Operating temperature.
- Pressure conditions.
- Failure consequences.
- Applicable acceptance criteria.
Key Definitions and Concepts
| Term | Definition | Application in Mechanical QA/QC |
|---|---|---|
| Subsurface Defect | A discontinuity located below the accessible surface | Internal crack in a forged shaft |
| Internal Discontinuity | An interruption or imperfection within material volume | Porosity or inclusion |
| Stress Chart | Data showing stress behaviour or distribution under defined conditions | Assessing high-stress regions |
| Sensor Reading | Measurement produced by an instrument or monitoring system | Vibration or temperature data |
| NDT Indication | Observable response produced during non-destructive examination | Ultrasonic signal |
| Defect | A discontinuity that exceeds applicable acceptance requirements | Unacceptable weld indication |
| Material Weakness | Condition reducing expected material performance | Degradation or localised damage |
| Trend | Pattern in measurements over time | Increasing vibration |
| Baseline | Established reference condition for comparison | Initial equipment vibration |
| Anomaly | Measurement or pattern that differs from expected behaviour | Unexpected temperature increase |
| Signal | Instrument response representing a physical condition | Ultrasonic echo |
| Measurement Uncertainty | Quantified limitation associated with a measurement result | Evaluating borderline readings |
| Acceptance Criteria | Defined limits used to determine conformity | Engineering inspection limits |
| Correlation | Relationship between different data sources | Vibration increase with bearing wear |
| Root Cause | Fundamental reason responsible for an observed condition | Manufacturing process weakness |
Why Test Data Analysis Matters
Mechanical test data provide objective evidence that supports engineering decisions.
Effective analysis can help to:
- Identify hidden defects.
- Detect developing deterioration.
- Locate areas requiring further examination.
- Verify component conformity.
- Identify abnormal operating conditions.
- Support risk assessment.
- Prevent unexpected mechanical failure.
- Reduce unnecessary component replacement.
- Identify recurring manufacturing problems.
- Improve maintenance decisions.
Without systematic analysis, important information can remain hidden within large volumes of inspection records.
Types of Data Used in Mechanical Defect Analysis
A comprehensive assessment may involve several forms of information.
NDT Data
NDT reports may include:
- Ultrasonic signal responses.
- Radiographic images.
- Magnetic particle indications.
- Penetrant indications.
- Eddy current responses.
- Thickness measurements.
- Inspection locations.
- Indication dimensions.
Material Test Data
Material-related data may include:
- Tensile strength.
- Yield strength.
- Elongation.
- Hardness.
- Impact toughness.
- Chemical composition where relevant.
- Metallurgical observations.
Mechanical Performance Data
Operational data may include:
- Vibration.
- Temperature.
- Pressure.
- Rotational speed.
- Torque.
- Load.
- Flow.
- Displacement.
Dimensional Data
Dimensional inspection may provide:
- Diameter.
- Thickness.
- Flatness.
- Runout.
- Alignment.
- Clearance.
- Surface profile.
- Geometric variation.
Historical Data
Historical information can include:
- Previous inspection reports.
- Previous NDT results.
- Repair records.
- Failure history.
- Maintenance records.
- Previous sensor readings.
- Production batch data.
Understanding Subsurface Defects
Subsurface defects can be particularly difficult to evaluate because they may not produce visible surface evidence.
For example, a steel shaft may appear visually sound while containing an internal discontinuity caused during forging.
Potential concerns include:
- Reduced fatigue resistance.
- Crack propagation.
- Local stress concentration.
- Reduced load-bearing capacity.
- Unexpected fracture.
This is why appropriate volumetric examination and data interpretation can be critical for safety-significant mechanical components.
Interpreting Ultrasonic Test Data
Ultrasonic Testing can provide valuable information about suitable internal conditions.
An ultrasonic report may contain:
- Probe information.
- Examination area.
- Reference settings.
- Signal responses.
- Signal amplitude.
- Signal location.
- Depth information.
- Scanning direction.
- Indication dimensions.
- Acceptance assessment.
The QA/QC engineer should not simply look for the largest signal.
The analysis should consider:
- Signal location.
- Signal consistency.
- Signal amplitude.
- Signal shape.
- Signal movement.
- Defect orientation.
- Component geometry.
- Reference response.
- Applicable acceptance criteria.
Interpreting Radiographic Data
Radiographic examination may reveal suitable internal volumetric features through image contrast.
Potential indications include:
- Porosity.
- Slag-related discontinuities.
- Voids.
- Incomplete penetration.
- Other density variations.
Interpretation should consider:
- Image quality.
- Component thickness.
- Indication location.
- Indication size.
- Indication distribution.
- Applicable acceptance requirements.
Interpreting Magnetic Particle Results
Magnetic Particle Testing can identify suitable surface and near-surface indications in ferromagnetic materials.
A relevant indication may appear as a concentrated particle pattern.
The engineer should consider:
- Location.
- Shape.
- Direction.
- Length.
- Distribution.
- Relationship with stress concentrations.
- Applicable acceptance criteria.
A linear indication near a keyway or weld toe may require particular attention because of its relationship to stress concentration and potential fatigue behaviour.
Interpreting Liquid Penetrant Results
Penetrant testing may reveal surface-breaking discontinuities through visible or fluorescent indications.
Analysis should consider:
- Indication shape.
- Length.
- Location.
- Repetition.
- Alignment.
- Surface condition.
- Relevant acceptance requirements.
A linear indication in a highly stressed area may have greater significance than an isolated irrelevant indication in a low-risk area.
Material Stress Charts
Material stress charts provide information about how mechanical loads are distributed or how a material responds under specified conditions.
They may help identify:
- High-stress regions.
- Stress concentration areas.
- Load paths.
- Stress gradients.
- Regions approaching design limits.
- Areas requiring additional inspection attention.
Stress information should be interpreted alongside actual component geometry and operating conditions.
Relationship Between Stress and Hidden Defects
A defect does not have equal significance everywhere.
A small internal discontinuity in a low-stress region may present a different risk from a similarly sized discontinuity located at a critical stress concentration.
The engineer should therefore evaluate:
Defect characteristics + location + stress + material + loading + consequence
This provides a stronger technical basis for assessing significance.
Stress Concentrations
Stress concentrations can occur around:
- Holes.
- Keyways.
- Threads.
- Weld toes.
- Weld roots.
- Sharp corners.
- Grooves.
- Shaft shoulders.
- Sudden section changes.
- Machined notches.
These locations should receive particular attention when analysing test results.
Sensor Readings as Evidence of Hidden Weakness
Sensors can provide information about equipment condition that may not be visible externally.
Common measurements include:
- Vibration.
- Temperature.
- Pressure.
- Torque.
- Speed.
- Displacement.
- Acoustic response.
Changes in these readings may indicate:
- Bearing deterioration.
- Misalignment.
- Imbalance.
- Loosening.
- Excessive friction.
- Lubrication problems.
- Structural degradation.
Sensor data should be analysed against a reliable baseline.
Understanding Baseline Data
A baseline represents an established reference condition.
For example, a gearbox may have an established vibration level under:
- Defined load.
- Defined speed.
- Defined temperature.
- Defined operating condition.
Future readings can then be compared with this baseline.
An increasing deviation may indicate developing deterioration.
Trend Analysis
A single measurement provides limited information.
A trend can provide substantially more insight.
For example:
| Inspection Period | Vibration Reading | Interpretation |
|---|---|---|
| Initial baseline | 2.1 mm/s | Stable reference |
| Month 1 | 2.2 mm/s | Minor variation |
| Month 2 | 2.4 mm/s | Increasing trend |
| Month 3 | 2.8 mm/s | Significant deviation |
| Month 4 | 3.3 mm/s | Further investigation indicated |
The increasing pattern may justify investigation even if an individual reading has not yet exceeded a defined threshold.
Correlating Sensor Data With Inspection Results
A stronger analysis can combine sensor trends with physical inspection.
For example:
- Vibration increases.
- Bearing temperature increases.
- Lubrication condition deteriorates.
- Inspection identifies bearing surface damage.
The combination provides stronger evidence than any one observation alone.
Data Correlation
Correlation involves comparing different information sources to identify relationships.
Examples include:
- Increasing vibration + bearing wear.
- Increasing temperature + lubrication deterioration.
- Pressure fluctuation + valve degradation.
- UT indication + stress concentration.
- Hardness variation + heat-treatment inconsistency.
- Dimensional deviation + machining process variation.
Correlation does not automatically prove causation, but it helps identify areas requiring further engineering investigation.
Analysing Complex Test Reports
A structured approach should begin with the test report itself.
Step 1: Verify Test Identification
Confirm:
- Component ID.
- Test date.
- Test location.
- Test method.
- Equipment identification.
- Procedure reference.
- Inspector information.
Step 2: Review Test Conditions
Check:
- Operating condition.
- Temperature.
- Pressure.
- Load.
- Material.
- Component configuration.
Step 3: Review Raw Results
Examine:
- Measurements.
- Signals.
- Indications.
- Graphs.
- Images.
- Tables.
Step 4: Compare With Acceptance Criteria
Determine:
- Within limits.
- Borderline.
- Outside limits.
- Requires further assessment.
Step 5: Locate the Indication
Identify:
- Physical location.
- Depth.
- Orientation.
- Distance from datum.
- Relationship with stress concentrations.
Step 6: Assess Significance
Consider:
- Defect type.
- Size.
- Material.
- Loading.
- Criticality.
Step 7: Correlate With Other Evidence
Compare:
- Historical inspection.
- Sensor data.
- Maintenance records.
- Previous defects.
Step 8: Determine Action
Potential actions include:
- Accept.
- Monitor.
- Re-inspect.
- Investigate further.
- Repair.
- Replace.
- Escalate for engineering assessment.
Identifying Anomalies
An anomaly is a measurement or pattern that differs from expected behaviour.
Examples include:
- Unexpected ultrasonic signal.
- Unusual vibration.
- Abrupt temperature increase.
- Localised thickness reduction.
- Abnormal hardness.
- Unexpected dimensional deviation.
An anomaly should trigger investigation rather than automatic rejection.
Distinguishing Defects From Indications
A test indication is not automatically an unacceptable defect.
A disciplined process is:
Indication → Characterisation → Evaluation → Acceptance Assessment → Decision
This prevents premature conclusions.
Example: Ultrasonic Indication in a Shaft
A UT examination identifies an internal indication.
The engineer reviews:
- Depth.
- Position.
- Signal characteristics.
- Component geometry.
- Material.
- Loading.
- Applicable acceptance criteria.
The indication is then evaluated against the appropriate requirements.
The correct professional response is evidence-based assessment rather than immediate rejection.
Example: Stress Chart and Internal Defect
A mechanical component has an internal discontinuity near a region identified as highly stressed.
The engineering assessment should consider:
- Defect size.
- Defect orientation.
- Stress magnitude.
- Material properties.
- Cyclic loading.
- Component criticality.
The location may increase the significance of the indication.
Example: Sensor Trend
A gearbox vibration sensor shows:
- 2.0 mm/s baseline.
- 2.3 mm/s after several weeks.
- 2.8 mm/s later.
- 3.4 mm/s during the next inspection.
The increasing trend warrants investigation.
The engineer may correlate this with:
- Bearing condition.
- Alignment.
- Lubrication.
- Coupling condition.
- Load history.
Data Quality Before Data Interpretation
Before interpreting complex data, QA/QC personnel should confirm that the data themselves are reliable.
Check:
- Equipment calibration.
- Sensor condition.
- Test procedure.
- Operator competence.
- Test environment.
- Data completeness.
- Equipment identification.
- Time and date.
- Measurement units.
Poor-quality input data can produce misleading conclusions.
Measurement Uncertainty
Every measurement has some degree of uncertainty.
When a result is close to an acceptance limit, the engineer should consider:
- Instrument accuracy.
- Resolution.
- Calibration status.
- Environmental effects.
- Repeatability.
- Measurement method.
Borderline results may require additional verification rather than immediate acceptance or rejection.
Comparing Current and Historical Data
Historical comparison can identify deterioration.
Useful comparisons include:
- Current versus previous inspection.
- Current versus baseline.
- Current versus design value.
- Current versus production batch average.
- Current versus comparable components.
This helps identify gradual changes that may not be obvious from one test.
Statistical Patterns
Large datasets can reveal patterns such as:
- Increasing defect frequency.
- Concentration of defects in one production batch.
- Repeated indications at the same location.
- Increasing vibration levels.
- Increasing dimensional variation.
- Recurring welding defects.
These patterns may indicate a systemic process problem.
Identifying Systemic Weaknesses
Suppose ten components show similar internal indications at the same manufacturing location.
The QA/QC engineer should consider whether the issue relates to:
- Manufacturing process.
- Tooling.
- Material handling.
- Welding procedure.
- Heat treatment.
- Machining.
- Operator technique.
This moves the investigation from individual defect identification towards process improvement.
Risk-Based Interpretation
Not every defect has equal safety significance.
Risk assessment should consider:
- Probability of failure.
- Consequence of failure.
- Component criticality.
- Operating stress.
- Defect characteristics.
- Service environment.
A small defect in a safety-critical component may require more attention than a larger deviation in a non-critical component.
Practical Data-Analysis Workflow
Phase 1: Establish Context
- Identify component.
- Identify function.
- Review design information.
- Review operating conditions.
- Establish criticality.
Phase 2: Validate Data
- Check calibration.
- Verify equipment.
- Confirm test procedure.
- Review test conditions.
Phase 3: Examine Results
- Review raw measurements.
- Examine charts.
- Review NDT indications.
- Identify anomalies.
Phase 4: Locate Weaknesses
- Map indications.
- Identify stress points.
- Compare with geometry.
- Assess defect depth.
Phase 5: Correlate Evidence
- Compare historical results.
- Compare sensor trends.
- Review maintenance records.
- Review material data.
Phase 6: Evaluate
- Compare against criteria.
- Determine significance.
- Assess risk.
Phase 7: Recommend Action
- Monitor.
- Re-test.
- Investigate.
- Repair.
- Replace.
- Escalate.
Practical Example: Welded Pressure Component
A welded mechanical pressure component undergoes NDT.
The report identifies a subsurface indication near the weld region.
The engineer reviews:
- Weld geometry.
- Material.
- Indication depth.
- Indication length.
- Stress condition.
- Previous inspection results.
Historical records show that similar indications have occurred in the same welding area.
This correlation suggests that the issue may be systemic rather than isolated.
The appropriate response may include:
- Further examination.
- Review of welding controls.
- Examination of other affected components.
- Investigation of the underlying process.
Practical Example: Rotating Machinery
A pump shows gradually increasing vibration.
Historical sensor data reveal:
- Stable vibration during initial operation.
- Gradual increase over several operating cycles.
- Significant increase after a maintenance intervention.
The QA/QC engineer correlates the trend with:
- Alignment records.
- Bearing inspection.
- Coupling condition.
- Maintenance history.
This can help identify whether the increased vibration is associated with a developing mechanical weakness or a maintenance-related condition.
Practical Example: Forged Component
A forged shaft passes visual inspection but UT identifies a subsurface indication.
The engineer examines:
- Forging history.
- Material certificate.
- UT location.
- Indication characteristics.
- Stress distribution.
- Component loading.
The analysis demonstrates why visual conformity alone cannot establish internal material integrity.
Practical Example: Dimensional and Stress Data
A machined component has a local dimensional deviation at a transition.
Stress analysis shows that the same location experiences elevated stress.
The combination is more significant than the dimensional deviation considered independently.
The QA/QC engineer should therefore evaluate:
- Actual deviation.
- Stress level.
- Component function.
- Fatigue exposure.
- Acceptance criteria.
Common Analytical Errors
Treating Every Indication as a Defect
An indication must be evaluated before classification.
Ignoring Defect Location
Location can strongly influence significance.
Looking Only at Thresholds
Trend information may identify deterioration before a threshold is exceeded.
Ignoring Historical Data
Historical evidence can reveal recurring or progressive problems.
Ignoring Measurement Quality
Unreliable data cannot support reliable decisions.
Focusing on One Data Source
Multiple evidence sources can provide a more complete assessment.
Ignoring Operating Conditions
Test data should be interpreted in the context of actual service conditions.
Key Benefits of Advanced Test-Data Analysis
Safety
- Earlier identification of hidden weaknesses.
- Improved risk recognition.
- Reduced unexpected failures.
- Better protection of safety-critical equipment.
Quality
- More reliable conformity decisions.
- Better defect classification.
- Stronger evidence-based acceptance.
- Improved manufacturing control.
Reliability
- Early identification of deterioration.
- Better predictive maintenance.
- Reduced unplanned downtime.
- Improved asset integrity.
Cost Control
- Reduced unnecessary replacement.
- Better targeting of repairs.
- Lower failure-related costs.
- More efficient inspection planning.
Data Interpretation and Corrective Action
Once a significant condition is identified, the analysis should support an appropriate response.
Potential responses include:
- Immediate engineering review.
- Additional NDT.
- Increased monitoring.
- Controlled repair.
- Component replacement.
- Manufacturing-process investigation.
- Root cause analysis.
- Corrective action.
- Preventive action.
Reporting Analytical Findings
A professional report should clearly distinguish:
Observed Evidence
What the test actually identified.
Interpretation
What the evidence may indicate.
Engineering Significance
Why the finding matters.
Acceptance Status
Whether it meets applicable requirements.
Recommended Action
What should happen next.
This structure prevents unsupported conclusions.
Data Traceability
Every important finding should be traceable to:
- Component.
- Test.
- Date.
- Location.
- Equipment.
- Procedure.
- Inspector.
- Raw data.
- Acceptance criteria.
Traceability allows findings to be independently reviewed.
Case Study: Detecting a Hidden Weakness in a Rotating Shaft
Background
A rotating mechanical shaft has operated continuously under cyclic bending and torsion. Visual inspection reveals no obvious surface damage.
However, vibration monitoring shows a gradual increase.
Initial Data
The QA/QC team reviews:
- Historical vibration readings.
- Shaft inspection records.
- Previous maintenance.
- Operating loads.
The trend indicates progressive deterioration.
NDT Examination
An appropriate NDT examination is performed.
An internal indication is identified near a geometric transition.
Engineering Analysis
The team compares:
- Defect location.
- Stress distribution.
- Shaft geometry.
- Material.
- Cyclic loading.
- Historical vibration trend.
The internal indication is located close to a stress concentration.
Decision-Making
The combination of:
- Increasing vibration.
- Internal indication.
- High-stress location.
- Cyclic loading.
provides stronger evidence of a potentially significant mechanical weakness than any individual finding.
Further engineering evaluation and appropriate corrective action are therefore justified.
Lessons Learned
The case demonstrates that:
- Visual inspection alone may be insufficient.
- Sensor trends can provide early warning.
- NDT can identify hidden conditions.
- Stress information helps establish significance.
- Historical data strengthen engineering interpretation.
- Multiple evidence sources support better decisions.
Improving Test-Data Analysis
Organisations can improve analytical performance by:
- Standardising test-report formats.
- Establishing reliable baselines.
- Maintaining historical databases.
- Linking NDT results with component IDs.
- Trending sensor readings.
- Monitoring recurring defects.
- Training personnel in data interpretation.
- Using risk-based prioritisation.
- Reviewing borderline results.
- Maintaining strong measurement traceability.
Professional Decision-Making Framework
A useful framework is:
Validate → Compare → Locate → Correlate → Evaluate → Decide → Document
Validate
Confirm the test data are reliable.
Compare
Compare results against specifications, baselines, and historical data.
Locate
Determine exactly where the anomaly or indication occurs.
Correlate
Connect the finding with stress, material, loading, and operating evidence.
Evaluate
Assess significance and compliance.
Decide
Determine the appropriate engineering response.
Document
Record the evidence, reasoning, and decision.
Key Points for Professional Practice
- Complex test data require structured interpretation.
- A test indication is not automatically an unacceptable defect.
- Subsurface defects require suitable examination methods.
- Stress concentration affects defect significance.
- Historical data can reveal progressive deterioration.
- Sensor trends can provide early warning.
- Data quality must be established before interpretation.
- Measurement uncertainty matters for borderline results.
- Multiple data sources can strengthen engineering conclusions.
- Acceptance decisions should be based on defined criteria.
- Defect location, size, orientation, material and loading should be considered together.
- Recurring indications may indicate systemic process weaknesses.
- Test findings should be traceable to the component and equipment.
- Engineering conclusions should distinguish evidence from interpretation.
- Corrective actions should address both immediate and systemic risks.
Conclusion
The analysis of complex mechanical test reports, material stress information, and sensor readings provides an essential bridge between inspection data and engineering decision-making. Hidden weaknesses such as internal cracks, subsurface discontinuities, material degradation, fatigue damage, and localised structural weaknesses cannot always be identified through external visual examination. By systematically analysing NDT indications, stress distributions, dimensional results, material properties, sensor trends, and historical records, QA/QC professionals can develop a more complete understanding of mechanical component condition.
Effective analysis requires more than identifying values that appear unusual. The significance of a test result depends on the component’s material, geometry, loading, stress concentration, operating environment, defect characteristics, measurement uncertainty, and applicable acceptance criteria. A subsurface indication near a highly stressed shaft transition may require considerably more attention than a similar indication in a low-stress region. Likewise, an increasing vibration trend may become more significant when it correlates with bearing deterioration, alignment changes, or other physical inspection findings.
A robust engineering approach therefore follows a structured process of validating data, comparing results, locating indications, correlating different evidence sources, evaluating engineering significance, determining appropriate action, and documenting the decision. This approach supports earlier identification of safety risks, stronger conformity assessment, improved mechanical integrity, and more reliable equipment operation. It also allows organisations to identify recurring patterns and systemic weaknesses, helping them move from reactive defect correction towards proactive quality improvement and asset reliability management.
2: Evaluate the Severity of Identified Mechanical Defects to Determine Immediate Risks to Plant Safety, Structural Integrity, and Worker Operations
Evaluating the severity of a mechanical defect is a critical QA/QC and engineering decision-making activity because the discovery of a defect does not, by itself, establish the level of risk. A mechanical indication must be assessed in relation to its type, size, location, orientation, material, loading conditions, operating environment, component function, and potential consequences of failure. A small crack located at a highly stressed region of a rotating shaft may represent a more immediate concern than a larger dimensional deviation in a non-critical component. Effective defect evaluation therefore requires technical evidence, engineering judgement, defined acceptance criteria, and a clear understanding of how mechanical systems behave under actual operating conditions.
The primary objective is to determine whether an identified condition can be accepted, monitored, repaired, isolated, or requires immediate control measures. This assessment should protect plant safety, mechanical integrity, equipment reliability, and worker operations without relying on assumptions or subjective judgements. The severity assessment should also distinguish between an indication, a confirmed defect, a non-conformance, and an immediate safety-critical condition. By applying a structured evaluation process, mechanical QA/QC professionals can prioritise significant findings, prevent escalation of deterioration, support technically justified corrective action, and ensure that potentially hazardous equipment is not allowed to continue operating without appropriate controls.
Understanding Mechanical Defect Severity
Mechanical defect severity refers to the significance of a defect in relation to the component’s ability to perform its intended function safely and reliably.
Severity is influenced by:
- Defect type.
- Defect size.
- Defect depth.
- Defect orientation.
- Defect location.
- Material properties.
- Stress concentration.
- Operating load.
- Cyclic loading.
- Temperature.
- Pressure.
- Corrosive environment.
- Component criticality.
- Consequence of failure.
- Proximity to workers.
- Existing deterioration.
- Applicable acceptance criteria.
A defect should therefore never be evaluated solely on its physical size.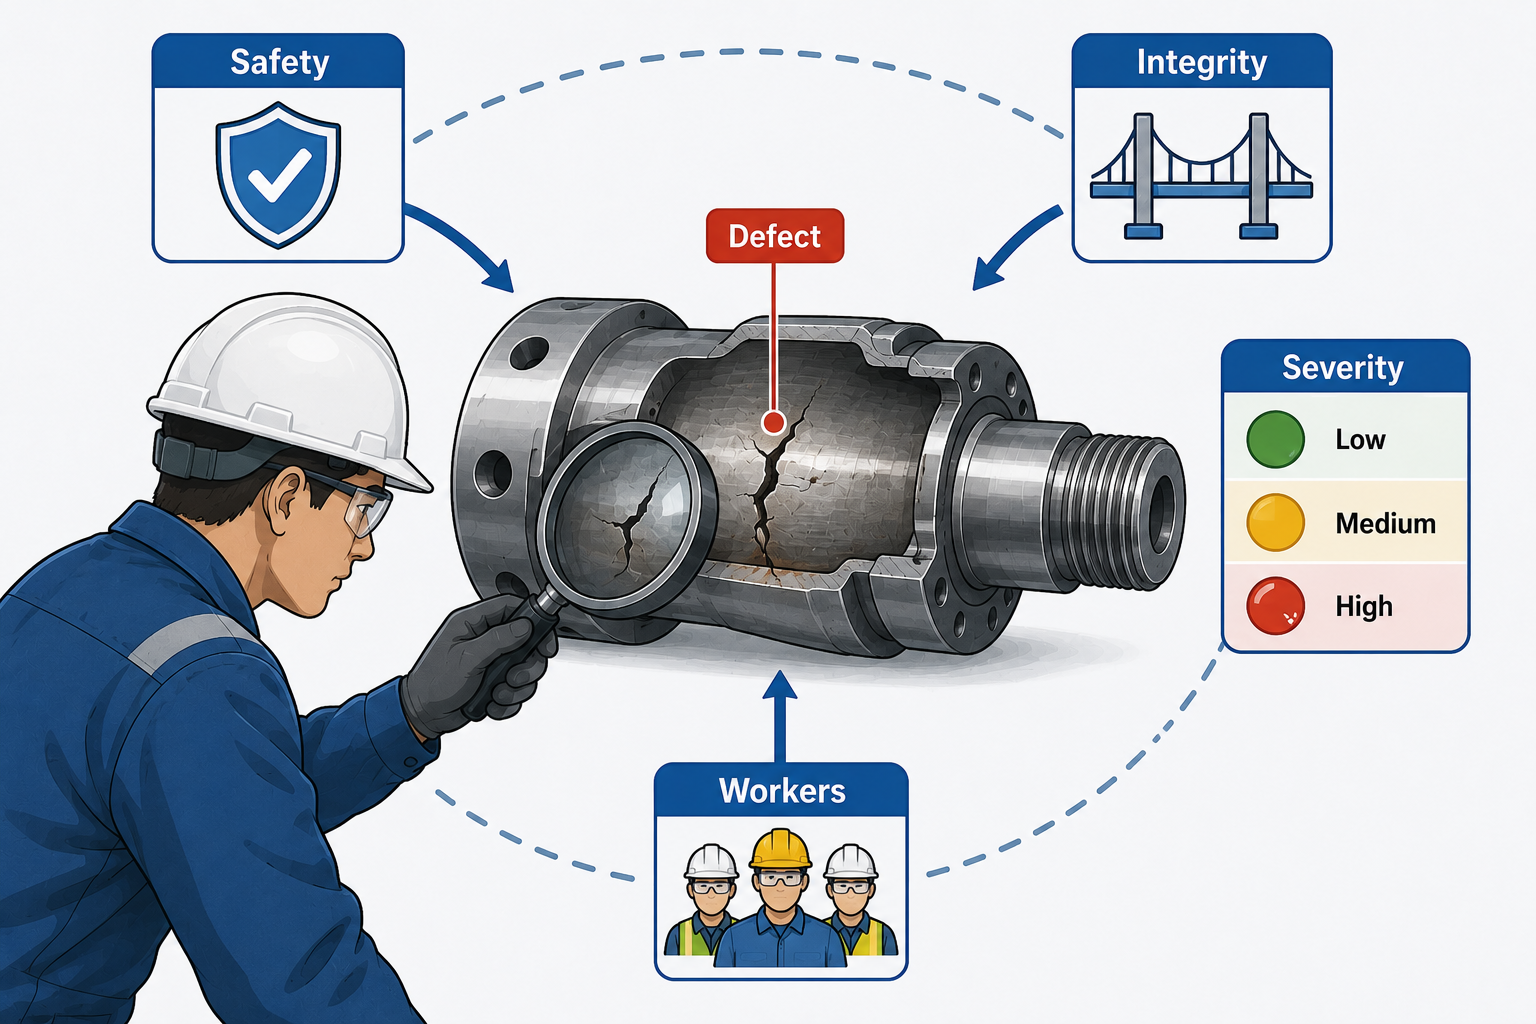
Key Definitions and Concepts
| Term | Definition | Mechanical QA/QC Application |
|---|---|---|
| Defect | A condition that fails applicable requirements or acceptance criteria | Unacceptable weld crack |
| Indication | A response observed during an inspection or test | Ultrasonic signal |
| Severity | Degree of significance associated with a defect | Critical shaft crack |
| Risk | Combination of likelihood and consequence of an undesired event | Potential equipment failure |
| Structural Integrity | Ability of a component to withstand intended loads safely | Pressure vessel or shaft integrity |
| Stress Concentration | Local increase in stress caused by geometry or discontinuity | Keyway or weld toe |
| Critical Component | Component whose failure could have significant consequences | Main drive shaft |
| Immediate Risk | Hazard requiring prompt control or intervention | Active crack in rotating equipment |
| Acceptance Criteria | Defined limits used to determine conformity | Maximum permitted indication |
| Failure Mode | Mechanism by which a component may cease functioning | Fatigue fracture |
| Degradation | Progressive deterioration of component condition | Wall thinning |
| Non-Conformance | Failure to meet specified requirements | Out-of-tolerance component |
| Escalation | Increasing the level of engineering or management response | Immediate engineering review |
| Containment | Action taken to control an identified condition | Isolating defective equipment |
| Corrective Action | Action taken to address an identified problem | Repairing the defect |
| Consequence | Result of failure or deterioration | Injury, downtime or equipment damage |
Why Defect Severity Assessment Matters
Mechanical defects can have consequences far beyond the affected component.
A serious defect may lead to:
- Equipment failure.
- Loss of containment.
- Structural collapse.
- Uncontrolled movement.
- Rotating equipment failure.
- Pressure release.
- Fire or secondary damage.
- Production interruption.
- Environmental consequences.
- Worker injury.
Consequently, defect evaluation should consider the entire operating system rather than treating the defect as an isolated physical imperfection.
The Difference Between Defect and Risk
A defect is a physical or measurable condition.
Risk concerns the potential consequences associated with that condition.
For example, a small fatigue crack in a heavily loaded rotating shaft is a defect. Its potential to propagate and cause shaft fracture represents the associated risk.
Therefore:
Defect identification → Defect characterisation → Severity assessment → Risk evaluation → Control decision
This distinction supports more rational engineering decisions.
Initial Defect Characterisation
Before assessing severity, the defect should be clearly characterised.
The QA/QC professional should establish:
- What is the defect?
- Where is it located?
- How large is it?
- How deep is it?
- What direction does it follow?
- What material is affected?
- What loading does the component experience?
- Is the defect growing?
- Is it isolated or recurring?
Incomplete characterisation can lead to incorrect risk assessment.
Defect Type
Different defects can have very different consequences.
Common mechanical defects include:
- Cracks.
- Porosity.
- Lack of fusion.
- Incomplete penetration.
- Corrosion.
- Erosion.
- Wear.
- Deformation.
- Dimensional deviation.
- Material discontinuities.
- Surface damage.
- Fatigue indications.
- Excessive clearance.
- Misalignment.
The likely failure mechanism should be considered for each type.
Crack Severity
Cracks often require particular attention because they can propagate under suitable loading conditions.
Important characteristics include:
- Crack length.
- Crack depth.
- Crack orientation.
- Crack location.
- Crack morphology.
- Material.
- Stress level.
- Cyclic loading.
- Temperature.
A crack located perpendicular to a significant tensile stress may present a different concern from one positioned in a low-stress direction.
Defect Size
Size is an important factor, but it is not the only factor.
A severity assessment should consider:
- Length.
- Width.
- Depth.
- Area.
- Volume.
- Relationship with component thickness.
For volumetric defects, distribution can also be important.
Defect Location
Location may substantially influence severity.
High-risk locations include:
- Shaft shoulders.
- Keyways.
- Weld toes.
- Weld roots.
- Pressure boundaries.
- Bolt holes.
- Thread roots.
- Bearing seats.
- Thin sections.
- High-stress transitions.
A defect in a critical load-bearing location deserves greater attention than an equivalent defect in a low-stress region.
Defect Orientation
Orientation matters because defects interact differently with applied loads.
Consider:
- Tensile stress direction.
- Shear stress.
- Bending stress.
- Torsional stress.
- Pressure stress.
A crack orientation that is favourable to propagation under the applied stress may increase risk.
Material Properties
Material characteristics influence how a defect behaves.
Relevant properties may include:
- Yield strength.
- Tensile strength.
- Toughness.
- Ductility.
- Hardness.
- Fatigue resistance.
Brittle and ductile materials may respond differently to similar discontinuities.
Operating Load
The actual operating condition should be considered.
Relevant loading may include:
- Static load.
- Dynamic load.
- Cyclic load.
- Impact.
- Bending.
- Torsion.
- Pressure.
- Thermal loading.
A component under continuous cyclic loading may require closer assessment than an otherwise identical component subjected to low static loading.
Stress Concentration and Defect Severity
Stress concentrations increase local stress.
Common sources include:
- Keyways.
- Grooves.
- Sharp corners.
- Threads.
- Holes.
- Weld geometry.
- Sudden cross-section changes.
When a defect occurs near a stress concentration, the combined effect can be more significant.
Structural Integrity Assessment
Structural integrity refers to the ability of a component or assembly to withstand its intended mechanical loading without unacceptable failure.
Assessment should consider:
- Design loading.
- Actual loading.
- Material properties.
- Component geometry.
- Defect characteristics.
- Remaining thickness.
- Stress concentration.
- Failure mode.
- Operating environment.
Immediate Plant Safety Risk
An immediate risk exists when the defect could reasonably contribute to a serious failure or hazardous condition without sufficient time for normal corrective planning.
Examples may include:
- Major crack in a rotating shaft.
- Significant structural fracture.
- Severe pressure-boundary defect.
- Rapidly increasing vibration associated with mechanical deterioration.
- Significant deformation affecting equipment stability.
- Serious defect in a safety-critical mechanical component.
Such findings require prompt escalation and appropriate control.
Worker Operations and Defect Severity
Defect evaluation must consider how workers interact with the affected equipment.
Potential worker exposures include:
- Moving machinery.
- Stored mechanical energy.
- Pressurised systems.
- Hot surfaces.
- Falling components.
- Rotating components.
- Sudden release of energy.
- Unexpected equipment movement.
A defect that creates a credible worker exposure may require more urgent control than one that only affects production efficiency.
Severity Classification
A practical internal classification can help prioritise responses.
Low Severity
Typical characteristics:
- Minor deviation.
- No significant effect on function.
- Stable condition.
- Low consequence of failure.
- Clearly within acceptable limits or requiring routine correction.
Potential response:
- Record.
- Correct through normal process.
- Monitor where appropriate.
Moderate Severity
Typical characteristics:
- Noticeable deterioration.
- Potential impact on performance.
- Limited margin against acceptance requirements.
- Requires planned corrective action.
Potential response:
- Engineering review.
- Increased monitoring.
- Planned repair.
- Additional inspection.
High Severity
Typical characteristics:
- Significant defect.
- Potential reduction in mechanical integrity.
- Defect located in a critical area.
- Potential progression under service conditions.
Potential response:
- Immediate management attention.
- Additional examination.
- Engineering assessment.
- Controlled operational restrictions.
Critical Severity
Typical characteristics:
- Credible immediate failure mechanism.
- Significant threat to workers or plant.
- Major structural or pressure-boundary concern.
- High consequence of failure.
Potential response:
- Immediate control.
- Isolation where appropriate.
- Urgent engineering evaluation.
- Controlled corrective action.
Defect Severity Assessment Process
Step 1: Identify the Defect
Establish exactly what was found.
Step 2: Verify the Finding
Confirm the result using appropriate evidence where required.
Step 3: Characterise the Defect
Determine:
- Type.
- Size.
- Depth.
- Orientation.
- Location.
Step 4: Establish Component Function
Determine what the component does and what would happen if it failed.
Step 5: Review Loading
Assess:
- Static loading.
- Cyclic loading.
- Pressure.
- Bending.
- Torsion.
- Thermal effects.
Step 6: Assess Stress Concentration
Determine whether the defect occurs at a critical geometric location.
Step 7: Compare With Requirements
Review:
- Drawings.
- Specifications.
- Codes.
- Procedures.
- Acceptance criteria.
Step 8: Evaluate Consequences
Consider:
- Worker safety.
- Plant safety.
- Equipment damage.
- Production impact.
- Environmental consequences.
Step 9: Determine Severity
Assign an appropriate severity category.
Step 10: Determine Immediate Controls
Establish whether:
- Continued operation is acceptable.
- Monitoring is required.
- Operating restrictions are needed.
- Equipment should be isolated.
- Further examination is required.
Step 11: Document
Record:
- Evidence.
- Assessment.
- Decision.
- Responsible personnel.
- Required actions.
Comparing Defect Severity With Acceptance Criteria
Acceptance criteria provide an objective basis for determining conformity.
The QA/QC engineer should identify:
- Applicable specification.
- Relevant inspection requirement.
- Permitted defect size.
- Defect type restrictions.
- Location requirements.
- Component-specific limitations.
A defect outside acceptance criteria should be formally controlled.
Why Acceptance Criteria Alone May Not Be Enough
A defect can meet a general acceptance limit but still require engineering attention if:
- Operating conditions have changed.
- Multiple defects interact.
- The component has deteriorated.
- Stress levels have increased.
- Historical degradation is accelerating.
- The defect is located in an unusually critical area.
Engineering judgement is therefore still necessary within the defined requirements.
Evaluating Multiple Defects
Several small defects may collectively represent a greater concern than one isolated defect.
Consider:
- Defect density.
- Defect clustering.
- Distance between indications.
- Interaction between defects.
- Location relative to stress fields.
For example, multiple closely spaced internal indications may require a different assessment from a single isolated indication.
Defect Growth
A defect that is stable may present a different risk from one that is growing.
Evidence of growth may include:
- Increasing crack length.
- Increasing wall loss.
- Increasing vibration.
- Increasing temperature.
- Increasing deformation.
- Repeated NDT indications.
Historical comparison is therefore essential.
Rate of Deterioration
The rate of deterioration can be an important risk indicator.
For example:
| Inspection | Wall Thickness | Change |
|---|---|---|
| Initial | 12.0 mm | Baseline |
| Year 1 | 11.7 mm | −0.3 mm |
| Year 2 | 11.3 mm | −0.4 mm |
| Year 3 | 10.7 mm | −0.6 mm |
The increasing rate of reduction may justify closer investigation.
Consequence of Failure
Severity assessment should consider what happens if the component fails.
Potential consequences include:
- Minor production interruption.
- Equipment damage.
- Major equipment failure.
- Loss of containment.
- Structural collapse.
- Worker injury.
- Environmental release.
- Extended plant shutdown.
High-consequence components require greater attention.
Criticality of Components
Examples of potentially critical components include:
- Main drive shafts.
- Pressure-containing components.
- Load-bearing structures.
- Critical couplings.
- Safety-related mechanical assemblies.
- Primary lifting components.
- High-speed rotating equipment.
The same defect may therefore receive different risk priorities depending on component criticality.
Practical Example: Cracked Rotating Shaft
A rotating shaft develops a crack near a keyway.
The assessment identifies:
- Ferromagnetic steel.
- Cyclic bending.
- High rotational speed.
- Keyway stress concentration.
- Crack located at a highly loaded transition.
The combination creates a potentially serious fatigue risk.
The appropriate response should involve prompt engineering assessment and suitable control measures rather than routine monitoring alone.
Practical Example: Minor Surface Deviation
A fabricated bracket has a small surface imperfection away from its load-bearing region.
The component:
- Remains within dimensional requirements.
- Has no evidence of cracking.
- Performs a low-criticality function.
The finding may be classified as low severity and managed through normal QA/QC processes.
This illustrates why defect severity should be evidence-based rather than determined by appearance alone.
Practical Example: Weld Defect in a Pressure Boundary
An internal weld indication is identified within a pressure-containing component.
The engineer evaluates:
- Defect type.
- Size.
- Location.
- Pressure.
- Material.
- Wall thickness.
- Applicable acceptance criteria.
Because the component contains stored energy under pressure, the potential consequences of failure must be carefully evaluated.
Practical Example: Increasing Vibration
A gearbox has gradually increasing vibration readings.
Additional inspection identifies bearing deterioration.
The assessment should consider:
- Vibration trend.
- Bearing condition.
- Operating load.
- Temperature.
- Lubrication.
- Equipment criticality.
The increasing trend may indicate a developing mechanical failure rather than a temporary measurement anomaly.
Practical Example: Structural Deformation
A support structure exhibits measurable deformation.
The engineer assesses:
- Magnitude of deformation.
- Location.
- Loading.
- Structural function.
- Historical measurements.
- Presence of cracking.
- Potential worker exposure.
The severity depends on whether the deformation affects structural integrity and operational safety.
Evaluating Worker Exposure
The defect assessment should consider how the condition could affect personnel.
Potential exposure scenarios include:
- Component rupture.
- Unexpected movement.
- Falling equipment.
- Pressure release.
- Rotating component failure.
- Structural collapse.
Where such consequences are credible, the finding should be escalated appropriately.
Immediate Control Measures
Depending on the severity, controls may include:
- Restricting access.
- Stopping the affected operation.
- Isolating equipment.
- Reducing operating load where technically justified.
- Increasing inspection frequency.
- Conducting additional NDT.
- Removing the component from service.
- Initiating urgent engineering assessment.
Control measures should be technically justified and documented.
Avoiding Premature Return to Service
Production pressure should not override mechanical integrity.
Before returning defective equipment to service, the organisation should establish:
- Defect significance.
- Applicable acceptance criteria.
- Engineering assessment.
- Required repair.
- Verification requirements.
- Final inspection results.
Corrective Action
Corrective action should address the identified defect.
Examples include:
- Repair.
- Replacement.
- Re-machining.
- Weld repair.
- Controlled strengthening.
- Process correction.
- Additional inspection.
Preventive Action
Preventive action addresses conditions that may allow similar defects to occur.
Examples include:
- Manufacturing process improvement.
- Welding-process review.
- Material control.
- Maintenance improvement.
- Inspection frequency adjustment.
- Operator training.
- Equipment calibration improvement.
Risk Matrix Concept
A simple risk framework may consider:
Likelihood × Consequence = Risk Priority
Potential likelihood categories include:
- Rare.
- Unlikely.
- Possible.
- Likely.
- Almost certain.
Potential consequence categories include:
- Minor.
- Moderate.
- Serious.
- Major.
- Catastrophic.
The exact classification system should be defined by the organisation’s approved risk methodology.
Important Consideration: Severity Versus Likelihood
Severity and likelihood are related but different.
A defect may have:
- High consequence but low probability.
- Low consequence but high probability.
- High consequence and high probability.
Professional assessment should consider both dimensions.
Trend-Based Risk Assessment
Historical trends can change the severity assessment.
For example:
Stable defect → increasing defect → accelerating defect → immediate concern
This progression demonstrates why periodic inspection records should be reviewed rather than stored without analysis.
Documentation of Defect Severity
A professional defect report should include:
- Component identification.
- Defect description.
- Inspection method.
- Location.
- Size.
- Material.
- Operating condition.
- Applicable acceptance criteria.
- Severity classification.
- Risk assessment.
- Immediate controls.
- Corrective action.
- Verification requirements.
Defect Escalation
A clear escalation process should define when findings move from routine QA/QC handling to engineering or management review.
Escalation may be triggered by:
- Safety-critical defect.
- Out-of-acceptance indication.
- Rapid deterioration.
- Critical component location.
- Potential worker exposure.
- Uncertain defect significance.
- Repeated failure.
- Loss of containment risk.
Common Errors in Defect Severity Assessment
Judging Severity by Size Alone
Size must be considered alongside location, orientation, loading and material.
Ignoring Component Criticality
A defect in a critical component deserves greater scrutiny.
Ignoring Operating Conditions
Static inspection results may not fully represent dynamic operating risk.
Treating All Cracks Equally
Crack significance varies with orientation, location, material and stress.
Ignoring Historical Trends
A growing defect can present greater risk than a stable defect of similar size.
Allowing Production Pressure to Influence Technical Decisions
Commercial urgency should not replace engineering evidence.
Failing to Verify Indications
Unconfirmed indications can lead to inappropriate decisions.
Key Benefits of Effective Severity Assessment
Safety Benefits
- Earlier identification of dangerous conditions.
- Better protection of workers.
- Reduced probability of catastrophic failure.
- Improved control of hazardous equipment.
Mechanical Integrity Benefits
- Better understanding of component condition.
- More effective defect management.
- Improved structural reliability.
- Reduced unexpected deterioration.
Operational Benefits
- Better maintenance prioritisation.
- Reduced unplanned downtime.
- Improved equipment availability.
- Better resource allocation.
Quality Benefits
- Stronger NCR management.
- Better acceptance decisions.
- Improved corrective action.
- More effective quality assurance.
Case Study: Critical Defect in a Rotating Assembly
Background
A high-speed mechanical drive assembly is undergoing periodic inspection. Visual inspection shows minor surface wear, but NDT identifies a linear indication near a shaft keyway.
Initial Assessment
The QA/QC team confirms:
- The shaft is ferromagnetic.
- The indication is surface-connected.
- The location is adjacent to a stress concentration.
- The shaft experiences cyclic bending and torsional loading.
- The equipment is critical to plant operation.
Severity Evaluation
The defect is not assessed based solely on its length.
The team considers:
- Crack characteristics.
- Keyway geometry.
- Cyclic loading.
- Rotational speed.
- Material.
- Consequences of shaft failure.
- Worker exposure.
Risk Decision
Because the defect occurs in a fatigue-sensitive location on a critical rotating component, the finding is escalated for urgent engineering evaluation.
Appropriate control measures are established before further operation.
Corrective Action
The final corrective action is determined following technical assessment and applicable requirements.
Lessons Learned
The case demonstrates that defect severity is determined by the relationship between the defect and the operating system, not simply by its visual appearance.
Case Study: Recurring Weld Defects
Background
Several fabricated mechanical assemblies show similar weld indications.
Investigation
The QA/QC team identifies:
- Similar defect type.
- Similar location.
- Similar welding stage.
- Similar manufacturing conditions.
Severity Assessment
Individually, some indications appear moderate.
Collectively, the recurrence indicates a systemic quality concern.
Response
The organisation initiates:
- Expanded inspection.
- Welding-process review.
- Corrective action.
- Additional verification.
- Process monitoring.
Lesson
Repeated defects may indicate a process-level risk even when individual defects appear manageable.
Professional Decision Framework
A useful approach is:
Identify → Verify → Characterise → Locate → Compare → Assess → Prioritise → Control → Correct → Verify
Identify
Determine what has been found.
Verify
Confirm the finding using suitable evidence.
Characterise
Determine defect type, size, depth and orientation.
Locate
Establish its exact relationship with component geometry.
Compare
Review against acceptance criteria and historical condition.
Assess
Evaluate stress, loading, material and failure mechanism.
Prioritise
Determine severity and risk.
Control
Apply immediate controls where necessary.
Correct
Implement suitable corrective action.
Verify
Confirm the condition has been satisfactorily addressed.
Key Points for Professional Practice
- Defect severity is more than defect size.
- Location can significantly affect risk.
- Stress concentration can increase defect significance.
- Material properties influence failure behaviour.
- Cyclic loading can increase fatigue-related risk.
- Component criticality should influence prioritisation.
- Historical trends can reveal accelerating deterioration.
- Worker exposure must be considered.
- Acceptance criteria provide an objective basis for conformity decisions.
- Immediate risks require appropriate escalation.
- Defects should be verified before final classification where necessary.
- Multiple defects may interact.
- Corrective actions should address identified conditions.
- Preventive actions should address systemic causes.
- Technical decisions should remain evidence-based.
Conclusion
Evaluating the severity of mechanical defects is a fundamental part of professional mechanical QA/QC because the discovery of an indication does not automatically establish its safety significance. A technically sound assessment considers the complete relationship between defect characteristics, component material, geometry, stress concentration, loading conditions, operating environment, component criticality, and potential consequences of failure. This approach allows QA/QC professionals to distinguish minor deviations from conditions that may threaten plant safety, structural integrity, equipment reliability, or worker operations.
Effective severity assessment also requires consideration of time. A stable condition may require monitoring, whereas an accelerating crack, increasing vibration trend, progressive wall loss, or rapidly developing deformation may require immediate intervention. Historical inspection results and sensor data can therefore be as important as the latest physical examination. When evidence indicates that a defect is growing or interacting with a critical stress region, the engineering response should be escalated accordingly.
The most effective approach combines technical evidence with defined acceptance criteria and professional engineering judgement. By systematically identifying, verifying, characterising, locating, comparing, assessing, prioritising, controlling, correcting, and verifying mechanical defects, organisations can make defensible decisions about continued operation, repair, replacement, monitoring, or isolation. This structured process strengthens mechanical integrity, protects workers, reduces unexpected equipment failures, supports regulatory and quality compliance, and contributes to safer and more reliable plant operations.
3: Formulate Clear Non-Conformance Reports (NCRs) That Trace Detected Component Deviations Back to Specific Design Codes or Manufacturing Standards
A Non-Conformance Report (NCR) is a formal quality document used to record, evaluate, communicate, and control a deviation from an approved engineering requirement, drawing, specification, design code, manufacturing standard, inspection criterion, or documented process. In mechanical engineering QA/QC, an effective NCR does more than state that a component has failed inspection. It establishes a clear and traceable connection between the actual condition identified during inspection and the specific requirement that the condition fails to satisfy. This traceability provides the technical foundation for corrective action, engineering disposition, root cause analysis, repair, rework, replacement, and verification.
A professionally prepared mechanical NCR should therefore be factual, objective, technically precise, and supported by verifiable evidence. It should allow another competent engineer, auditor, client representative, quality manager, or project authority to understand exactly what was inspected, what deviation was identified, where it occurred, how it was measured, which requirement applies, and why the condition constitutes a non-conformance. This is particularly important where mechanical components are manufactured, fabricated, welded, machined, assembled, tested, or installed under controlled quality systems. Without accurate traceability, an NCR can become a general complaint rather than an effective engineering quality record.
The quality of an NCR also directly influences the effectiveness of the wider QA/QC system. Poorly written NCRs can result in inappropriate corrective actions, repeated defects, disputes over acceptance criteria, weak audit evidence, and delays in project completion. Conversely, clear NCRs provide reliable data for trend analysis, supplier evaluation, process improvement, risk management, and management review. A strong NCR therefore acts simultaneously as a quality-control record, technical evidence document, corrective-action trigger, and source of continuous improvement information.
Understanding Non-Conformance in Mechanical Engineering
A non-conformance occurs when an actual condition does not meet a specified requirement.
The requirement may originate from:
- Approved engineering drawings.
- Project specifications.
- Design codes.
- Manufacturing standards.
- Material specifications.
- Welding requirements.
- Inspection and Test Plans (ITPs).
- Approved procedures.
- Purchase specifications.
- Contract requirements.
- Customer requirements.
- Manufacturer requirements.
- Approved engineering calculations.
- Inspection acceptance criteria.
The key principle is that a non-conformance must be demonstrated against a defined requirement, rather than based solely on personal preference or visual judgement.
For example, stating:
“The shaft diameter is incorrect.”
is insufficiently precise.
A stronger NCR statement would establish:
- The component identification.
- The specified diameter.
- The measured diameter.
- The measurement location.
- The applicable drawing or specification.
- The permitted tolerance.
- The inspection equipment used.
- The resulting deviation.
This creates an auditable technical relationship between the requirement and the observed condition.
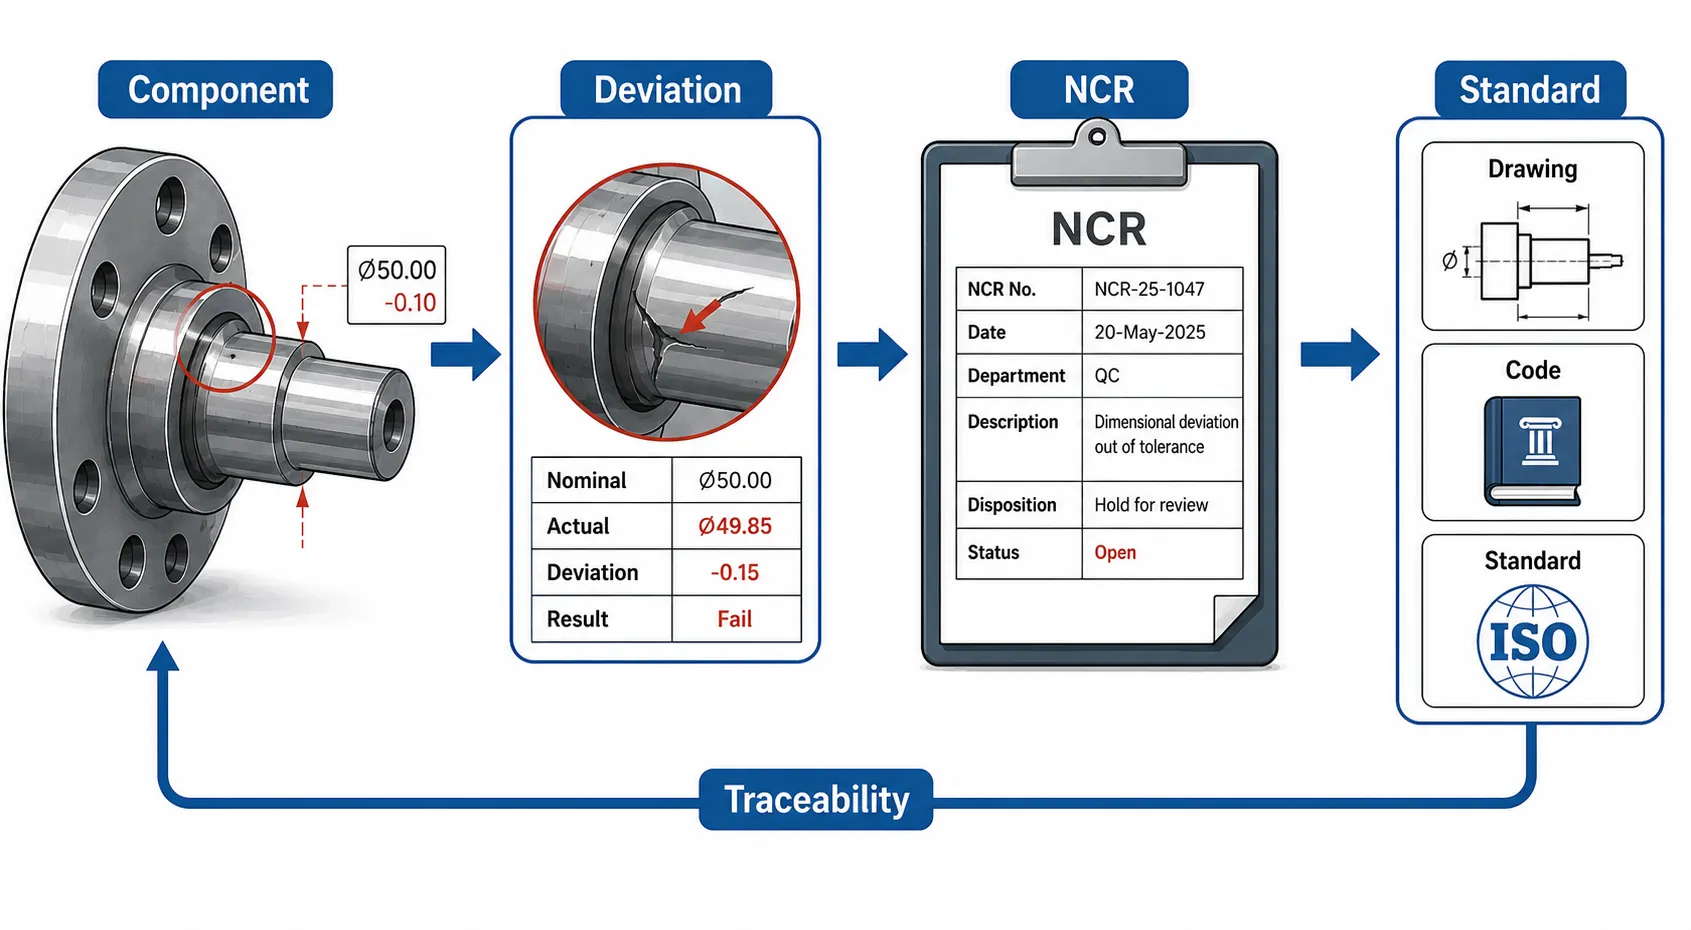
Key Definitions and Concepts
| Term | Definition | Mechanical QA/QC Application |
|---|---|---|
| Non-Conformance | Failure to satisfy a specified requirement | Shaft dimension outside drawing tolerance |
| NCR | Formal record of an identified non-conformance | Documents deviation and required response |
| Deviation | Difference between actual and specified condition | Measured thickness below requirement |
| Design Code | Technical rules governing design or engineering requirements | Establishes applicable design criteria |
| Manufacturing Standard | Defined requirements governing production or fabrication | Controls manufacturing characteristics |
| Acceptance Criteria | Defined limits used to determine conformity | Maximum permitted weld indication |
| Traceability | Ability to connect evidence to its source | Linking defect to drawing and inspection record |
| Objective Evidence | Verifiable information supporting a finding | Measurement record or NDT report |
| Disposition | Approved decision regarding the non-conforming item | Repair, rework, use-as-is or reject |
| Corrective Action | Action addressing the cause of a non-conformance | Process correction |
| Root Cause | Fundamental reason for the occurrence | Incorrect machining setup |
| Rework | Action to bring an item into conformity | Re-machining an oversized component |
| Repair | Action that restores function but may differ from original requirements | Approved repair to damaged component |
| Use-as-Is | Formal acceptance of a non-conforming item under authorised conditions | Engineering-approved concession |
| Verification | Confirmation that corrective action was effective | Re-inspection after repair |
Purpose of an NCR
The fundamental purpose of an NCR is to provide controlled documentation of a deviation.
An effective NCR should:
- Identify the affected component.
- Describe the actual condition.
- Identify the applicable requirement.
- Demonstrate the deviation.
- Record objective evidence.
- Establish the significance of the finding.
- Initiate controlled disposition.
- Assign corrective action.
- Support verification and closure.
An NCR should not be used simply as a mechanism for blaming an individual, department, contractor, or supplier.
The Importance of Requirement Traceability
Traceability is one of the most important characteristics of a professional NCR.
The report should allow the reader to follow a logical chain:
Component → Inspection → Finding → Requirement → Deviation → Disposition → Corrective Action → Verification → Closure
For example:
Component: Pump shaft
Inspection: Dimensional inspection
Finding: Shaft diameter measured below specified tolerance
Requirement: Approved drawing requirement
Deviation: Measured value outside specified range
Disposition: Engineering review
Corrective Action: Controlled rework or replacement
Verification: Repeat dimensional inspection
This structure makes the NCR technically defensible.
Identifying the Correct Requirement
Before raising an NCR, the QA/QC professional should establish which requirement actually applies.
Potential sources include:
- Approved drawings.
- Contract specifications.
- Design calculations.
- Manufacturing procedures.
- Inspection procedures.
- Material certificates.
- Welding documentation.
- Equipment datasheets.
- Approved technical standards.
The most current approved document should be used, and document revision status should be verified.
Why Document Revision Matters
Using an obsolete drawing or superseded specification can result in an invalid NCR.
Before citing a requirement, verify:
- Document title.
- Document number.
- Revision number.
- Approval status.
- Effective date where applicable.
- Applicable component or activity.
- Relevant section, clause, or requirement.
A professionally written NCR should identify enough information to allow another person to retrieve the exact source.
Linking Design Codes to NCR Findings
Design codes establish technical requirements that may govern:
- Dimensions.
- Material properties.
- Design stresses.
- Pressure boundaries.
- Weld quality.
- Structural requirements.
- Safety factors.
- Testing.
- Inspection.
The NCR should identify the relevant requirement rather than simply stating the name of a code.
For example, a weak statement would be:
“The component does not comply with the applicable code.”
A stronger statement identifies:
- Applicable code.
- Relevant section or requirement.
- Required condition.
- Actual condition.
- Evidence supporting the finding.
Linking Manufacturing Standards to NCR Findings
Manufacturing standards may control:
- Material condition.
- Machining tolerances.
- Surface finish.
- Heat treatment.
- Welding.
- Fabrication.
- Assembly.
- Inspection.
- Testing.
Where a manufacturing standard establishes a requirement, the NCR should trace the observed deviation to that requirement.
Objective Evidence
An NCR must be based on objective evidence.
Examples include:
- Measurement records.
- Inspection reports.
- NDT reports.
- Photographs.
- Test results.
- Material certificates.
- Calibration records.
- Welding records.
- Inspection checklists.
- Approved drawings.
- Equipment datasheets.
Objective evidence should be sufficiently detailed to allow independent verification.
Measurement Evidence
For dimensional non-conformances, the NCR should record:
- Nominal dimension.
- Required tolerance.
- Actual measurement.
- Measurement location.
- Instrument used.
- Instrument identification.
- Calibration status.
- Inspector.
- Date.
For example:
| Parameter | Requirement | Actual Result | Status |
|---|---|---|---|
| Shaft diameter | 100.00 ± 0.05 mm | 99.88 mm | Non-conforming |
| Shaft length | 450 ± 1 mm | 450.4 mm | Conforming |
| Runout | ≤ 0.03 mm | 0.07 mm | Non-conforming |
This provides clear evidence of the deviation.
NCR Structure
A professional NCR commonly contains several key sections.
NCR Identification
Include:
- NCR number.
- Project.
- Work package.
- Date.
- Department.
- Responsible organisation.
Component Identification
Record:
- Component name.
- Tag number.
- Serial number.
- Batch number.
- Drawing number.
- Material identification.
Description of Non-Conformance
Describe:
- What was found.
- Where it was found.
- How it was identified.
- Why it is outside the requirement.
Applicable Requirement
Identify:
- Drawing.
- Specification.
- Code.
- Standard.
- Procedure.
- Clause or section.
Objective Evidence
Record:
- Measurement.
- Test result.
- Inspection record.
- Photograph.
- NDT indication.
- Supporting documentation.
Immediate Containment
State what has been done to control the affected item.
Examples include:
- Quarantined.
- Tagged.
- Segregated.
- Held from installation.
- Removed from service.
Disposition
Identify the proposed or approved disposition:
- Rework.
- Repair.
- Replacement.
- Re-inspection.
- Use-as-is subject to approval.
- Reject.
Corrective Action
Identify action required to address the problem and, where appropriate, its cause.
Verification
Define how conformity or corrective-action effectiveness will be confirmed.
Writing the Description of Non-Conformance
The description should be:
- Factual.
- Specific.
- Concise.
- Evidence-based.
- Technically neutral.
- Free from assumptions.
Avoid statements such as:
- “Poor workmanship.”
- “Careless operator.”
- “Bad fabrication.”
- “Incorrectly manufactured.”
- “Very unacceptable.”
Instead, describe the measurable condition.
For example:
“Visual and dimensional inspection identified a 2.5 mm misalignment between the coupling flange and specified centreline, exceeding the approved drawing tolerance of 1.0 mm.”
This is much stronger because it explains the condition and provides measurable evidence.
Establishing the Deviation
A deviation should ideally show three elements:
Requirement + Actual Condition + Difference
For example:
- Required wall thickness: 12.0 mm minimum.
- Measured wall thickness: 10.9 mm.
- Deviation: 1.1 mm below minimum.
This provides an objective basis for the NCR.
Linking Inspection Findings to Requirements
The QA/QC professional should systematically compare inspection evidence against approved requirements.
Dimensional Inspection
Compare:
- Actual dimensions.
- Drawing dimensions.
- Tolerances.
- Geometric requirements.
Welding Inspection
Compare:
- Weld profile.
- Weld dimensions.
- Indications.
- Welding procedure requirements.
- Acceptance criteria.
Material Inspection
Compare:
- Material grade.
- Mechanical properties.
- Certification.
- Heat-treatment requirements.
NDT
Compare:
- Indication characteristics.
- Acceptance criteria.
- Required examination extent.
Example: Dimensional Non-Conformance
A machined shaft is required to have a diameter of:
80.00 ± 0.03 mm
The measured diameter is:
79.92 mm
The NCR should identify:
- Component.
- Measurement location.
- Drawing requirement.
- Actual result.
- Applicable tolerance.
- Measurement instrument.
- Inspection date.
The technical conclusion is that the measured dimension falls outside the specified tolerance.
Example: Material Non-Conformance
A component is specified for one material grade, but its material certificate identifies another grade.
The NCR should identify:
- Component.
- Required material.
- Actual material.
- Certificate number.
- Traceability number.
- Applicable material specification.
- Potential technical significance.
The NCR should not assume that the alternative material is automatically acceptable or unacceptable. An authorised technical evaluation may be required.
Example: Welding Non-Conformance
A weld inspection identifies an indication exceeding the applicable acceptance criterion.
The NCR should record:
- Weld identification.
- Joint location.
- Inspection method.
- Indication type.
- Indication dimensions.
- Acceptance requirement.
- Actual result.
- Inspection report reference.
Example: Surface Finish Non-Conformance
A machined component requires a specified surface finish.
Inspection records show that the measured surface condition exceeds the permitted value.
The NCR should connect:
Surface requirement → Measurement method → Actual reading → Permitted value → Deviation
NCR Classification
Organisations may classify NCRs according to severity.
Typical categories may include:
Minor Non-Conformance
Limited effect on conformity or function.
Major Non-Conformance
Significant failure to meet requirements or repeated process weakness.
Critical Non-Conformance
Condition presenting potentially serious consequences for safety, integrity, or essential functionality.
The classification system should follow the organisation’s approved quality procedure rather than being arbitrarily assigned.
Immediate Containment
Before final corrective action is established, the affected component may need to be controlled.
Possible containment actions include:
- Stop work.
- Hold production.
- Quarantine component.
- Prevent installation.
- Identify affected batch.
- Segregate non-conforming material.
- Suspend further processing.
- Increase inspection.
Containment prevents the non-conforming condition from progressing through the production or installation process.
Disposition of Non-Conforming Components
A non-conforming component requires an authorised disposition.
Possible decisions include:
Rework
Modify the component so that it meets the original requirement.
Repair
Restore the component’s functional condition through an approved repair method.
Replace
Remove the affected item and provide a conforming component.
Use-As-Is
Accept the existing deviation under formal technical authorisation where permitted.
Reject
Prevent the component from being used for its intended application.
Importance of Engineering Approval
Certain dispositions may require engineering approval because the deviation can affect:
- Structural integrity.
- Design margins.
- Fatigue performance.
- Pressure containment.
- Mechanical performance.
- Safety.
QA/QC personnel should not independently authorise technical deviations outside their authority.
Corrective Action Versus Correction
These terms should be distinguished.
Correction
Addresses the immediate non-conforming condition.
Example:
- Re-machine an oversized shaft.
Corrective Action
Addresses the cause of the non-conformance.
Example:
- Review machining setup, tooling, inspection frequency, and process controls to prevent recurrence.
Both may be required.
Root Cause Analysis
Repeated NCRs should trigger deeper investigation.
Possible root causes include:
- Incorrect drawing revision.
- Inadequate work instructions.
- Incorrect tooling.
- Poor process control.
- Inadequate calibration.
- Material mix-up.
- Inadequate operator training.
- Supplier control weakness.
- Inspection omission.
- Poor communication.
The NCR should provide enough information to support subsequent root cause analysis.
Traceability Across the Supply Chain
Mechanical components may pass through several stages:
Supplier → Manufacturing → Inspection → Fabrication → Assembly → Testing → Installation
The NCR should preserve traceability across these stages.
Useful identifiers include:
- Purchase order.
- Batch number.
- Heat number.
- Serial number.
- Drawing number.
- Work order.
- Inspection report.
- Material certificate.
NCR Workflow
A structured NCR process may follow:
Detection → Verification → Documentation → Containment → Requirement Traceability → Technical Review → Disposition → Corrective Action → Verification → Closure
Detection
Identify the deviation.
Verification
Confirm the condition.
Documentation
Record objective evidence.
Containment
Control the affected item.
Requirement Traceability
Identify the exact requirement.
Technical Review
Assess significance.
Disposition
Determine authorised treatment.
Corrective Action
Address the underlying issue.
Verification
Confirm implementation and effectiveness.
Closure
Formally close the NCR after required evidence is complete.
Reviewing the NCR Before Issue
Before issuing an NCR, verify:
- Correct component identification.
- Correct drawing revision.
- Correct requirement.
- Accurate measurements.
- Correct units.
- Supporting evidence.
- Clear description.
- Appropriate classification.
- Correct references.
- Appropriate distribution.
Common NCR Writing Errors
Vague Descriptions
“Component is defective” provides insufficient information.
Missing Requirement
An NCR cannot demonstrate non-conformance without identifying what requirement has been violated.
Incorrect Standard Reference
Citing an unrelated or superseded requirement weakens the report.
Unsupported Conclusions
Statements about root cause should not be presented as facts without evidence.
Excessive Personal Opinion
NCRs should focus on objective technical evidence.
Missing Measurement Information
A numerical deviation should identify the requirement and actual result.
No Traceability
A finding that cannot be linked to the component or inspection record is difficult to audit.
Key Benefits of Effective NCRs
Quality Benefits
- Stronger conformity control.
- Better defect documentation.
- Improved inspection traceability.
- More consistent quality decisions.
Engineering Benefits
- Better technical assessment.
- Improved defect evaluation.
- Stronger evidence for engineering disposition.
- Improved mechanical integrity management.
Operational Benefits
- Faster identification of affected components.
- Reduced recurrence.
- Better repair planning.
- Improved production control.
Management Benefits
- Reliable quality metrics.
- Better supplier evaluation.
- Improved trend analysis.
- Stronger management review information.
Audit Benefits
- Clear objective evidence.
- Better document traceability.
- Easier verification.
- Stronger demonstration of controlled corrective action.
NCR Data for Trend Analysis
NCRs should not remain isolated documents.
Organisations can analyse:
- Defect frequency.
- Defect type.
- Supplier.
- Manufacturing process.
- Component type.
- Production batch.
- Work area.
- Root cause.
- Corrective-action effectiveness.
Recurring patterns may identify systemic weaknesses.
Practical Example: Machined Shaft
Finding
A shaft is inspected before assembly.
Requirement
The approved drawing specifies a shaft diameter of 120.00 ± 0.04 mm.
Actual Result
Inspection records show a diameter of 119.91 mm.
NCR Traceability
The NCR records:
- Shaft serial number.
- Drawing number and revision.
- Measurement location.
- Required tolerance.
- Actual measurement.
- Inspection equipment.
- Calibration status.
Assessment
The shaft is outside the approved dimensional requirement.
Containment
The shaft is identified and prevented from assembly.
Disposition
Engineering and quality personnel determine an appropriate disposition.
Verification
After approved rework, the shaft is re-measured and the results recorded.
Practical Example: Welded Assembly
Finding
NDT identifies an indication in a fabricated mechanical assembly.
Evidence
The NDT report identifies:
- Joint number.
- Location.
- Indication type.
- Indication dimensions.
- Inspection method.
Requirement
The applicable welding acceptance criteria define a permitted limit.
NCR
The report identifies the actual indication and demonstrates that it exceeds the permitted requirement.
Follow-Up
The weld is controlled pending approved disposition.
This creates a complete technical record rather than simply recording “weld failed inspection”.
Practical Example: Material Traceability
A fabricated component is found with a material identification that does not match the approved material documentation.
The NCR should establish:
- Component identification.
- Required material.
- Actual identification.
- Material certificate.
- Heat or batch number.
- Purchase documentation.
- Applicable material requirement.
The component should be controlled until an authorised technical decision is made.
Case Study: Repeated Dimensional NCRs
Background
A manufacturing department produces precision mechanical shafts. Several shafts receive NCRs because their final diameters exceed the specified tolerance.
Initial NCR Findings
Individual NCRs identify:
- Shaft identification.
- Drawing requirement.
- Measured diameter.
- Deviation.
Trend Analysis
After several NCRs are reviewed together, the QA/QC team identifies a recurring pattern.
The defects are:
- From the same machine.
- Occurring during the same production stage.
- Concentrated in a particular batch.
- Similar in magnitude.
Investigation
The organisation reviews:
- Machine setup.
- Tool condition.
- Calibration.
- Operator instructions.
- Inspection frequency.
Root Cause
The investigation identifies inadequate tooling condition monitoring.
Corrective Action
The manufacturing process is revised to include:
- Tool-condition checks.
- Additional in-process measurement.
- Defined replacement criteria.
- Operator awareness.
Verification
Subsequent production records demonstrate improved dimensional consistency.
Lesson Learned
The NCR system has moved beyond documenting individual failures and has become a mechanism for continuous quality improvement.
Case Study: Pressure-Containing Mechanical Component
Background
A fabricated pressure-containing component is inspected before commissioning.
An inspection identifies a dimensional deviation in a critical section.
NCR Development
The QA/QC engineer records:
- Component identification.
- Drawing revision.
- Required dimension.
- Actual measurement.
- Tolerance.
- Inspection instrument.
- Inspection report.
The applicable design requirement is clearly identified.
Technical Review
The deviation is assessed for its possible effect on:
- Structural integrity.
- Pressure containment.
- Stress distribution.
- Mechanical performance.
Disposition
The component remains controlled until an authorised technical decision is made.
Lesson Learned
The NCR provides a documented link between the measured deviation and the engineering requirement, enabling an informed technical decision.
Professional Language for NCRs
Use:
- “Measured.”
- “Observed.”
- “Identified.”
- “Recorded.”
- “Exceeds.”
- “Below.”
- “Outside specified tolerance.”
- “Does not satisfy the stated requirement.”
- “Requires technical disposition.”
Avoid:
- “Bad.”
- “Poor.”
- “Careless.”
- “Obviously wrong.”
- “Unacceptable workmanship” without evidence.
- “Someone made a mistake.”
Objective language improves credibility.
Recommended NCR Evidence Checklist
Before finalising an NCR, confirm:
- Component identified.
- Serial or batch number recorded.
- Inspection activity identified.
- Actual condition documented.
- Measurement or test result recorded.
- Applicable requirement identified.
- Drawing revision verified.
- Standard or code reference confirmed.
- Relevant clause or section recorded where applicable.
- Supporting evidence attached.
- Immediate containment established.
- Disposition identified.
- Corrective action assigned.
- Verification requirements defined.
- Closure evidence recorded.
Digital NCR Management
Modern quality systems may use digital NCR platforms to improve:
- Traceability.
- Approval workflows.
- Document control.
- Evidence storage.
- Corrective-action tracking.
- Trend analysis.
- Management reporting.
However, digital systems do not replace technical judgement. The quality of the NCR still depends on the accuracy and relevance of the information entered.
Measuring NCR Effectiveness
The organisation can assess its NCR process using indicators such as:
- Number of recurring NCRs.
- Average closure time.
- Corrective-action effectiveness.
- Repeat defect rate.
- Supplier-related NCR frequency.
- First-pass acceptance rate.
- Overdue corrective actions.
- NCRs by process or component.
These indicators can reveal weaknesses in the wider QA/QC system.
Linking NCRs With Continuous Improvement
A mature quality system uses NCR information to improve processes.
The sequence can be:
NCR → Trend → Root Cause → Corrective Action → Process Improvement → Verification
This converts individual quality failures into organisational learning.
Professional Responsibilities When Raising an NCR
The QA/QC professional should:
- Remain objective.
- Protect technical integrity.
- Verify evidence.
- Use controlled documentation.
- Avoid unsupported assumptions.
- Identify the correct requirement.
- Protect affected components.
- Escalate significant conditions.
- Maintain traceability.
- Follow the approved quality process.
Key Principles for High-Quality NCRs
- Record facts rather than opinions.
- Identify the exact requirement.
- Use the correct document revision.
- Provide measurable evidence.
- Clearly identify the deviation.
- Maintain component traceability.
- Control affected items.
- Obtain appropriate technical disposition.
- Separate correction from corrective action.
- Verify corrective-action effectiveness.
- Close the NCR only when required evidence is complete.
Conclusion
A well-formulated Non-Conformance Report is a fundamental instrument for controlling mechanical quality, protecting engineering integrity, and maintaining traceability throughout manufacturing, fabrication, assembly, inspection, testing, and installation activities. Its value depends on the ability to establish an objective relationship between the actual component condition and the precise requirement that governs conformity. By identifying the affected component, recording reliable inspection evidence, referencing the correct drawing or specification revision, and tracing the deviation to an applicable design code or manufacturing standard, the NCR becomes a technically defensible quality record rather than a simple statement of failure.
Effective NCR preparation also requires disciplined control of the non-conforming item. Once a deviation has been confirmed, appropriate containment should prevent unintended use, installation, or further processing. The NCR should then support an authorised technical disposition such as rework, repair, replacement, rejection, or an approved use-as-is decision where applicable. Corrective action should address the immediate problem while also considering whether a deeper process weakness caused the deviation. This distinction is particularly important when similar NCRs occur repeatedly.
From a wider QA/QC perspective, NCRs provide valuable information for analysing manufacturing performance, supplier quality, inspection effectiveness, recurring defects, and process stability. When individual NCRs are analysed collectively, patterns can reveal weaknesses that may otherwise remain hidden. A professional NCR system therefore supports not only defect control but also root cause analysis, preventive action, continuous improvement, mechanical integrity, and operational reliability. Clear technical writing, accurate requirement traceability, objective evidence, controlled disposition, and verified corrective action together create a robust quality process capable of supporting demanding mechanical engineering operations and professional QA/QC management.
4: Map Data Trends Across Recurring Failures to Pinpoint Whether a Defect Is an Isolated Incident or Part of a Systemic Production Issue
Mapping data trends across recurring mechanical failures is an important element of advanced QA/QC management because individual defects rarely provide the complete picture of manufacturing performance. A single failed component may result from an isolated event, such as accidental damage, an unusual material condition, or a one-off equipment malfunction. However, repeated failures with similar characteristics can indicate a deeper systemic issue involving manufacturing processes, equipment condition, materials, tooling, inspection controls, work instructions, operator practices, environmental conditions, or process management. Effective trend analysis allows mechanical QA/QC professionals to distinguish isolated non-conformances from recurring patterns and establish whether corrective action should focus on one component or the wider production system.
The purpose of trend mapping is not simply to count the number of NCRs or failed inspections. Meaningful analysis requires the systematic collection, classification, comparison, and interpretation of quality data. Defects should be mapped according to relevant variables such as component type, production line, machine, batch, material, supplier, shift, operator group, process stage, defect type, location, severity, inspection method, and time period. When these variables are compared, relationships may emerge that are not visible when records are reviewed individually. For example, repeated dimensional failures concentrated around one machining centre may indicate equipment or tooling instability, while similar welding defects occurring across several machines may indicate a wider weakness in welding procedures, training, material preparation, or process control.
A robust trend-analysis approach therefore connects failure evidence with production context. The objective is to determine whether the observed defect pattern is random, localised, recurring, increasing, or systemic. This provides a stronger foundation for root cause analysis, corrective action, preventive action, process improvement, resource allocation, and management decision-making. It also supports a proactive quality culture in which organisations identify developing process weaknesses before they generate significant mechanical failures, safety risks, customer complaints, costly rework, or operational disruption.
Understanding Isolated and Systemic Failures
An isolated failure is a non-conformance that occurs independently and does not demonstrate a meaningful relationship with other production defects.
Possible characteristics include:
- Single occurrence.
- No similar historical failures.
- No concentration around a particular process.
- No repeated material association.
- No clear equipment pattern.
- No increasing trend.
- No relationship with a specific production stage.
A systemic production issue is different. It indicates that the underlying process may repeatedly produce, allow, or fail to detect similar defects.
Possible characteristics include:
- Repeated similar defects.
- Increasing defect frequency.
- Defects concentrated around one machine.
- Defects associated with one material batch.
- Recurring failures at one production stage.
- Similar defects across multiple components.
- Repeated NCRs with related root causes.
- Similar defects occurring across different shifts.
- Failure patterns linked to particular operating conditions.
The distinction is important because the corrective response should reflect the scale of the problem.
Key Definitions and Concepts
| Term | Definition | Application in Mechanical QA/QC |
|---|---|---|
| Trend | A pattern of change observed over time | Increasing dimensional failures |
| Failure Pattern | Repeated characteristics across failures | Similar weld defects |
| Isolated Incident | A single or independent non-conformance | One damaged component |
| Systemic Issue | A recurring weakness within a process or system | Repeated machining deviations |
| Recurrence | Reappearance of a similar defect | Repeated shaft diameter failures |
| Frequency | Number of occurrences within a defined period | NCRs per production month |
| Rate | Number of failures relative to production volume | Defects per 1,000 components |
| Correlation | Relationship between two variables | Defects associated with one machine |
| Root Cause | Fundamental cause of a recurring problem | Uncontrolled tooling wear |
| Process Variation | Difference in process output | Changing component dimensions |
| Baseline | Reference level used for comparison | Normal historical defect rate |
| Outlier | Result significantly different from expected behaviour | One unusually large deviation |
| Pareto Analysis | Method for ranking problems by frequency or impact | Identifying dominant defect types |
| Stratification | Separating data into meaningful categories | Comparing defects by machine |
| Systemic Failure | Repeated failure caused by process-level weakness | Recurring welding defects |
| Corrective Action | Action addressing an identified problem or cause | Process control improvement |
| Preventive Action | Action intended to prevent recurrence | Enhanced process monitoring |
| Process Capability | Ability of a process to consistently meet requirements | Stable machining tolerance |
| Recurrence Rate | Frequency of repeated defects | Repeat NCR percentage |
Why Trend Mapping Matters
A single NCR tells an organisation that something went wrong.
A trend analysis asks:
- How often does it happen?
- Where does it happen?
- When does it happen?
- Which components are affected?
- Which machines are involved?
- Which materials are involved?
- Which suppliers are involved?
- Which process stage is involved?
- Is the frequency increasing?
- Is the severity increasing?
- Has the same corrective action failed before?
These questions transform isolated quality records into useful engineering information.
From Individual Failure to System-Level Analysis
A useful analytical sequence is:
Failure → Classification → Comparison → Pattern → Correlation → Root Cause → Corrective Action
Failure
Identify the individual non-conformance.
Classification
Categorise the failure consistently.
Comparison
Compare it with previous events.
Pattern
Determine whether similar events are recurring.
Correlation
Examine relationships with production variables.
Root Cause
Investigate the underlying process weakness.
Corrective Action
Implement and verify appropriate improvement.
Establishing a Reliable Data Set
Trend analysis is only as reliable as the information being analysed.
Useful data sources include:
- NCR records.
- Inspection reports.
- NDT reports.
- Material test results.
- Dimensional inspection records.
- Production records.
- Maintenance records.
- Calibration records.
- Machine logs.
- Supplier quality records.
- Rework records.
- Scrap records.
- Customer complaints.
- Warranty data.
- Sensor data.
The data should be consistently structured so that meaningful comparisons can be made.
Important Data Fields
A mechanical QA/QC trend database may include:
- NCR number.
- Component number.
- Product type.
- Drawing number.
- Manufacturing batch.
- Material grade.
- Material batch.
- Machine ID.
- Production line.
- Production date.
- Shift.
- Process stage.
- Defect type.
- Defect location.
- Defect severity.
- Inspection method.
- Supplier.
- Operator group.
- Corrective action.
- Root cause.
- Closure date.
Data Classification
Data classification is essential because inconsistent terminology can hide patterns.
For example, the following terms may represent related defects:
- “Oversized shaft.”
- “Diameter high.”
- “Machining dimension excessive.”
- “Shaft OD above tolerance.”
If these are recorded as separate defect categories, trend analysis may underestimate the true frequency of machining-related dimensional failures.
A controlled defect taxonomy should therefore be established.
Defect Categories
Useful mechanical defect categories may include:
- Dimensional defects.
- Welding defects.
- Surface defects.
- Material defects.
- Heat-treatment defects.
- Assembly defects.
- Alignment defects.
- Calibration-related failures.
- NDT failures.
- Functional test failures.
- Documentation failures.
Subcategories can then be used for deeper analysis.
Time-Based Trend Analysis
Time is one of the most important variables.
A trend may show:
- Stable defect frequency.
- Increasing frequency.
- Decreasing frequency.
- Periodic recurrence.
- Sudden spike.
- Seasonal pattern.
- Post-maintenance increase.
- Post-process-change increase.
Example
Suppose machining NCRs are recorded as follows:
| Month | Machining NCRs | Production Units | Defect Rate |
|---|---|---|---|
| January | 4 | 1,000 | 0.40% |
| February | 5 | 1,050 | 0.48% |
| March | 6 | 1,020 | 0.59% |
| April | 11 | 1,030 | 1.07% |
| May | 14 | 1,040 | 1.35% |
The increase in both count and rate suggests that further investigation is warranted.
Why Defect Rate Is Better Than Count Alone
A raw count can be misleading when production volume changes.
For example:
- 10 failures from 10,000 units = 0.10%.
- 8 failures from 500 units = 1.60%.
Although the second period has fewer failures numerically, the defect rate is substantially higher.
Therefore, trend mapping should consider both:
Failure count + Production volume
Frequency Analysis
Frequency analysis determines how often specific defects occur.
It can identify:
- Most common defect types.
- Most affected components.
- Most affected machines.
- Most problematic suppliers.
- Most frequent process stages.
This helps prioritise investigation resources.
Pareto Analysis
Pareto analysis ranks problems according to frequency or impact.
For example:
| Defect Type | Occurrences |
|---|---|
| Dimensional deviation | 42 |
| Weld indication | 25 |
| Surface damage | 15 |
| Material mismatch | 9 |
| Assembly error | 5 |
| Other | 4 |
The analysis shows that dimensional deviation is the dominant category.
The organisation can therefore investigate machining processes first rather than distributing resources equally across all defect categories.
Stratification of Quality Data
Stratification means separating data into meaningful groups.
Data may be divided by:
- Machine.
- Production line.
- Shift.
- Supplier.
- Material.
- Component.
- Process stage.
- Date.
- Product family.
This can reveal patterns hidden within overall averages.
Example: Machine-Level Analysis
Suppose a factory operates four machining centres.
| Machine | Components Produced | Dimensional Failures | Failure Rate |
|---|---|---|---|
| M1 | 2,000 | 8 | 0.40% |
| M2 | 1,900 | 7 | 0.37% |
| M3 | 2,100 | 31 | 1.48% |
| M4 | 2,000 | 9 | 0.45% |
Machine M3 has a substantially higher failure rate.
This pattern warrants investigation into:
- Tooling.
- Calibration.
- Machine condition.
- Setup.
- Maintenance.
- Programming.
- Operator practices.
Shift-Based Analysis
Quality data can also be analysed by shift.
Potential patterns may involve:
- Increased defects during a particular shift.
- Reduced inspection coverage.
- Differences in staffing.
- Different machine settings.
- Maintenance timing.
- Handover weaknesses.
The analysis should avoid blaming individuals without evidence. The purpose is to identify process conditions associated with the pattern.
Supplier-Level Analysis
Repeated material-related failures may be linked to a supplier.
The analysis could compare:
- Supplier A.
- Supplier B.
- Supplier C.
Relevant variables include:
- Material deviations.
- Certification problems.
- Mechanical-property failures.
- Surface condition.
- Dimensional variation.
A supplier with consistently higher defect rates may require a formal quality review.
Process-Stage Mapping
Failures can be mapped against the production process:
Material receipt → Cutting → Forming → Machining → Welding → Heat Treatment → Assembly → Testing
If most defects first appear after machining, the investigation should focus on machining controls.
If defects occur after heat treatment, the heat-treatment process may require examination.
Defect Location Mapping
Physical location can provide valuable evidence.
For example, repeated defects may occur:
- At weld toes.
- Around shaft shoulders.
- Near drilled holes.
- At threaded sections.
- Around bearing seats.
- At machined transitions.
A repeated location suggests that geometry, process conditions, or local stress may be contributing.
Mapping Failure Modes
Different failure mechanisms should be tracked separately.
Examples include:
- Fatigue.
- Wear.
- Corrosion.
- Fracture.
- Deformation.
- Misalignment.
- Thermal degradation.
- Material weakness.
This allows the organisation to determine whether failures are related to manufacturing quality or operating conditions.
Distinguishing Random Variation From a Pattern
Not every repeated event represents a systemic problem.
A sound analysis should ask:
- Is the recurrence statistically meaningful?
- Is the failure rate increasing?
- Is there a concentration around one variable?
- Does the pattern persist over time?
- Is the same failure mechanism involved?
- Could the recurrence be explained by random variation?
This prevents overreaction to normal process variation.
Establishing a Baseline
A baseline represents the normal historical performance of a process.
For example:
- Normal dimensional rejection rate.
- Normal weld repair rate.
- Normal NDT indication rate.
- Normal equipment vibration.
- Normal material test failure rate.
Future results can then be compared with the baseline.
Detecting Process Drift
Process drift occurs when process performance gradually moves away from its established condition.
Examples include:
- Gradually increasing dimensional variation.
- Increasing weld repair frequency.
- Increasing surface defects.
- Increasing machine vibration.
- Increasing material test failures.
Trend analysis can identify drift before a major failure occurs.
Identifying Process Changes
A sudden increase in failures should be compared with recent process changes.
Possible changes include:
- New tooling.
- New machine.
- New supplier.
- New material.
- New work instruction.
- New software.
- New operator training.
- Maintenance intervention.
- Production rate increase.
A change-point analysis can help determine whether the failure pattern began after a specific intervention.
Correlation Analysis
Correlation examines whether two variables change together.
Examples include:
- Tool age and dimensional failures.
- Machine vibration and surface defects.
- Material batch and weld defects.
- Production speed and dimensional variation.
- Temperature and equipment failures.
Correlation does not automatically prove causation.
It identifies relationships that require further investigation.
Example: Tool Wear and Dimensional Failures
A machining process records tool usage and dimensional NCRs.
The data show that dimensional failures increase after prolonged tool use.
This suggests a possible relationship between:
Tool wear → dimensional variation → NCR
Further investigation can determine whether tool replacement criteria require improvement.
Process Capability
Process capability considers whether a process can consistently produce outputs within specified requirements.
A process that occasionally meets requirements but frequently approaches or exceeds tolerance limits may have weak capability.
Indicators may include:
- Excessive variation.
- Frequent borderline results.
- Increasing rework.
- Repeated out-of-tolerance measurements.
Control Charts and Trend Monitoring
Control charts can help identify changes in process behaviour.
They can distinguish between:
- Common-cause variation.
- Special-cause variation.
Common-Cause Variation
Variation inherent to the existing process.
Special-Cause Variation
Variation caused by a specific unusual event or condition.
Examples include:
- Machine breakdown.
- Incorrect tooling.
- Material change.
- Calibration problem.
- Process setting error.
Systemic Production Issue Indicators
A systemic issue may be indicated by:
- Repeated similar NCRs.
- Increasing failure rate.
- Multiple affected components.
- Multiple production batches affected.
- Similar defects across shifts.
- Similar failures across machines.
- Repeated corrective actions.
- High rework rates.
- Recurring customer complaints.
Isolated Incident Indicators
An isolated incident may show:
- One occurrence.
- No historical recurrence.
- No process concentration.
- No similar defects nearby.
- No unusual trend.
- No related supplier or material pattern.
However, an apparently isolated failure should still be assessed appropriately because a single event can sometimes reveal a serious latent weakness.
Investigating a Potential Systemic Issue
A structured investigation may follow:
Step 1: Define the Failure
Describe exactly what occurred.
Step 2: Search Historical Records
Look for similar events.
Step 3: Classify the Failures
Use consistent defect categories.
Step 4: Quantify Frequency
Calculate counts and rates.
Step 5: Stratify the Data
Compare machines, materials, suppliers, shifts and processes.
Step 6: Identify Patterns
Look for concentrations or trends.
Step 7: Investigate Correlations
Compare related variables.
Step 8: Identify Potential Causes
Develop evidence-based hypotheses.
Step 9: Conduct Root Cause Analysis
Test the hypotheses.
Step 10: Implement Corrective Action
Address the confirmed cause.
Step 11: Monitor Effectiveness
Check whether recurrence declines.
Practical Example: Recurring Shaft Failures
Background
A manufacturing facility produces mechanical shafts.
Several shafts fail dimensional inspection.
Initial Observation
The defects appear unrelated because they occur on different production dates.
Trend Mapping
QA/QC personnel analyse:
- Shaft diameter.
- Machine ID.
- Tool ID.
- Material batch.
- Shift.
- Operator group.
- Production date.
Finding
Most failures occur on one machining centre.
Further Analysis
The failures increase as tool usage increases.
Root Cause Investigation
Inspection identifies inadequate tooling replacement controls.
Corrective Action
The organisation introduces:
- Tool-life monitoring.
- Defined replacement criteria.
- Increased in-process inspection.
Verification
Subsequent production demonstrates a significant reduction in dimensional NCRs.
Lesson
The initial defects appeared to be individual failures, but trend mapping revealed a systemic process weakness.
Practical Example: Recurring Weld Defects
A fabrication workshop records several weld NCRs.
The defect types include:
- Lack of fusion.
- Porosity.
- Incomplete penetration.
Trend mapping reveals that lack-of-fusion defects are concentrated in one joint configuration.
The organisation examines:
- Joint preparation.
- Welding parameters.
- Procedure requirements.
- Welder qualification.
- Material condition.
The analysis suggests that joint preparation is inconsistent.
This demonstrates how defect-location and process-stage analysis can reveal systemic causes.
Practical Example: Material-Related Failures
A production facility experiences repeated hardness failures.
The failures are initially treated individually.
Trend analysis shows that most failures involve one material batch.
Further investigation identifies a heat-treatment process issue associated with that batch.
The organisation can then:
- Isolate affected material.
- Review heat-treatment records.
- Expand inspection.
- Determine affected components.
- Implement corrective action.
Practical Example: Equipment-Related Failure Pattern
A plant records increasing vibration-related mechanical failures.
Trend analysis identifies:
- Similar equipment type.
- Similar bearing configuration.
- Similar operating conditions.
- Similar maintenance interval.
The pattern suggests that the maintenance strategy may require review.
This demonstrates that recurring failures can reveal weaknesses beyond manufacturing.
Using Historical Data Effectively
Historical records should be reviewed over appropriate periods.
Depending on the process, analysis may cover:
- Weekly data.
- Monthly data.
- Quarterly data.
- Annual data.
- Multiple production cycles.
The time period should be long enough to establish a meaningful baseline.
Data Visualisation
Visualisation can make trends easier to interpret.
Useful tools include:
- Line charts.
- Pareto charts.
- Bar charts.
- Scatter plots.
- Heat maps.
- Control charts.
- Process maps.
- Defect-location diagrams.
Visualisation should support analysis rather than replace engineering judgement.
Trend Mapping Dashboard
A quality dashboard may include:
- Total NCRs.
- Defect rate.
- Repeat NCR percentage.
- Top defect categories.
- Defects by machine.
- Defects by supplier.
- Defects by process.
- Rework rate.
- Scrap rate.
- Corrective-action status.
This enables management to identify emerging problems quickly.
Corrective Action Effectiveness
After corrective action, the trend should be monitored.
For example:
| Period | NCRs Before Action | NCRs After Action |
|---|---|---|
| Month 1 | 14 | — |
| Month 2 | 16 | — |
| Month 3 | 15 | — |
| Month 4 | — | 9 |
| Month 5 | — | 6 |
| Month 6 | — | 4 |
The declining trend provides evidence that the corrective action may be effective.
However, the analysis should also consider production volume and other process changes.
Preventing False Conclusions
Trend analysis can produce misleading conclusions when:
- Data are incomplete.
- Defect classifications change.
- Production volume changes.
- Inspection frequency changes.
- New products are introduced.
- Reporting practices change.
- Data are biased.
- One variable is incorrectly assumed to cause another.
Therefore, conclusions should be evidence-based.
Root Cause Analysis From Trend Data
Trend data can provide the starting point for root cause analysis.
Useful questions include:
- Why are defects recurring?
- Why are they concentrated in one process?
- Why did the defect rate increase?
- Why did inspection fail to detect the problem earlier?
- Why did previous corrective action fail?
- Why does the same failure occur across multiple components?
These questions help move from symptoms to causes.
Fishbone Categories
Potential root causes can be grouped into:
- Manpower.
- Machine.
- Method.
- Material.
- Measurement.
- Environment.
For mechanical manufacturing, these categories can reveal interactions between production variables.
5-Why Analysis
Repeated failures can also be investigated through structured questioning.
Example:
Why did the shaft exceed tolerance?
Because machining dimensions drifted.
Why did dimensions drift?
Because cutting-tool wear was not controlled.
Why was tool wear not controlled?
Because tool replacement depended on informal judgement.
Why was there no defined replacement criterion?
Because the process procedure lacked tool-life controls.
Why did the procedure lack controls?
Because process capability had not been formally reviewed.
The analysis moves from the immediate defect towards the systemic process weakness.
Risk-Based Trend Prioritisation
Not every trend requires the same response.
Priority should increase where the trend involves:
- Safety-critical components.
- Pressure-containing equipment.
- High-speed rotating machinery.
- Structural components.
- Rapidly increasing failure rates.
- Severe consequences.
- Repeated corrective-action failure.
Key Benefits of Trend Mapping
Safety Benefits
- Earlier detection of dangerous patterns.
- Reduced likelihood of repeated failures.
- Better identification of safety-critical weaknesses.
- Improved risk-based decision-making.
Quality Benefits
- Reduced recurring defects.
- Improved process control.
- Better NCR management.
- Stronger corrective actions.
Reliability Benefits
- Improved equipment performance.
- Reduced unexpected failures.
- Better maintenance planning.
- Improved asset integrity.
Cost Benefits
- Reduced scrap.
- Lower rework.
- Reduced downtime.
- Better use of inspection resources.
- Reduced warranty costs.
Management Benefits
- Better performance visibility.
- Evidence-based resource allocation.
- Improved supplier management.
- Stronger quality objectives.
Common Errors in Trend Analysis
Looking Only at Failure Counts
Counts without production volume can be misleading.
Ignoring Defect Classification
Inconsistent terminology can hide recurring failures.
Analysing Too Short a Period
Short datasets may not reveal meaningful trends.
Ignoring Production Changes
New equipment or products can change failure patterns.
Assuming Correlation Proves Cause
A relationship requires further investigation.
Focusing Only on the Most Frequent Defect
Severity and consequence must also be considered.
Ignoring Corrective-Action History
Repeated failed actions can reveal systemic weaknesses.
Professional Trend Analysis Checklist
Before concluding that a defect is systemic, verify:
- Historical data reviewed.
- Production volume considered. Defect categories standardised.
- Similar failures identified.
- Time trends reviewed.
- Machine data reviewed.
- Material data reviewed.
- Supplier data reviewed.
- Process-stage data reviewed.
- Defect location reviewed.
- Severity considered.
- Corrective-action history reviewed.
- Potential correlations investigated.
- Root cause hypotheses tested.
- Corrective action verified.
Case Study: Identifying a Systemic Manufacturing Issue
Background
A mechanical manufacturing facility records an increasing number of rejected precision components.
Initially, each NCR is processed independently.
Initial Data
The quality department identifies:
- Dimensional deviations.
- Surface defects.
- Assembly failures.
Management initially believes the failures are unrelated.
Data Mapping
The QA/QC team categorises failures according to:
- Component.
- Machine.
- Material.
- Shift.
- Process stage.
- Defect type.
- Date.
Pattern Identification
The analysis reveals that dimensional failures have increased significantly on one machine.
Further Investigation
The team compares:
- Machine maintenance records.
- Tool replacement history.
- Calibration data.
- Operator instructions.
- Inspection frequency.
Root Cause
The investigation identifies inconsistent tooling replacement practices combined with insufficient in-process measurement.
Corrective Action
The organisation introduces:
- Tool-life controls.
- Additional inspection points.
- Updated procedures.
- Operator training.
- Machine performance monitoring.
Verification
Subsequent trend data show a sustained reduction in dimensional failures.
Outcome
What initially appeared to be multiple independent component defects was demonstrated to be a systemic process issue.
Building a Sustainable Trend-Monitoring System
A mature QA/QC system should not wait until major failures occur.
It should continuously monitor:
- Defect rates.
- NCR trends.
- Rework.
- Scrap.
- NDT indications.
- Inspection failures.
- Equipment condition.
- Supplier performance.
- Corrective-action effectiveness.
This creates a proactive quality-management approach.
Linking Trend Analysis With Continuous Improvement
Trend mapping supports the improvement cycle:
Measure → Analyse → Identify → Correct → Verify → Standardise
Measure
Collect reliable quality data.
Analyse
Identify patterns and relationships.
Identify
Determine potential process weaknesses.
Correct
Implement appropriate corrective action.
Verify
Measure the effect of the action.
Standardise
Update procedures and controls where appropriate.
Management Use of Trend Data
Senior management can use trend information to make decisions regarding:
- Capital investment.
- Equipment replacement.
- Workforce training.
- Inspection resources.
- Supplier development.
- Maintenance strategies.
- Process redesign.
- Quality objectives.
Trend analysis therefore connects shop-floor quality information with strategic operational decisions.
Key Principles for Professional Practice
- Analyse patterns rather than isolated records.
- Use consistent defect classifications.
- Consider failure rates alongside failure counts.
- Review trends over meaningful periods.
- Stratify data by relevant production variables.
- Consider component criticality.
- Distinguish correlation from causation.
- Review previous corrective actions.
- Investigate recurring defects systematically.
- Use objective evidence.
- Monitor corrective-action effectiveness.
- Escalate significant systemic patterns.
- Preserve data traceability.
- Convert quality data into process improvement.
Conclusion
Mapping data trends across recurring mechanical failures enables QA/QC professionals to determine whether a defect represents an isolated incident or evidence of a broader production weakness. Individual NCRs, inspection reports, NDT findings, dimensional results, material test records, maintenance information, and production data become considerably more valuable when they are analysed collectively. By examining frequency, rate, timing, location, component type, machine, material, supplier, process stage, and severity, organisations can identify relationships that may remain invisible when each failure is considered independently.
The distinction between an isolated incident and a systemic issue is particularly important because the required corrective response can be fundamentally different. An isolated defect may require containment, repair, or replacement of one component, while a systemic issue may require process redesign, equipment maintenance, tooling controls, supplier intervention, procedure revision, additional inspection, or broader corrective action. Trend mapping therefore helps ensure that organisations do not repeatedly treat symptoms while leaving the underlying cause unresolved.
A mature mechanical QA/QC system uses trend analysis as part of a continuous improvement cycle. Reliable data are collected, standardised, stratified, visualised, and evaluated against historical baselines. Recurring patterns are then investigated through appropriate root cause analysis, and corrective actions are monitored to determine whether failure rates actually improve. This evidence-based approach strengthens mechanical quality assurance, improves production reliability, reduces rework and waste, supports safer operations, and enables senior management to allocate resources according to demonstrated quality and operational risks.