
Lexiton International
Lexiton International Welcome to Lexiton International
Level 6 Diploma in Quality Assurance and Quality Control (QA/QC) Mechanical
Section 1: Unit 1: Advanced Quality Management Systems in Mechanical Engineering
Lesson 1: Develop and implement advanced QA/QC management systems for mechanical engineering projects. Quiz No 1: Develop and implement advanced QA/QC management systems for mechanical engineering projects. Lesson 2: Monitor and evaluate the effectiveness of mechanical quality assurance processes. Quiz No 2: Monitor and evaluate the effectiveness of mechanical quality assurance processes. Lesson 3: Apply continuous improvement principles to enhance mechanical engineering operations. Quiz No 3: Apply continuous improvement principles to enhance mechanical engineering operations. Lesson 4: Conduct internal audits and performance reviews to ensure compliance with quality standards. Quiz No 4 :Conduct internal audits and performance reviews to ensure compliance with quality standards. Lesson 5: Analyse and optimise QA/QC processes to improve efficiency, safety, and reliability. Quiz No 5: Analyse and optimise QA/QC processes to improve efficiency, safety, and reliability. Lesson 6: Recommend strategies to maintain high standards of mechanical system performance and operational excellence. Quiz No 6: Recommend strategies to maintain high standards of mechanical system performance and operational excellence.
Section 2: Unt No 2: Mechanical System Inspection and Testing Techniques
Section 3: Unit 3: Statistical Process Control and Data Analysis in Mechanical Engineering
Section 4: Unit No 4: Mechanical Components, Materials, and Reliability in QA/QC
Section 5: Unit no 5 : Compliance with International Mechanical Standards and Regulations
Section 6: Unit no 6 :Leadership, Risk Management, and Project Supervision in QA/QC Mechanical
Lesson 2

Lesson 2: Monitor and evaluate the effectiveness of mechanical quality assurance processes.

Monitoring and evaluating the effectiveness of mechanical quality assurance processes is a fundamental element of advanced QA/QC management because establishing quality procedures alone does not guarantee consistent project performance. Large-scale mechanical engineering projects involve interconnected activities such as design, procurement, material control, fabrication, welding, inspection, testing, installation, commissioning, and documentation. Each stage can influence the quality of the final mechanical asset, making continuous monitoring essential. This lesson examines how quality assurance processes can be evaluated using inspection results, quality records, performance indicators, audit findings, non-conformance trends, corrective actions, customer feedback, and management reviews to determine whether established quality objectives are being achieved.

At Level 6, learners will develop the ability to critically assess whether mechanical QA processes are operating effectively rather than simply confirming that procedures exist. This includes evaluating Inspection and Test Plans (ITPs), quality procedures, supplier controls, material inspection systems, welding quality controls, non-destructive testing, calibration arrangements, NCR management, corrective-action processes, internal audits, and quality performance indicators. Learners will explore how leading and lagging indicators can be used together to identify emerging quality problems and measure actual performance. They will also examine how trends in rework, inspection rejection, weld repairs, NCRs, supplier performance, testing failures, and corrective-action closure can provide valuable evidence about the effectiveness of mechanical quality assurance systems.

The lesson further develops professional decision-making and continual-improvement skills by showing how QA/QC professionals can use objective evidence to identify weaknesses, investigate recurring problems, evaluate corrective-action effectiveness, and recommend improvements. Learners will consider how audits, quality KPIs, inspection data, risk assessments, management reviews, and lessons learned can be integrated into an effective performance-evaluation process. By completing this lesson, learners will be better prepared to determine whether mechanical quality assurance controls are delivering their intended results and to implement evidence-based improvements that strengthen mechanical integrity, compliance, reliability, cost efficiency, project performance, and long-term quality outcomes.

1: Explain the Theoretical Foundations and Key Performance Indicators (KPIs) Used to Track the Health of Mechanical Manufacturing and Installation Processes

Monitoring the health of mechanical manufacturing and installation processes requires a structured understanding of quality theory, process performance, measurement principles, and evidence-based decision-making. In large-scale mechanical engineering projects, quality cannot be assessed only by checking completed equipment at the end of fabrication or installation. The performance of the underlying processes must also be monitored to determine whether they are stable, capable, controlled, and consistently producing results that satisfy specified requirements. Activities such as material receipt, machining, fabrication, welding, dimensional control, assembly, equipment installation, alignment, testing, and commissioning should therefore be supported by measurable quality indicators.

A modern quality management approach treats quality as a combination of planned processes, controlled operations, objective evidence, performance measurement, risk management, and continual improvement. ISO 9001 establishes performance evaluation as a core element of a quality management system and requires organisations to monitor, measure, analyse, and evaluate relevant performance and the effectiveness of the system. It also connects performance evaluation with continual improvement. For mechanical QA/QC professionals, this means that quality KPIs should not simply generate numbers for monthly reports; they should help determine whether processes are functioning as intended and where management intervention is necessary.

At Level 6, learners are expected to understand the theoretical foundations behind quality measurement and apply them to realistic mechanical engineering environments. This includes understanding process-based management, continual improvement, prevention rather than detection, statistical thinking, risk-based quality management, customer and specification requirements, leading and lagging indicators, process capability, trend analysis, audit evidence, and corrective-action effectiveness. The objective is to develop the ability to distinguish between a quality system that merely produces documentation and one that demonstrates measurable control over manufacturing and installation processes.

Theoretical Foundations of Mechanical Quality Performance

Quality as a Process-Based System

A process-based approach views mechanical manufacturing and installation as a series of interconnected activities that transform inputs into defined outputs. Quality performance is therefore influenced by the condition of the inputs, the effectiveness of the process, the competence of personnel, the suitability of equipment, the quality of information, and the effectiveness of verification.

A simplified mechanical quality process can be represented as:

Requirements → Inputs → Controlled Process → Inspection and Measurement → Results → Analysis → Improvement

For a fabricated mechanical component, inputs may include:

  • Approved drawings.

  • Material specifications.

  • Material certificates.

  • Manufacturing procedures.

  • Welding procedures.

  • Qualified personnel.

  • Calibrated inspection equipment.

  • Approved suppliers.

  • Defined acceptance criteria.

The process may include:

  • Material preparation.

  • Cutting.

  • Machining.

  • Forming.

  • Fit-up.

  • Welding.

  • Heat treatment.

  • Dimensional control.

  • Surface preparation.

  • Inspection.

  • Testing.

The outputs may include:

  • Conforming components.

  • Inspection records.

  • Test reports.

  • Material traceability records.

  • Approved quality documentation.

  • Equipment ready for installation.

Monitoring the process allows the QA/QC team to identify weaknesses before they become expensive final-product defects.

Deming’s Process and Continual Improvement Philosophy

Deming’s quality philosophy is highly relevant to monitoring mechanical process health because it emphasises process variation, management responsibility, data, and continual improvement. The fundamental concept is that organisations should understand and improve the systems that produce results rather than relying exclusively on final inspection.

In a mechanical manufacturing environment, this means that repeated defects should trigger investigation into the process rather than automatically being attributed to individual workers.

For example, if a fabrication shop experiences increasing dimensional deviations, management should investigate:

  • Machine capability.

  • Drawing interpretation.

  • Measurement methods.

  • Tool condition.

  • Operator competence.

  • Work instructions.

  • Environmental conditions.

  • Material characteristics.

  • Inspection frequency.

  • Process variation.

The KPI should therefore be used as a signal for management investigation rather than merely as a numerical score.

Juran’s Quality Trilogy

Juran’s Quality Trilogy provides another important theoretical foundation:

  • Quality planning.

  • Quality control.

  • Quality improvement.

Quality planning establishes the requirements and processes necessary to achieve conformity. Quality control compares actual performance with planned requirements. Quality improvement seeks to increase process performance and eliminate recurring causes of poor quality.

In mechanical engineering, these three elements can be connected directly to KPI management.

Quality planning may establish:

  • Weld repair targets.

  • Inspection objectives.

  • First-pass acceptance expectations.

  • Supplier performance requirements.

  • NCR targets.

  • Testing requirements.

Quality control may monitor:

  • Inspection rejection.

  • Material conformity.

  • Weld quality.

  • Dimensional accuracy.

  • Testing results.

Quality improvement may analyse:

  • Recurring NCRs.

  • Defect trends.

  • Supplier performance.

  • Rework causes.

  • Corrective-action effectiveness.

This creates a continuous relationship between planning, measurement, analysis, and improvement.

Crosby’s Prevention Philosophy

Crosby’s philosophy places strong emphasis on prevention, conformance to requirements, and the principle that quality should be built into the process rather than treated as a final inspection activity.

This principle influences KPI selection because a mature QA/QC system should monitor not only defects that have already occurred but also indicators showing whether preventive controls are functioning.

Preventive indicators may include:

  • Percentage of approved procedures available before work starts.

  • Percentage of personnel with verified competence.

  • Percentage of materials released before fabrication.

  • Percentage of inspection equipment within calibration.

  • Percentage of supplier documentation reviewed before delivery.

  • Percentage of quality plans approved before manufacturing.

These indicators help management identify weaknesses before they produce non-conforming outputs.

Understanding Key Performance Indicators

A Key Performance Indicator is a measurable value used to evaluate how effectively a process, activity, team, supplier, or management system is achieving defined objectives.

A useful mechanical QA/QC KPI should be:

  • Relevant to the quality objective.

  • Clearly defined.

  • Measurable.

  • Based on reliable data.

  • Consistently calculated.

  • Assigned to an accountable owner.

  • Reviewed at an appropriate frequency.

  • Capable of supporting a management decision.

  • Connected to an improvement opportunity.

A KPI should not exist merely because the data are easy to collect.

For example, the number of inspection reports produced may be easy to measure, but it does not necessarily demonstrate that mechanical manufacturing quality is improving. A more meaningful indicator may be first-pass acceptance, because it provides information about whether work is being completed correctly without requiring rework or repeated inspection.
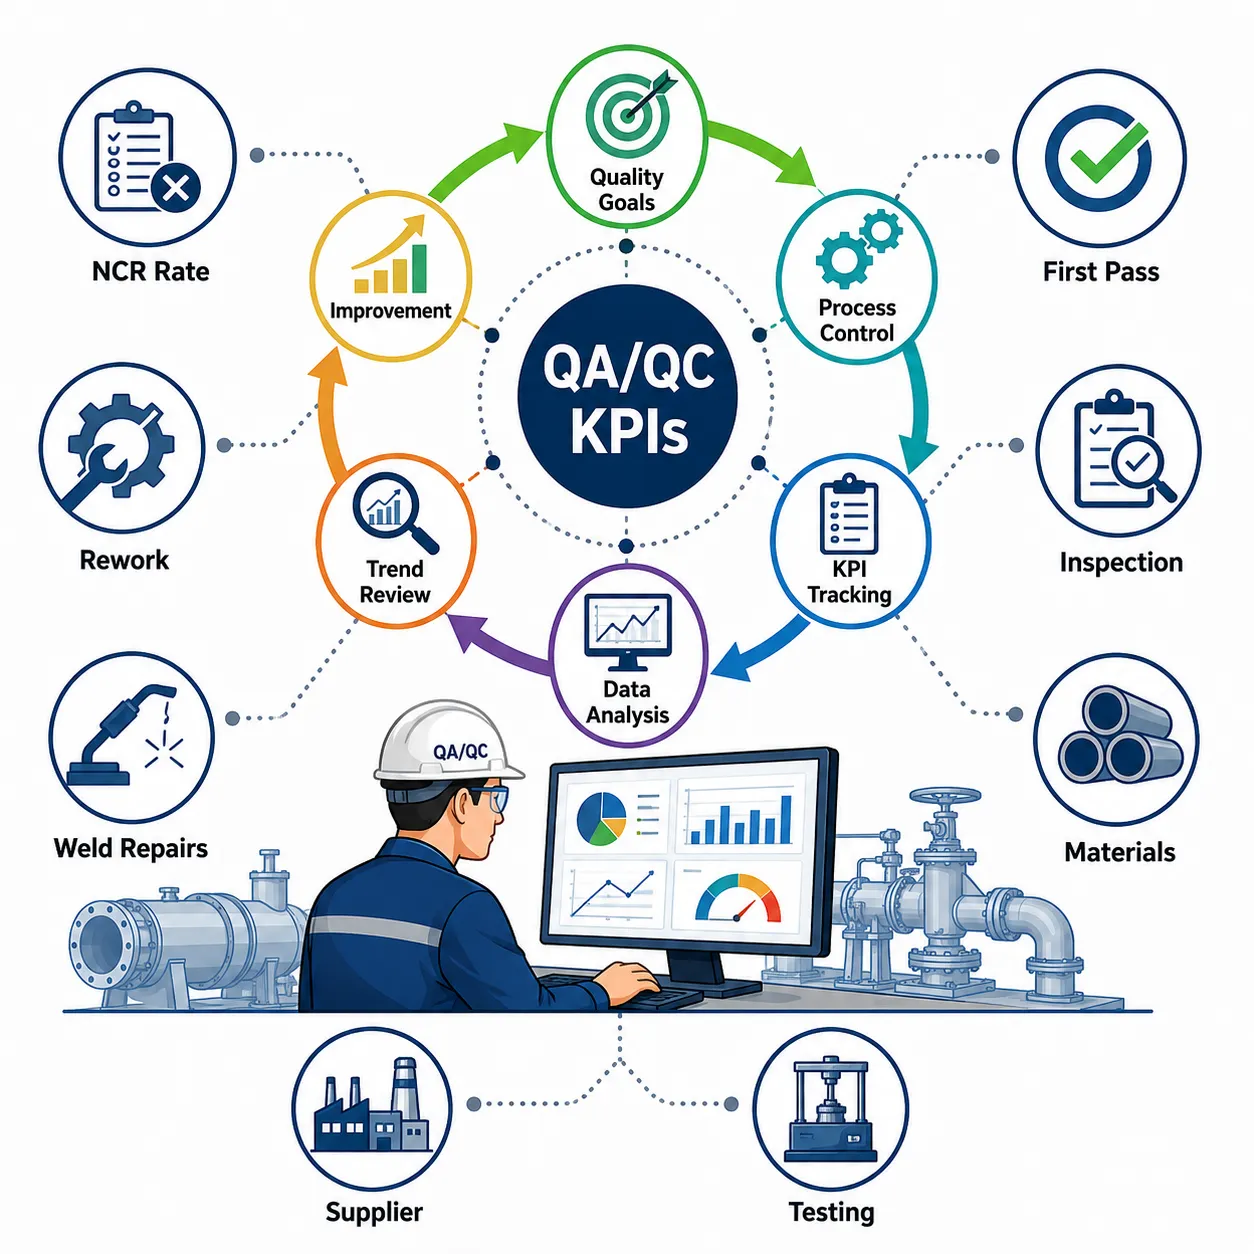
QAQC KPI Manufacturing Cycle

Leading and Lagging Quality Indicators

One of the most important theoretical distinctions in quality performance monitoring is between leading and lagging indicators.

Leading Indicators

Leading indicators provide information about conditions that may influence future quality performance.

Examples include:

  • Procedure approval before work.

  • Competency verification.

  • Supplier audit completion.

  • Material certification review.

  • Calibration compliance.

  • Planned inspection completion.

  • Preventive-action completion.

  • Training completion.

  • ITP approval status.

Leading indicators are valuable because they can identify weaknesses before defects occur.

Lagging Indicators

Lagging indicators measure outcomes after an event or failure has occurred.

Examples include:

  • NCR frequency.

  • Rework percentage.

  • Weld repair rate.

  • Inspection rejection rate.

  • Failed pressure tests.

  • Customer complaints.

  • Equipment failures.

  • Defective material incidents.

Lagging indicators are still important because they show actual quality outcomes and help identify where corrective action may be required.

Why Both Types Are Necessary

A project reporting only lagging indicators may discover problems too late.

A project reporting only leading indicators may create a false sense of control if the actual outputs are poor.

A balanced QA/QC dashboard should therefore combine:

Preventive Measures + Process Measures + Outcome Measures

This gives management a more complete understanding of process health.

Core Mechanical Manufacturing and Installation KPIs

First-Pass Acceptance Rate

First-pass acceptance measures the percentage of work accepted without requiring rework or repeated inspection.

A simplified calculation is:

First-Pass Acceptance Rate = Accepted Items at First Inspection ÷ Total Items Inspected × 100

A high first-pass acceptance rate may indicate:

  • Effective work procedures.

  • Competent personnel.

  • Clear drawings.

  • Effective supervision.

  • Good process control.

  • Appropriate inspection preparation.

However, the KPI should be interpreted with other indicators because unusually high acceptance can also result from weak inspection practices.

Non-Conformance Rate

NCR rate measures the frequency of identified non-conforming work.

It can be calculated using:

NCR Rate = Number of NCRs ÷ Defined Work Quantity × 100

The denominator should be clearly defined for the project.

Possible bases include:

  • Number of inspection activities.

  • Number of components.

  • Production hours.

  • Work packages.

  • Units manufactured.

Consistency is essential when comparing trends.

Rework Rate

Rework measures the amount of work that must be repeated or corrected because the original work did not meet requirements.

It may be expressed using:

Rework Rate = Rework Quantity ÷ Total Work Quantity × 100

High rework can indicate:

  • Poor process control.

  • Inadequate supervision.

  • Unclear technical information.

  • Poor workmanship.

  • Inadequate inspection before progression.

  • Material problems.

  • Supplier issues.

Rework is particularly important because it can affect both quality and project cost.

Weld Repair Rate

Weld repair rate is particularly relevant in mechanical fabrication.

It may be used to monitor:

  • Welding process stability.

  • Welder performance.

  • Consumable control.

  • Fit-up quality.

  • Welding procedure effectiveness.

  • Inspection trends.

A rising weld repair rate should trigger investigation rather than simply increased repair activity.

Potential investigation areas include:

  • Welding parameters.

  • Welder qualification.

  • Joint preparation.

  • Consumable storage.

  • Preheat.

  • Interpass temperature.

  • Environmental conditions.

  • Welding sequence.

  • NDT results.

Inspection Rejection Rate

Inspection rejection rate measures the proportion of inspected work that fails the defined acceptance criteria.

It can be used to identify:

  • Poor workmanship.

  • Inadequate process controls.

  • Weak supplier performance.

  • Poor preparation before inspection.

  • Inadequate technical information.

Trend analysis is more valuable than a single month’s result.

Material Conformity Rate

Material conformity measures the percentage of received materials that satisfy specified requirements.

Controls may consider:

  • Material grade.

  • Dimensions.

  • Certification.

  • Heat number.

  • Surface condition.

  • Traceability.

  • Testing requirements.

A declining material conformity rate may indicate supplier quality problems or procurement-control weaknesses.

Installation Quality KPIs

Mechanical installation processes require different indicators from manufacturing because quality depends heavily on field conditions, interfaces, alignment, assembly, and installation methodology.

Useful installation indicators include:

  • Equipment alignment acceptance rate.

  • Installation inspection acceptance rate.

  • Bolt-torque compliance.

  • Installation NCR frequency.

  • Punch-list closure rate.

  • Rework percentage.

  • Equipment preservation compliance.

  • Installation test pass rate.

  • Mechanical completion progress.

  • Documentation completion rate.

Alignment Acceptance

Alignment is particularly important for rotating equipment such as pumps and compressors.

Monitoring alignment acceptance can identify:

  • Foundation problems.

  • Installation errors.

  • Baseplate issues.

  • Incorrect measurement techniques.

  • Equipment movement.

  • Inadequate installation controls.

Repeated alignment failures should trigger process investigation rather than simply repeated adjustment.

Testing and Commissioning KPIs

Testing provides valuable information about whether mechanical equipment and systems perform as required.

Useful indicators may include:

  • Pressure-test first-pass acceptance.

  • Leak-test failure rate.

  • Functional-test pass rate.

  • Performance-test acceptance.

  • Commissioning punch-list closure.

  • Test-document completeness.

  • Equipment start-up failure rate.

Testing KPIs should be linked to the applicable project acceptance criteria and technical requirements.

Quality Audit Performance Indicators

Audits provide another important source of information about the health of a quality management system. The current ISO 19011:2026 provides guidance on management-system auditing, including audit principles, audit-programme management, risk-based approaches, conducting audits, reporting, and auditor competence.

Useful audit-related KPIs include:

  • Planned audits completed.

  • Audit findings per audit.

  • Major finding frequency.

  • Repeat finding rate.

  • Corrective-action closure time.

  • Overdue corrective actions.

  • Audit programme completion.

  • Supplier audit performance.

However, the number of findings alone should not be treated as a direct measure of quality performance.

A strong audit programme may identify more issues because it is effective at detecting weaknesses.

Supplier Quality KPIs

Mechanical projects often depend on suppliers for materials, pressure equipment, rotating equipment, fabricated components, valves, heat exchangers, and other systems.

Supplier KPIs may include:

  • Supplier NCR rate.

  • First-pass acceptance.

  • On-time quality documentation.

  • Material certificate compliance.

  • Inspection rejection rate.

  • Corrective-action closure.

  • Repeat defect rate.

  • Supplier audit findings.

  • Manufacturing surveillance findings.

  • Delivery quality performance.

Supplier performance should be evaluated using multiple indicators rather than delivery time alone.

Quality Cost Indicators

Quality performance also has financial implications.

The cost of poor quality may include:

  • Rework.

  • Repair.

  • Scrap.

  • Additional inspection.

  • Retesting.

  • Delayed commissioning.

  • Material replacement.

  • Supplier corrective actions.

  • Additional engineering.

  • Claims and disputes.

Monitoring quality cost helps management understand the commercial consequences of weak process control.

A project may therefore track:

  • Cost of rework.

  • Cost of rejected materials.

  • Cost of additional testing.

  • Cost of quality-related delays.

  • Cost of corrective actions.

  • Cost of supplier quality failures.

The purpose is not to reduce inspection expenditure at the expense of quality. Instead, quality-cost data should support better prevention and resource allocation.

KPI Measurement Process

A professional KPI system should follow a structured process.

Step 1: Define the Quality Objective

Examples include:

  • Reduce rework.

  • Improve first-pass acceptance.

  • Improve supplier quality.

  • Reduce recurring NCRs.

  • Improve testing reliability.

  • Increase traceability.

Step 2: Select the Appropriate KPI

The indicator should directly relate to the objective.

Step 3: Define the Calculation

The project should specify:

  • Numerator.

  • Denominator.

  • Measurement period.

  • Data source.

  • Inclusion criteria.

  • Exclusion criteria.

Step 4: Establish the Target

Targets should be realistic, technically justified, and aligned with project requirements.

Step 5: Assign Ownership

Each KPI should have a responsible person or function.

Step 6: Collect Reliable Data

Data should be:

  • Accurate.

  • Timely.

  • Consistent.

  • Traceable.

  • Verifiable.

Step 7: Analyse Trends

The team should examine:

  • Increasing trends.

  • Decreasing trends.

  • Recurring problems.

  • Sudden changes.

  • Departmental differences.

  • Supplier differences.

  • Work-package differences.

Step 8: Take Action

Where performance is below expectations, management should determine:

  • Cause.

  • Risk.

  • Corrective action.

  • Preventive action.

  • Responsible person.

  • Completion date.

Step 9: Verify Effectiveness

The organisation should determine whether the intervention actually improved performance.

Statistical Thinking and Process Variation

Mechanical manufacturing processes naturally experience variation. Variation can result from:

  • Machine condition.

  • Material characteristics.

  • Measurement systems.

  • Operator differences.

  • Environmental conditions.

  • Tool wear.

  • Process parameters.

The presence of variation does not automatically mean that a process is uncontrolled. The key question is whether the variation is predictable and remains within acceptable limits.

Statistical thinking encourages QA/QC professionals to distinguish between:

  • Normal process variation.

  • Special-cause variation.

Special-cause variation may arise from:

  • Equipment failure.

  • Incorrect material.

  • New operator.

  • Incorrect setup.

  • Process change.

  • Environmental event.

  • Measurement error.

A sudden increase in dimensional deviations may therefore indicate a process change requiring investigation.

Process Capability

Process capability refers broadly to the ability of a stable process to produce outputs within specified requirements.

For mechanical manufacturing, capability may be relevant to:

  • Dimensional tolerances.

  • Machining accuracy.

  • Pressure-test results.

  • Welding parameters.

  • Surface characteristics.

  • Assembly measurements.

Capability should be considered carefully because a process can be consistent but still consistently produce results outside the required specification.

The QA/QC professional should therefore evaluate both:

  • Process stability.

  • Conformance with requirements.

KPI Trend Analysis

A single KPI value rarely provides sufficient information for management decisions.

Trend analysis can reveal:

  • Gradual deterioration.

  • Sudden performance changes.

  • Recurring defects.

  • Improvement after corrective action.

  • Supplier-specific problems.

  • Process-specific weaknesses.

For example, a weld repair rate of 3% in one month may not immediately indicate a major issue. However, if the rate increases from 3% to 5%, then 8%, and finally 11%, the trend should trigger management attention.

The trend may indicate:

  • Process deterioration.

  • Workforce changes.

  • Equipment changes.

  • Material problems.

  • Increased production pressure.

  • Procedure changes.

KPI Dashboards

A mechanical QA/QC dashboard should provide management with concise but meaningful information.

A useful dashboard may contain:

  • First-pass acceptance.

  • NCR trend.

  • Rework rate.

  • Weld repair rate.

  • Inspection rejection.

  • Supplier performance.

  • Audit findings.

  • Corrective-action status.

  • Testing failures.

  • Quality cost.

  • Documentation status.

The dashboard should enable management to answer:

  • Are quality processes improving?

  • Where are defects occurring?

  • Which suppliers require attention?

  • Which activities have deteriorated?

  • Are corrective actions working?

  • Where should resources be allocated?

Leading and Lagging KPI Balance

A mature dashboard may combine:

Leading Indicators

  • Procedure readiness.

  • Training completion.

  • Competency verification.

  • Supplier audit completion.

  • Calibration compliance.

  • ITP readiness.

  • Preventive-action completion.

Process Indicators

  • Inspection completion.

  • First-pass acceptance.

  • Material conformity.

  • Process compliance.

  • Inspection response time.

Lagging Indicators

  • NCRs.

  • Rework.

  • Weld repairs.

  • Failed tests.

  • Customer complaints.

  • Equipment failures.

This layered approach provides a more complete picture of quality-system health.

Practical Example: Mechanical Fabrication Facility

Consider a fabrication facility manufacturing pressure-containing mechanical assemblies.

The QA/QC manager notices that NCRs have increased during the previous two months.

Instead of focusing only on NCR count, the team reviews:

  • First-pass acceptance.

  • Weld repair rate.

  • Material conformity.

  • Inspection rejection.

  • Welder performance.

  • Supplier quality.

  • Procedure compliance.

  • Calibration status.

The analysis shows that weld repair rates increased significantly after a new subcontract welding team was introduced.

Further investigation identifies weaknesses in:

  • Welding supervision.

  • Consumable control.

  • Fit-up inspection.

  • Procedure familiarisation.

Corrective actions are implemented and subsequent KPI monitoring shows a sustained reduction in weld repairs.

This demonstrates how KPIs can act as an early-warning mechanism rather than simply a reporting tool.

Practical Example: Mechanical Equipment Installation

A project is installing multiple centrifugal pumps.

The QA/QC team tracks:

  • Alignment first-pass acceptance.

  • Baseplate inspection.

  • Bolt verification.

  • Installation NCRs.

  • Functional test results.

  • Punch-list items.

The data show that one installation team has significantly lower first-pass alignment acceptance than other teams.

Instead of blaming individual workers, management reviews:

  • Measurement equipment.

  • Installation methodology.

  • Foundation condition.

  • Competence.

  • Supervision.

  • Work instructions.

The analysis identifies inconsistent installation methodology as the primary issue.

The procedure is standardised, personnel are briefed, and the KPI improves over subsequent installations.

Case Study: Evaluating Mechanical Process Health

Project Background

A large engineering project is manufacturing and installing pumps, compressors, heat exchangers, pressure vessels, and mechanical piping. Management initially uses only NCR totals to evaluate quality performance.

At the end of one reporting period, NCRs are relatively low, and management concludes that quality performance is strong.

Emerging Evidence

A more detailed KPI review identifies:

  • Low reported NCRs.

  • Increasing inspection rejection.

  • Increasing rework.

  • Delayed inspection requests.

  • Incomplete supplier records.

  • Increasing weld repairs.

The combined evidence indicates that the low NCR number does not represent strong quality performance.

Professional Evaluation

The QA/QC manager concludes that relying on one lagging indicator has created a misleading picture.

The project introduces a balanced dashboard containing:

  • First-pass acceptance.

  • Rework.

  • Weld repair.

  • Inspection rejection.

  • Supplier quality.

  • Material conformity.

  • NCR trends.

  • Audit findings.

  • Corrective-action effectiveness.

The new system provides management with a more realistic view of process health.

Lessons Learned

The case demonstrates several principles:

  • One KPI cannot represent total quality performance.

  • Low NCRs do not automatically indicate excellent quality.

  • Leading indicators can identify weaknesses earlier.

  • KPI trends are more informative than isolated figures.

  • Corrective actions should be evaluated using subsequent performance.

  • Quality indicators should support management decisions.

Common KPI Measurement Errors

Poorly designed KPI systems can create misleading conclusions.

Common errors include:

  • Measuring too many indicators.

  • Selecting indicators because data are easy to obtain.

  • Using unclear definitions.

  • Changing calculation methods.

  • Comparing incompatible data.

  • Ignoring denominator definitions.

  • Focusing only on lagging indicators.

  • Treating low NCRs as proof of quality.

  • Setting unrealistic targets.

  • Using KPIs to punish individuals rather than improve processes.

  • Ignoring trends.

  • Failing to investigate abnormal changes.

  • Not verifying data accuracy.

  • Failing to connect KPIs to corrective actions.

Benefits of Effective KPI Management

Quality Benefits

  • Earlier detection of process deterioration.

  • Reduced recurring defects.

  • Improved process stability.

  • Better inspection effectiveness.

  • Stronger continual improvement.

  • Improved conformity.

Manufacturing Benefits

  • Reduced rework.

  • Improved first-pass acceptance.

  • Better material utilisation.

  • Improved fabrication consistency.

  • Reduced production disruption.

Installation Benefits

  • Improved alignment.

  • Better assembly quality.

  • Reduced installation NCRs.

  • Improved testing performance.

  • Faster mechanical completion.

Management Benefits

  • Better decision-making.

  • Improved resource allocation.

  • Increased visibility.

  • Stronger supplier management.

  • Evidence-based corrective action.

Commercial Benefits

  • Reduced cost of poor quality.

  • Lower rework costs.

  • Reduced quality-related delays.

  • Better project predictability.

  • Improved client confidence.

Integrating KPIs with Audits and Management Review

KPIs should not operate independently from the wider quality management system.

Performance information should feed into:

  • Internal audits.

  • Supplier audits.

  • Management reviews.

  • Risk assessments.

  • Corrective actions.

  • Preventive controls.

  • Lessons learned.

  • Quality planning.

Audits provide another source of objective evidence about whether processes are implemented and effective. ISO 19011:2026 specifically provides guidance for audit principles, audit-programme management, risk-based auditing, conducting audits, reporting, and auditor competence.

A KPI showing increasing weld repairs may therefore trigger an audit of the welding process. An audit finding may then lead to a corrective action, and subsequent KPI performance can be used to determine whether that action was effective.

This creates a continuous cycle:

Measure → Analyse → Investigate → Correct → Verify → Improve

Professional Procedure for Monitoring Mechanical Process Health

Phase 1: Establish Objectives

  • Define quality objectives.

  • Identify critical processes.

  • Establish performance expectations.

  • Identify customer and project requirements.

Phase 2: Select KPIs

  • Identify leading indicators.

  • Identify process indicators.

  • Identify lagging indicators.

  • Define calculation methods.

  • Establish data sources.

Phase 3: Collect Data

  • Inspection records.

  • NCR records.

  • Test results.

  • Supplier reports.

  • Audit findings.

  • Rework records.

  • Material records.

  • Installation records.

Phase 4: Validate Data

  • Check accuracy.

  • Confirm consistency.

  • Verify calculations.

  • Review missing information.

  • Confirm traceability.

Phase 5: Analyse Performance

  • Compare against targets.

  • Analyse trends.

  • Identify abnormal variation.

  • Compare suppliers.

  • Compare work packages.

  • Identify recurring problems.

Phase 6: Investigate

  • Identify causes.

  • Assess risks.

  • Review process controls.

  • Conduct root-cause analysis.

  • Determine whether systemic issues exist.

Phase 7: Improve

  • Implement corrective actions.

  • Strengthen preventive controls.

  • Revise procedures.

  • Improve training.

  • Adjust inspection strategies.

  • Improve supplier controls.

Phase 8: Verify

  • Monitor subsequent performance.

  • Compare results with baseline.

  • Confirm whether improvement is sustained.

  • Close corrective actions only when effectiveness is demonstrated.

Advanced Level 6 Professional Judgement

At Level 6, KPI interpretation requires professional judgement rather than mechanical acceptance of numerical results.

A senior QA/QC professional should ask:

  • Is the KPI measuring the right thing?

  • Is the data reliable?

  • Is the trend meaningful?

  • Has the calculation method changed?

  • Are there hidden factors influencing the result?

  • Does the indicator represent process performance or merely reporting activity?

  • Is the result consistent with other evidence?

  • Does the KPI indicate an emerging risk?

  • Are corrective actions producing measurable improvement?

  • Is management responding proportionately?

For example, a reduction in NCRs could indicate better quality, but it could also indicate weaker inspection, reduced reporting, or incomplete documentation. Professional judgement requires comparison with other indicators before reaching a conclusion.

Key Takeaways

The theoretical foundations and KPI principles covered in this section demonstrate that effective mechanical QA/QC monitoring requires more than counting defects. The health of a manufacturing or installation process must be assessed using multiple forms of evidence.

Key principles include:

  • Quality should be managed through controlled processes.

  • Deming emphasises process improvement and variation.

  • Juran connects planning, control and improvement.

  • Crosby emphasises prevention and conformance.

  • KPIs should directly support defined quality objectives.

  • Leading indicators provide early warning.

  • Lagging indicators measure actual outcomes.

  • Process indicators show how work is performing.

  • First-pass acceptance can indicate process effectiveness.

  • NCRs should be interpreted alongside other indicators.

  • Rework is an important measure of cost and process performance.

  • Weld repair rates can reveal welding-process weaknesses.

  • Supplier KPIs help identify external quality risks.

  • Installation KPIs should reflect field-specific quality requirements.

  • Testing KPIs help evaluate mechanical system performance.

  • Audit findings provide additional objective evidence.

  • Trends are generally more informative than isolated measurements.

  • KPI definitions must be consistent.

  • Data quality must be verified.

  • Corrective actions should be evaluated for effectiveness.

  • Quality dashboards should support management decisions.

  • KPIs should drive improvement rather than simply produce reports.

Conclusion

The theoretical foundations of quality management provide the basis for understanding how mechanical manufacturing and installation processes should be monitored, measured, analysed, and improved. Process-based management, continual improvement, prevention, variation management, risk-based thinking, and evidence-based decision-making provide a framework through which QA/QC professionals can determine whether manufacturing and installation activities are genuinely under control. ISO 9001 places explicit emphasis on monitoring, measurement, analysis, and evaluation of quality-management-system performance and effectiveness, reinforcing the importance of structured performance evaluation.

For Level 6 mechanical QA/QC professionals, KPIs should be treated as management tools rather than simple statistics. First-pass acceptance, NCR rate, rework, weld repair rate, inspection rejection, material conformity, supplier performance, installation acceptance, testing performance, audit findings, corrective-action closure, and quality cost can collectively provide a much stronger picture of process health than any single indicator. The most effective approach combines leading, process, and lagging indicators and connects their results to audits, risk assessment, root-cause analysis, corrective actions, management review, and continual improvement. When this system is implemented effectively, mechanical engineering organisations can identify deterioration earlier, allocate quality resources more intelligently, reduce rework and defects, improve manufacturing and installation reliability, strengthen supplier performance, and provide objective evidence that project quality objectives are being achieved.

 2: Analyse Inspection Data, Non-Conformance Reports (NCRs), and Material Testing Results to Identify Structural Gaps or Systemic Errors in Current QA Processes

Analysing inspection data, non-conformance reports (NCRs), and material testing results is a fundamental activity within an effective mechanical QA/QC management system. Inspection records provide evidence of whether work is conforming to specified requirements, NCRs reveal where requirements have not been achieved, and material testing results demonstrate whether materials possess the required characteristics and properties. When these three information sources are analysed together rather than reviewed as isolated records, they can reveal recurring weaknesses, process instability, inadequate controls, supplier problems, ineffective procedures, training deficiencies, documentation failures, or systemic errors within the quality management system.

For large-scale mechanical engineering projects, simply closing individual NCRs or accepting individual inspection results is not sufficient. A Level 6 QA/QC professional must be capable of interpreting patterns and relationships within quality data. For example, repeated dimensional deviations may indicate inadequate fabrication controls, recurring weld repairs may indicate weaknesses in welding procedures or competency, and repeated material certificate discrepancies may indicate inadequate procurement or receiving-inspection controls. The purpose of analysis is therefore to move from identifying individual defects to understanding why defects occur, where controls are failing, and whether the same weakness could affect other equipment, suppliers, work packages, or project locations.

A mature quality system uses objective evidence to establish whether current QA processes are capable of consistently producing conforming results. This requires structured data collection, validation, classification, trend analysis, Pareto analysis, root-cause investigation, correlation of inspection and testing results, assessment of corrective-action effectiveness, and management review. The outcome should not simply be a statistical report. The analysis should lead to professional decisions about whether procedures need revision, inspection controls require strengthening, suppliers require intervention, personnel require additional competence development, or the overall QA/QC framework needs improvement.

Understanding the Purpose of Quality Data Analysis

Quality data analysis is the systematic examination of information generated through inspection, testing, verification, audits, NCRs, material control, and other QA/QC activities to determine whether processes are performing effectively.

The fundamental objective is to answer several questions:

  • What is happening?
  • Where is it happening?
  • How frequently is it happening?
  • When did the problem begin?
  • Is the problem increasing or decreasing?
  • What types of defects are occurring?
  • Which processes are most affected?
  • Which suppliers or work teams are involved?
  • Are defects isolated or systemic?
  • What controls should have prevented the problem?
  • Why did those controls fail?
  • Are corrective actions effective?
  • Could the same problem occur elsewhere?

This approach changes quality management from a reactive inspection function into an evidence-based management process.

Key Definitions and Concepts

TermDefinitionMechanical QA/QC Application
Inspection DataRecorded information obtained during inspection and verification activitiesUsed to determine conformity and identify performance trends
NCRFormal record of work, material, or process that does not meet a specified requirementUsed to control non-conformities and identify recurring quality problems
Material TestingExamination or testing performed to verify material properties or conformityConfirms material suitability and compliance with specified requirements
Quality TrendPattern in quality performance observed over timeHelps identify deterioration or improvement
Systemic ErrorA recurring problem caused by weaknesses within a process or management systemIndicates that individual correction alone may be insufficient
Structural GapA weakness or missing element in the QA/QC systemMay involve procedures, responsibilities, resources, controls, or interfaces
Root CauseFundamental reason why a problem occurredUsed to develop effective corrective action
RecurrenceReappearance of a similar quality problem after previous correctionIndicates potentially ineffective corrective action
Pareto AnalysisMethod of prioritising significant causes or categories based on frequency or impactHelps focus improvement resources on dominant defect categories
Trend AnalysisEvaluation of quality data over timeIdentifies changes in process performance
Data ValidationChecking quality data for accuracy, completeness, and consistencyEnsures management decisions are based on reliable information
Corrective ActionAction taken to eliminate the cause of a detected non-conformityPrevents recurrence
Preventive ControlControl designed to reduce the likelihood of a problem occurringStrengthens process reliability
Quality GapDifference between required performance and actual performanceIdentifies areas requiring improvement
Process FailureFailure of a controlled activity to achieve intended resultsIndicates weakness in process design or implementation

Relationship Between Inspection Data, NCRs, and Material Testing

These three sources of information provide different but complementary perspectives.

Inspection data primarily answers:

  • Was the work performed according to requirements?
  • Was the activity accepted at first inspection?
  • What types of deviations are occurring?
  • Which activities generate the most rejection?

NCR data answers:

  • What requirements were not achieved?
  • How significant were the failures?
  • Where did non-conformities originate?
  • Are similar failures recurring?
  • Were corrective actions effective?

Material testing data answers:

  • Does the material possess required characteristics?
  • Are material properties consistent?
  • Are material certificates accurate?
  • Are there supplier or batch-related problems?
  • Could material quality contribute to fabrication or installation defects?

When analysed together, these datasets can reveal relationships that individual records may not show.

For example:

Material Test Failure → Increased Fabrication Defects → Increased NCRs → Increased Rework

This pattern may indicate that a material-supply problem is contributing to downstream manufacturing problems.

Why Individual NCR Closure Is Not Enough

An NCR normally addresses a specific non-conformity. However, closing that NCR does not necessarily demonstrate that the underlying QA process is effective.

Consider a fabricated component that fails dimensional inspection.

The immediate corrective action may be:

  • Rework the component.
  • Re-measure the dimensions.
  • Confirm conformity.
  • Close the NCR.

However, a senior QA/QC professional should ask:

  • Why was the component incorrectly fabricated?
  • Was the drawing correct?
  • Was the latest revision used?
  • Was the measurement equipment calibrated?
  • Was the operator competent?
  • Was the manufacturing procedure adequate?
  • Was supervision sufficient?
  • Have similar components already been produced?
  • Could other work packages be affected?

The individual NCR addresses the specific failure, while systemic analysis determines whether a broader process weakness exists.

Establishing Reliable Quality Data

Quality analysis is only as reliable as the data being analysed.

Before drawing conclusions, the QA/QC team should verify:

  • Data completeness.
  • Data accuracy.
  • Consistent terminology.
  • Correct equipment identification.
  • Correct project location.
  • Correct inspection date.
  • Correct document revision.
  • Correct material identification.
  • Correct NCR classification.
  • Correct test result.
  • Valid measurement records.
  • Traceability to the relevant activity.

Poor data quality can create misleading trends.

For example, if one department records every minor defect as an NCR while another department records similar defects only as inspection comments, comparing their NCR rates would produce an inaccurate conclusion.

Classification of Inspection Data

Inspection data should be categorised consistently.

Possible categories include:

  • Accepted at first inspection.
  • Accepted after correction.
  • Rejected.
  • Re-inspection required.
  • Documentation deficiency.
  • Dimensional deviation.
  • Material issue.
  • Welding defect.
  • Assembly issue.
  • Installation defect.
  • Testing failure.
  • Traceability issue.

Further classification can consider:

  • Equipment type.
  • Supplier.
  • Subcontractor.
  • Work package.
  • Location.
  • Process.
  • Inspection stage.
  • Severity.
  • Root cause.

This makes meaningful analysis possible.

Analysing Inspection Acceptance Data

First-pass acceptance is an important indicator of process effectiveness.

A simplified calculation is:

First-Pass Acceptance Rate = Number of Items Accepted First Time ÷ Total Items Inspected × 100

A declining first-pass acceptance rate may indicate:

  • Poor workmanship.
  • Inadequate process control.
  • Unclear procedures.
  • Inadequate supervision.
  • Inadequate technical information.
  • Poor material quality.
  • Insufficient training.
  • Equipment problems.

However, the result must be interpreted alongside other evidence.

A high first-pass acceptance rate may indicate strong process control, but it may also result from:

  • Weak inspection criteria.
  • Incomplete inspection.
  • Poor reporting.
  • Inadequate inspector resources.

Professional judgement is therefore essential.

Analysing Inspection Rejection Trends

Inspection rejection trends can be examined by:

  • Date.
  • Work package.
  • Equipment.
  • Supplier.
  • Process.
  • Defect category.
  • Inspector.
  • Location.

For example, if rejection rates increase significantly after a new subcontractor begins work, supplier or subcontractor capability should be investigated.

If rejection rates increase across all subcontractors after a design revision, the design information or acceptance criteria may require review.

Analysing Non-Conformance Reports

NCR analysis should go beyond counting the number of reports.

Important analysis categories include:

  • NCR frequency.
  • NCR severity.
  • NCR type.
  • NCR source.
  • Root cause.
  • Supplier.
  • Work package.
  • Equipment.
  • Process.
  • Corrective action.
  • Closure time.
  • Recurrence.
  • Cost impact.

The QA/QC team should identify whether NCRs are:

  • Isolated.
  • Repeated.
  • Increasing.
  • Concentrated.
  • Cross-functional.
  • Supplier-specific.
  • Process-specific.

NCR Trend Analysis

A simple monthly trend may show:

MonthNCRsReworkRepeat NCRsMajor Observation
Month 112Moderate1Stable
Month 215Moderate2Increasing
Month 321High5Deteriorating
Month 426High8Systemic concern
Month 518Moderate3Improvement after action

This type of analysis is more useful than simply stating that 18 NCRs were recorded in Month 5.

The trend indicates that performance deteriorated before corrective action was introduced and subsequently improved.

Identifying Repeat NCRs

Repeat NCRs are particularly important because they may demonstrate ineffective corrective action.

For example:

  • Incorrect material identification occurs once.
  • Corrective action is introduced.
  • The same problem occurs again.
  • A similar issue appears in another work package.

This indicates that the original action may have addressed the symptom rather than the underlying cause.

Possible systemic causes include:

  • Weak material-control procedures.
  • Poor traceability.
  • Inadequate training.
  • Poor labelling.
  • Inadequate warehouse controls.
  • Weak supervision.
  • Poor document control.

Analysing NCR Root Causes

NCR root causes can be grouped into categories such as:

Human Factors

  • Competence gaps.
  • Training deficiencies.
  • Poor communication.
  • Incorrect interpretation.
  • Fatigue or workload pressure.

Process Factors

  • Inadequate procedure.
  • Missing inspection stage.
  • Weak acceptance criteria.
  • Poor process sequencing.
  • Inadequate supervision.

Equipment Factors

  • Machine condition.
  • Calibration failure.
  • Tool deterioration.
  • Measurement-system limitations.

Material Factors

  • Incorrect grade.
  • Material damage.
  • Supplier defect.
  • Poor storage.
  • Inadequate certification.

Information Factors

  • Obsolete drawing.
  • Conflicting specification.
  • Late design change.
  • Incomplete instructions.

Management Factors

  • Resource limitations.
  • Schedule pressure.
  • Poor planning.
  • Weak supplier control.
  • Inadequate quality leadership.

This classification helps determine whether problems are isolated or systemic.

Pareto Analysis of Quality Problems

Pareto analysis can help determine which categories contribute most significantly to quality problems.

For example, an analysis may show:

  • Welding defects: 38%.
  • Dimensional defects: 24%.
  • Material issues: 16%.
  • Documentation errors: 12%.
  • Installation defects: 10%.

The result suggests that welding-related problems should receive priority.

However, the highest-frequency defect is not automatically the highest-risk issue. A less frequent defect with severe consequences may require greater management attention.

Therefore, Pareto analysis should be combined with:

  • Risk assessment.
  • Severity.
  • Equipment criticality.
  • Cost.
  • Safety significance.
  • Project impact.

Material Testing Result Analysis

Material testing provides objective evidence about material characteristics and suitability.

Depending on project requirements, relevant testing may involve:

  • Chemical composition.
  • Mechanical properties.
  • Hardness.
  • Tensile strength.
  • Impact properties.
  • Dimensional verification.
  • Metallurgical characteristics.
  • Surface condition.
  • Other specified material properties.

The QA/QC professional should verify that testing results are:

  • From approved sources.
  • Traceable to the correct material.
  • Consistent with certification.
  • Within specified acceptance criteria.
  • Properly documented.
  • Associated with the correct batch, heat, lot, or component where applicable.

Identifying Material Systemic Problems

A single failed material test does not automatically prove that the entire supplier process is defective.

However, repeated failures may indicate:

  • Supplier manufacturing problems.
  • Inadequate procurement specifications.
  • Poor material verification.
  • Inadequate receiving inspection.
  • Incorrect storage.
  • Material substitution.
  • Weak traceability.

The analysis should determine whether the issue is isolated or part of a broader pattern.

Correlating Material Testing with Manufacturing Defects

One of the most valuable analytical activities is comparing material-test results with downstream manufacturing performance.

For example:

Material Batch A

  • Conforming test results.
  • Low weld repair.
  • Low dimensional rejection.

Material Batch B

  • Marginal or failed testing.
  • Increased welding difficulty.
  • Increased fabrication defects.
  • Higher NCR frequency.

This correlation may indicate that material characteristics are influencing manufacturing performance.

Further engineering investigation would be required before establishing causation.

Detecting Structural Gaps in QA Processes

A structural gap exists when an important part of the quality system is missing, inadequate, unclear, or ineffective.

Potential structural gaps include:

  • No defined inspection responsibility.
  • Inadequate supplier qualification.
  • Missing material-verification controls.
  • Weak document control.
  • Incomplete ITPs.
  • Missing hold points.
  • Inadequate acceptance criteria.
  • Poor calibration control.
  • Inadequate competency requirements.
  • Weak NCR escalation.
  • Poor corrective-action verification.
  • Incomplete audit coverage.

Structural gaps are different from individual errors because they relate to the design or functioning of the QA system itself.

Identifying Systemic Errors

A systemic error is a recurring or widespread failure arising from the way the system operates.

Indicators may include:

  • Same defect occurring repeatedly.
  • Similar NCRs across different teams.
  • Repeated supplier failures.
  • Recurring documentation problems.
  • Repeated testing failures.
  • Multiple departments experiencing the same issue.
  • Corrective actions failing to prevent recurrence.

When a defect appears across different personnel and locations, the QA/QC team should consider whether the process itself is the common factor.

Root-Cause Analysis

Root-cause analysis should be used when data indicate a significant or recurring problem.

Methods may include:

  • Five Whys.
  • Cause-and-effect diagrams.
  • Fault-tree analysis.
  • Process mapping.
  • Pareto analysis.
  • Barrier analysis.
  • Failure Mode and Effects Analysis.

Five Whys Example

Problem:

Equipment alignment repeatedly fails inspection.

Why?

Because alignment is outside tolerance.

Why?

Because the installation method is inconsistent.

Why?

Because different teams use different procedures.

Why?

Because the project has not standardised the installation methodology.

Why?

Because the QA/QC system does not contain a controlled standard installation procedure.

The systemic cause is therefore not simply “poor alignment”. It is a weakness in process standardisation.

Linking Inspection Data with Audit Findings

Inspection data can reveal that a process is underperforming, while an audit can determine whether the management system behind that process is being implemented effectively.

For example:

Inspection data:

  • Increasing weld repairs.

Audit findings:

  • Welding procedure not consistently available at workstations.
  • Consumable storage records incomplete.
  • Welder competency records not consistently controlled.

Together, these findings provide stronger evidence of a systemic weakness.

Analysing Corrective-Action Effectiveness

Corrective actions should not be considered successful merely because an action has been completed.

The QA/QC team should ask:

  • Did the defect stop recurring?
  • Did related indicators improve?
  • Did similar work remain conforming?
  • Was the root cause addressed?
  • Were affected procedures updated?
  • Was personnel competence improved?
  • Did supplier performance improve?

Effectiveness should therefore be verified using subsequent quality data.

Practical Example: Repeated Welding Defects

Situation

A fabrication project records increasing weld repair rates.

Initial analysis identifies:

  • Higher repair rates among a newly appointed subcontractor.
  • Increased lack-of-fusion indications.
  • Several repeat NCRs.
  • Increased inspection rejection.

Investigation

The QA/QC team reviews:

  • Welding procedures.
  • Welder qualifications.
  • Consumable control.
  • Fit-up inspection.
  • Preheat requirements.
  • Welding parameters.
  • Supervision.
  • NDT records.

The investigation identifies inconsistent control of welding parameters.

Corrective Action

The project implements:

  • Increased welding surveillance.
  • Refresher competency verification.
  • Improved parameter monitoring.
  • Additional fit-up checks.
  • Controlled consumable management.

Effectiveness Evaluation

Subsequent data show:

  • Reduced weld repair rate.
  • Reduced repeat NCRs.
  • Improved first-pass acceptance.
  • Fewer NDT failures.

This provides evidence that the corrective action was effective.

Practical Example: Material Certification Problems

Situation

Several stainless-steel components are delivered with incomplete certification.

The receiving team records individual NCRs.

Initial Response

Each supplier document is corrected separately.

Further Analysis

The QA/QC manager identifies that similar documentation issues occur across several suppliers.

This suggests that the problem may not be supplier-specific.

Systemic Investigation

The project reviews:

  • Purchase specifications.
  • Supplier documentation requirements.
  • Procurement communication.
  • Document-control procedures.
  • Receiving-inspection checklists.
  • Material-release process.

The analysis identifies unclear certification requirements in procurement documentation.

Improvement

The project revises:

  • Purchase specifications.
  • Supplier quality requirements.
  • Material receiving checklist.
  • Document review procedure.

The result is a reduction in certification-related NCRs.

Practical Example: Dimensional Inspection Failures

A fabrication shop reports repeated dimensional deviations.

The QA/QC team analyses:

  • Inspection reports.
  • Measurement records.
  • Machine settings.
  • Drawing revisions.
  • Operator records.
  • Calibration certificates.
  • Rework records.

The data show that most defects occur on one machine after extended production periods.

Further investigation identifies tool wear.

The appropriate response is therefore not simply additional inspection. The process requires:

  • Tool-condition monitoring.
  • Preventive maintenance.
  • Defined replacement criteria.
  • Additional dimensional checks after maintenance.

This demonstrates how inspection data can reveal an equipment-related systemic cause.

Case Study: Systemic QA Gap in Mechanical Manufacturing

Project Background

A large mechanical engineering project is manufacturing heat exchangers, pressure vessels, piping assemblies, and rotating equipment. The project has a formal QA/QC system containing procedures, ITPs, inspection forms, NCR processes, and supplier controls.

Despite this, the project begins experiencing increasing rework.

Available Data

The QA/QC team reviews:

  • Inspection records.
  • NCRs.
  • Material testing.
  • Supplier performance.
  • Weld repair rates.
  • Dimensional inspection.
  • Testing results.

Findings

The analysis identifies:

  • Increasing first-pass inspection failures.
  • Repeated dimensional defects.
  • Increased welding repairs.
  • Several material-documentation problems.
  • Repeat NCRs from multiple subcontractors.

Analysis

The team initially considers individual workmanship as the main cause.

However, cross-functional analysis identifies a more significant problem:

  • Several teams are working from different technical-document revisions.
  • Procedures are not consistently communicated.
  • Material release information is not visible to fabrication teams.
  • Inspection preparation is inconsistent.

Systemic Gap

The root issue is therefore a weakness in the integration of:

  • Document control.
  • Material control.
  • Construction communication.
  • Inspection readiness.

Corrective Strategy

The project implements:

  • Controlled document distribution.
  • Updated inspection-readiness requirements.
  • Improved material-release status.
  • Daily QA/QC coordination.
  • Increased review of critical work packages.
  • Trend monitoring.

Outcome

Subsequent monitoring demonstrates:

  • Improved first-pass acceptance.
  • Reduced rework.
  • Reduced repeat NCRs.
  • Better material traceability.
  • Improved inspection readiness.

The case demonstrates that quality problems should not automatically be attributed to individuals. When similar problems occur across teams, the QA/QC professional should investigate the wider system.

Data Analysis Process for Senior QA/QC Professionals

Step 1: Define the Problem

Clearly establish:

  • What is failing?
  • Where?
  • When?
  • How often?
  • Which requirement is affected?

Step 2: Gather Evidence

Collect:

  • Inspection records.
  • NCRs.
  • Test results.
  • Material certificates.
  • Audit findings.
  • Rework records.
  • Supplier information.
  • Training records.
  • Calibration records.

Step 3: Validate Data

Check:

  • Completeness.
  • Accuracy.
  • Consistency.
  • Traceability.
  • Correct classification.

Step 4: Categorise Results

Group by:

  • Defect type.
  • Process.
  • Supplier.
  • Equipment.
  • Location.
  • Work package.
  • Severity.

Step 5: Analyse Trends

Identify:

  • Increasing trends.
  • Decreasing trends.
  • Repetition.
  • Clusters.
  • Abnormal variation.

Step 6: Prioritise

Consider:

  • Frequency.
  • Severity.
  • Risk.
  • Cost.
  • Equipment criticality.
  • Recurrence.

Step 7: Investigate Causes

Use appropriate root-cause techniques.

Step 8: Identify System Gaps

Review:

  • Procedures.
  • Responsibilities.
  • Resources.
  • Competence.
  • Communication.
  • Inspection controls.
  • Supplier controls.

Step 9: Implement Corrective Action

Actions should address verified causes.

Step 10: Verify Effectiveness

Use subsequent data to determine whether performance improved.

Benefits of Analysing Quality Data

Quality Benefits

  • Early identification of systemic problems.
  • Reduced recurring defects.
  • Improved process control.
  • Stronger preventive action.
  • Better inspection effectiveness.
  • Improved material quality management.

Manufacturing Benefits

  • Reduced rework.
  • Improved first-pass acceptance.
  • Better fabrication consistency.
  • Reduced material waste.
  • Improved production reliability.

Installation Benefits

  • Reduced installation defects.
  • Improved alignment.
  • Better assembly quality.
  • Improved testing performance.
  • Reduced commissioning problems.

Management Benefits

  • Evidence-based decision-making.
  • Better allocation of QA/QC resources.
  • Improved supplier management.
  • Stronger risk identification.
  • Better performance monitoring.

Commercial Benefits

  • Lower cost of poor quality.
  • Reduced rework costs.
  • Reduced schedule disruption.
  • Lower material waste.
  • Improved project predictability.

Common Mistakes in Quality Data Analysis

Senior QA/QC professionals should avoid:

  • Counting NCRs without analysing causes.
  • Treating every defect as an isolated event.
  • Ignoring inspection trends.
  • Ignoring material-test patterns.
  • Using incomplete datasets.
  • Comparing inconsistent measurements.
  • Focusing only on frequency.
  • Ignoring severity.
  • Closing NCRs without effectiveness verification.
  • Blaming individuals without systemic investigation.
  • Using unreliable data.
  • Ignoring supplier trends.
  • Failing to analyse repeat NCRs.
  • Taking corrective action without root-cause analysis.
  • Assuming low NCR numbers prove quality effectiveness.

Distinguishing Individual Error from Systemic Error

This distinction is particularly important at Level 6.

An individual error may involve:

  • One incorrect measurement.
  • One documentation mistake.
  • One isolated handling error.

A systemic problem may involve:

  • Repeated measurement errors.
  • Multiple teams using incorrect documents.
  • Repeated material traceability failures.
  • Recurring supplier defects.
  • Repeated failures after corrective action.

The professional response should differ accordingly.

Individual error may require:

  • Correction.
  • Coaching.
  • Competence verification.

Systemic error may require:

  • Procedure revision.
  • Process redesign.
  • Training programme changes.
  • Supplier intervention.
  • Additional controls.
  • Management action.

Integrating Analysis with Risk Management

Quality-data analysis should feed directly into risk assessment.

For example:

Increasing weld repairs may increase the assessed risk of:

  • Structural weakness.
  • Pressure-boundary defects.
  • Schedule delay.
  • Increased rework.
  • Commissioning failure.

Repeated material-test failures may increase risks associated with:

  • Mechanical integrity.
  • Corrosion resistance.
  • Welding performance.
  • Equipment reliability.

This means quality data should be considered during risk-register reviews and quality planning.

Integrating Analysis with Continual Improvement

A mature QA/QC system operates as a cycle:

Collect → Validate → Analyse → Identify → Investigate → Correct → Verify → Improve

The cycle should continue throughout the project.

Continual improvement may involve:

  • Revising procedures.
  • Improving inspection plans.
  • Updating training.
  • Strengthening supplier requirements.
  • Changing material controls.
  • Improving document management.
  • Adjusting inspection frequency.
  • Introducing additional preventive controls.

Advanced Professional Judgement

At Level 6, learners should understand that data analysis is not simply a mathematical exercise. Professional judgement is required to interpret evidence within its technical and project context.

A senior QA/QC professional should consider:

  • Is the sample representative?
  • Is the trend statistically meaningful?
  • Has the inspection method changed?
  • Has the workforce changed?
  • Has the supplier changed?
  • Has the design changed?
  • Has production increased?
  • Have acceptance criteria changed?
  • Is the measurement system reliable?
  • Are defects being reported consistently?
  • Is the issue isolated or systemic?

For example, a sudden increase in NCRs could represent deterioration in quality, but it could also result from improved inspection effectiveness. The professional must therefore compare NCR trends with inspection coverage, audit results, rework, testing outcomes, and other quality indicators.

Key Takeaways

The analysis of inspection data, NCRs, and material testing results enables QA/QC professionals to identify weaknesses that may not be visible through individual inspections.

The most important principles include:

  • Quality data must be accurate and traceable.
  • Inspection data should be analysed for trends.
  • NCRs should be classified and reviewed systematically.
  • Repeat NCRs require particular attention.
  • Material testing provides important evidence of conformity.
  • Quality data should be analysed across suppliers and work packages.
  • Pareto analysis can identify dominant defect categories.
  • Root-cause analysis should address systemic causes.
  • Corrective actions must be checked for effectiveness.
  • Structural gaps may involve procedures, resources, responsibilities, or controls.
  • Systemic errors require broader intervention than individual mistakes.
  • Low NCR numbers do not automatically demonstrate strong quality.
  • Frequency must be considered alongside severity and risk.
  • Data analysis should feed into risk management.
  • Quality analysis should support continual improvement.
  • Professional judgement is essential when interpreting trends.
  • Inspection, NCR, and material data should be analysed together where appropriate.

Conclusion

Analysing inspection data, NCRs, and material testing results provides a powerful mechanism for evaluating the effectiveness of mechanical QA processes and identifying structural gaps or systemic errors. Inspection data shows how work is performing against defined acceptance criteria, NCRs identify failures to achieve specified requirements, and material testing provides evidence about the conformity and suitability of materials. When these datasets are analysed together, QA/QC professionals can identify recurring defects, supplier weaknesses, process variation, documentation failures, ineffective corrective actions, and broader management-system weaknesses.

For Level 6 mechanical QA/QC professionals, the most important capability is the ability to move beyond individual defect correction and determine whether the quality system itself is capable of preventing recurrence. This requires reliable data collection, consistent classification, trend analysis, root-cause investigation, Pareto analysis, material-result correlation, risk assessment, and verification of corrective-action effectiveness. A mature QA/QC system should continuously convert inspection and testing information into management knowledge and then convert that knowledge into practical improvement. When implemented effectively, this approach reduces recurring non-conformities, improves manufacturing and installation reliability, strengthens material control, reduces rework and cost of poor quality, supports evidence-based decision-making, and ultimately improves the integrity and performance of mechanical engineering projects.

3: Perform Direct Field Evaluations and Process Checks to Measure How Well Standard Operating Procedures Are Being Executed on the Workshop Floor or Construction Site

Direct field evaluation is a fundamental component of an effective mechanical QA/QC management system because approved procedures and documented instructions only provide value when they are correctly implemented during actual work. A Standard Operating Procedure (SOP), Work Instruction, Method Statement, Inspection and Test Plan (ITP), welding procedure, material-control procedure, installation procedure, or testing procedure may be technically comprehensive, but the real measure of process effectiveness is what happens at the point of work. Direct field evaluation enables QA/QC professionals to observe actual practices, compare them with approved requirements, identify deviations, verify process controls, and determine whether personnel have the competence, resources, information, and supervision necessary to perform work correctly.

In mechanical manufacturing and construction environments, field evaluations may take place in fabrication workshops, machining areas, welding stations, material storage areas, equipment assembly zones, mechanical installation locations, testing areas, and commissioning work fronts. The evaluation should examine both the physical work and the management controls supporting it. This includes checking whether the current procedure is available, whether the correct drawing revision is being used, whether materials are properly identified, whether equipment is calibrated, whether personnel are following specified sequences, whether inspection points are respected, and whether records accurately reflect actual site conditions. The objective is not simply to find mistakes but to determine whether the QA process is functioning as designed.

At Level 6, learners should understand that direct field evaluation requires professional judgement and systematic evidence collection. A QA/QC professional must distinguish between a minor isolated deviation, a significant non-conformance, a procedural weakness, and a systemic failure. Effective field evaluation therefore connects observation with inspection data, NCR trends, risk assessments, competency requirements, process performance indicators, corrective actions, and continual improvement. When performed correctly, field process checks provide a direct link between the documented quality management system and real mechanical engineering activities, helping organisations prevent defects, reduce rework, strengthen compliance, and improve the reliability of manufacturing and installation processes.

Understanding Direct Field Evaluation

Direct field evaluation is the systematic observation and assessment of work activities at the location where manufacturing, installation, inspection, testing, or other mechanical processes are being performed.

It allows the QA/QC professional to determine:

  • Whether approved procedures are being followed.
  • Whether personnel understand the applicable requirements.
  • Whether the correct materials are being used.
  • Whether equipment and tools are suitable.
  • Whether measurement equipment is calibrated.
  • Whether required inspection points are being respected.
  • Whether work is being performed in the specified sequence.
  • Whether records accurately represent actual work.
  • Whether process controls are effective.
  • Whether deviations are being identified and controlled.

The evaluation should be objective and evidence-based. Personal assumptions should not replace direct observation, documented requirements, measurement results, or other verifiable evidence.

Why Field Process Checks Are Important

A quality management system can appear effective when reviewed through documentation but perform poorly at the point of execution. This can happen when:

  • Workers have not received the latest procedure.
  • Supervisors rely on previous practices.
  • Drawings have been revised.
  • Materials are incorrectly identified.
  • Tools are unavailable.
  • Inspection equipment is out of calibration.
  • Production pressure encourages shortcuts.
  • Personnel misunderstand acceptance criteria.
  • Work instructions are unclear.
  • Subcontractors follow their own uncontrolled practices.

Direct field evaluation identifies these gaps before they become larger quality failures.

For example, a fabrication procedure may require dimensional verification at several stages. A document review may confirm that the procedure exists and has been approved. A field evaluation can determine whether workers actually perform those measurements at the specified stages.

This distinction is critical:

Documentation demonstrates what should happen.

Field evaluation demonstrates what is actually happening.

Key Definitions and Concepts

TermDefinitionApplication in Mechanical QA/QC
Field EvaluationDirect assessment of work at the location of executionDetermines whether procedures are being implemented correctly
Process CheckVerification that a defined process is being performed according to requirementsConfirms operational control
SOPControlled instruction describing how a routine activity should be performedProvides standardised working requirements
Work InstructionDetailed instruction for performing a specific taskGuides personnel at the point of work
Method StatementDocument describing how a particular activity will be executedProvides controlled execution methodology
ObservationObjective information obtained through direct viewing or verificationProvides evidence of actual practice
Process DeviationDifference between required and actual process executionMay require correction or formal non-conformance
ComplianceFulfilment of specified requirementsDemonstrates conformity with procedures and standards
Process EffectivenessAbility of a process to achieve intended results consistentlyIndicates whether controls are working
CompetenceDemonstrated ability to apply knowledge and skills to achieve required resultsImportant for welders, inspectors, technicians and operators
VerificationConfirmation through objective evidence that requirements have been fulfilledUsed throughout field inspections
SurveillancePlanned monitoring of work activities to assess ongoing conformityProvides continuous quality oversight
Field InspectionExamination of physical work and associated recordsConfirms actual condition and compliance
Process AuditSystematic evaluation of whether a defined process is implemented effectivelyIdentifies procedural and systemic weaknesses

Field Evaluation Versus Final Inspection

Direct field evaluation should not be confused with final product inspection.

Final inspection generally asks:

  • Does the completed item meet the acceptance criteria?

Field process evaluation asks:

  • Was the process capable of producing the required result?
  • Were the correct controls applied?
  • Were personnel following the procedure?
  • Were required checks completed at the correct stage?
  • Were deviations identified promptly?

Both activities are important.

Final inspection detects conformity or non-conformity.

Process evaluation helps prevent non-conformity.

A mature QA/QC system therefore uses both approaches.

The Process-Based Field Evaluation Model
QAQC Workshop Process Infographic

A useful model is:

Requirements


Approved Procedure


Personnel Competence


Resources and Equipment


Process Execution


Inspection and Measurement


Recorded Evidence


Evaluation


Corrective Action


Verification


Continual Improvement

This model allows the QA/QC professional to examine the complete process rather than concentrating only on the final physical product.

Preparing for a Field Evaluation

Effective field evaluation begins before entering the workshop or construction area.

The QA/QC professional should review:

  • Approved SOPs.
  • Method statements.
  • Work instructions.
  • ITPs.
  • Approved drawings.
  • Material specifications.
  • Relevant inspection requirements.
  • Previous NCRs.
  • Previous audit findings.
  • Quality KPIs.
  • Risk assessments.
  • Supplier performance.
  • Corrective actions.
  • Applicable project requirements.

This preparation allows the evaluator to focus on known quality risks.

Identifying Critical Process Controls

Not every process step has equal significance.

The evaluator should identify critical controls such as:

  • Material identification.
  • Dimensional tolerances.
  • Welding parameters.
  • Heat treatment.
  • Equipment alignment.
  • Bolt tightening.
  • Surface preparation.
  • Pressure testing.
  • NDT.
  • Calibration.
  • Preservation.
  • Traceability.

The field evaluation should give particular attention to controls where failure could significantly affect:

  • Mechanical integrity.
  • Safety.
  • Reliability.
  • Contractual compliance.
  • Testing.
  • Commissioning.
  • Project schedule.

Conducting the Field Evaluation

A structured field evaluation can follow several stages.

Stage 1: Entry and Scope Confirmation

Confirm:

  • Work location.
  • Activity being performed.
  • Responsible supervisor.
  • Applicable procedure.
  • Equipment or component identification.
  • Evaluation scope.

The evaluator should avoid interrupting critical operations unnecessarily and should follow site safety requirements.

Stage 2: Verify Applicable Documents

Check that personnel have access to:

  • Current procedure.
  • Current drawing.
  • Current specification.
  • Approved ITP.
  • Relevant inspection criteria.
  • Applicable work instructions.

The evaluator should verify revision status rather than assuming the document is current.

Stage 3: Observe Actual Work

Observe the activity without immediately directing the worker unless there is an immediate safety or quality concern.

Look for:

  • Actual sequence.
  • Personnel actions.
  • Equipment settings.
  • Material handling.
  • Measurement methods.
  • Inspection practices.
  • Use of tools.
  • Housekeeping affecting quality.
  • Traceability.
  • Process controls.

Stage 4: Compare Actual Practice with Requirements

Compare observed work against:

  • Procedure.
  • Drawing.
  • Specification.
  • ITP.
  • Acceptance criteria.
  • Approved method statement.

Differences should be documented objectively.

Stage 5: Interview Personnel

Ask personnel questions such as:

  • Which procedure are you using?
  • What is the current drawing revision?
  • What are the critical acceptance criteria?
  • What inspection is required before the next step?
  • What should you do if the material identification is unclear?
  • Who should approve a deviation?

This helps determine whether personnel understand the requirements rather than simply having access to documents.

Stage 6: Verify Records

Check whether actual work is supported by appropriate evidence.

Records may include:

  • Inspection reports.
  • Material certificates.
  • Weld records.
  • NDT reports.
  • Calibration certificates.
  • Test records.
  • Equipment checklists.
  • Competency records.

Stage 7: Record Findings

Findings should be:

  • Factual.
  • Specific.
  • Traceable.
  • Objective.
  • Relevant.
  • Clearly classified.

Stage 8: Determine Required Action

Depending on the finding, action may involve:

  • Immediate correction.
  • Additional inspection.
  • Rework.
  • NCR.
  • Procedure clarification.
  • Training.
  • Increased surveillance.
  • Root-cause analysis.
  • Management escalation.

Stage 9: Verify Closure

The evaluator should confirm that corrective actions were actually implemented and effective.

Workshop Floor Evaluation

Manufacturing workshops contain multiple processes that require direct quality monitoring.

Typical activities include:

  • Material cutting.
  • Machining.
  • Forming.
  • Welding.
  • Grinding.
  • Heat treatment.
  • Surface preparation.
  • Dimensional inspection.
  • Assembly.
  • Pressure testing.

Material Preparation

The evaluator should check:

  • Correct material identification.
  • Heat or batch traceability.
  • Approved material.
  • Correct dimensions.
  • Protection against damage.
  • Correct storage.
  • Controlled material movement.

Potential warning signs include:

  • Unidentified material.
  • Mixed material grades.
  • Missing traceability.
  • Damaged surfaces.
  • Uncontrolled substitutions.

Machining

Process checks may examine:

  • Correct drawing revision.
  • Machine setup.
  • Tool condition.
  • Dimensional controls.
  • Measurement equipment.
  • Tolerance requirements.
  • Inspection frequency.

Repeated machining deviations may indicate:

  • Tool wear.
  • Machine instability.
  • Incorrect settings.
  • Measurement problems.
  • Inadequate operator competence.

Welding

Welding process evaluation is particularly important.

The evaluator may verify:

  • Approved welding procedure availability.
  • Welder qualification.
  • Correct consumables.
  • Consumable storage.
  • Joint preparation.
  • Fit-up.
  • Preheat.
  • Interpass control.
  • Welding parameters.
  • Visual inspection.
  • NDT requirements.
  • Weld identification.

The evaluator should not simply ask whether a welding procedure exists. The critical question is whether the procedure is actually being implemented.

Construction Site Process Evaluation

Construction-site evaluation presents different challenges because conditions are less controlled than in a workshop.

The QA/QC professional may need to evaluate:

  • Equipment installation.
  • Mechanical piping.
  • Alignment.
  • Bolting.
  • Supports.
  • Assembly.
  • Testing.
  • Preservation.
  • Mechanical completion.

Environmental conditions may influence process performance.

Relevant factors can include:

  • Weather.
  • Dust.
  • Moisture.
  • Temperature.
  • Site access.
  • Lighting.
  • Work congestion.
  • Temporary arrangements.

The evaluator should consider whether these conditions affect the ability to comply with the approved procedure.

Evaluating Installation Procedures

A mechanical installation procedure may specify:

  • Preparation.
  • Equipment positioning.
  • Alignment.
  • Levelling.
  • Assembly.
  • Fastener installation.
  • Torque requirements.
  • Inspection.
  • Testing.

The evaluator should determine whether the actual sequence follows the approved method.

For rotating equipment, field evaluation may include verification of:

  • Foundation readiness.
  • Baseplate condition.
  • Alignment method.
  • Measurement equipment.
  • Alignment tolerances.
  • Final inspection.
  • Record completion.

Evaluating Personnel Competence

Procedure compliance depends heavily on competence.

The evaluator should verify whether personnel:

  • Understand their tasks.
  • Know the applicable requirements.
  • Have appropriate qualifications.
  • Have received necessary training.
  • Can identify quality-critical controls.
  • Know when to stop work.
  • Understand escalation requirements.

Questions can be used to assess practical understanding.

For example:

“What would you do if the material identification does not match the drawing?”

A competent response should demonstrate understanding of the project’s material-control and escalation process.

Evaluating Tools and Equipment

The QA/QC professional should verify that equipment used to achieve or verify quality is suitable.

This may include:

  • Measuring instruments.
  • Torque tools.
  • Welding equipment.
  • Temperature devices.
  • Pressure gauges.
  • Alignment equipment.
  • Dimensional equipment.
  • Testing equipment.

Checks should consider:

  • Identification.
  • Calibration status.
  • Condition.
  • Suitability.
  • Range.
  • Accuracy.
  • Maintenance.

An apparently correct process can produce unreliable results if the measurement equipment is unsuitable or out of calibration.

Evaluating Measurement Systems

Measurement-system reliability is essential.

For example, a dimensional inspection may show that a component is within tolerance.

However, the evaluator should consider:

  • Was the correct instrument used?
  • Was it calibrated?
  • Was the measurement method appropriate?
  • Was the environment suitable?
  • Was the operator competent?
  • Was the correct reference point used?

Poor measurement practices can create false acceptance or false rejection.

Evaluating Material Traceability

Traceability should be visible throughout the process.

The evaluator may trace a component from:

Material Certificate


Heat/Batch Identification


Cutting


Fabrication


Welding


Inspection


Testing


Final Equipment Record

Any break in this chain should be investigated.

Traceability gaps can be particularly significant for pressure-containing or otherwise critical components.

Evaluating Inspection and Test Plans

The field evaluation should determine whether ITP requirements are being followed.

The evaluator may verify:

  • Required inspections occurred.
  • Hold points were respected.
  • Witness points were properly communicated.
  • Acceptance criteria were understood.
  • Inspection records were completed.
  • Non-conformities were controlled.
  • Required tests were performed.

A common weakness is completing inspection records after work has already progressed.

Evaluating Hold Points

A hold point means work should not proceed until the specified verification or approval has occurred.

Field evaluation should confirm:

  • Personnel understand the hold point.
  • The activity has not progressed prematurely.
  • Notification was made.
  • Required evidence is available.
  • Release authority is clearly identified.

A repeated failure to respect hold points may indicate a systemic communication or supervision problem.

Evaluating Process Compliance

A useful field evaluation matrix can include:

Evaluation AreaExpected RequirementField EvidencePotential Gap
ProcedureCurrent approved procedureProcedure available at work areaObsolete revision
MaterialsCorrect identificationMaterial markings verifiedTraceability gap
PersonnelCompetent authorised workersQualification recordsCompetency gap
EquipmentSuitable calibrated toolsCalibration status checkedExpired calibration
ProcessApproved sequence followedDirect observationProcess deviation
InspectionRequired checks completedInspection recordsMissing inspection
TestingApproved test methodTest setup observedIncorrect method
RecordsAccurate evidenceRecords reviewedDocumentation gap

This approach provides structured evidence rather than subjective conclusions.

Field Observation Techniques

Direct Observation

Watch the process as it happens.

This is especially useful for:

  • Welding.
  • Machining.
  • Assembly.
  • Installation.
  • Testing.

Document-to-Field Comparison

Compare:

  • Drawing versus physical component.
  • Procedure versus actual practice.
  • ITP versus inspection records.
  • Material certificate versus physical material.

Personnel Interview

Use open questions to determine understanding.

Record Sampling

Select representative records and compare them with physical work.

Traceability Exercise

Follow one component from material receipt to final inspection.

Repeat Observation

Observe the same process at different times or locations to determine whether compliance is consistent.

Identifying Process Deviations

A deviation occurs when actual practice differs from specified requirements.

Not every deviation has the same significance.

It may be:

  • Administrative.
  • Minor.
  • Technical.
  • Significant.
  • Critical.

The classification should follow project procedures.

The evaluator should consider:

  • Requirement affected.
  • Potential consequence.
  • Equipment criticality.
  • Whether the deviation is isolated.
  • Whether it is recurring.
  • Whether affected work has already progressed.

Distinguishing Non-Conformance from Improvement Opportunity

A field evaluation may identify something that does not violate a requirement but could improve efficiency or control.

For example:

A team follows the approved procedure but uses an inefficient documentation method.

This may be an improvement opportunity rather than an NCR.

Conversely, if the team bypasses a required inspection stage, the issue may constitute a formal non-conformance.

Professional judgement is required.

Field Evaluation of Corrective Actions

When corrective action has been implemented, the QA/QC professional should return to the field to determine whether the change is actually being followed.

For example, after repeated material-identification NCRs, management introduces a revised labelling system.

The field evaluation should verify:

  • Labels are being used.
  • Personnel understand the system.
  • Materials remain identifiable.
  • Records correspond with physical identification.
  • Similar problems are not recurring.

This provides evidence of corrective-action effectiveness.

Practical Example: Welding Procedure Compliance

Situation

A fabrication workshop has experienced increasing weld repair rates.

A field evaluation is performed.

Observations

The evaluator identifies:

  • Approved welding procedure available.
  • Welder qualifications current.
  • Consumables available.
  • Fit-up inspection completed.
  • Preheat requirements inconsistently recorded.
  • Welding parameters not consistently monitored.

Analysis

The issue is not simply a welder competency problem.

The process-control weakness relates to monitoring and recording of critical welding parameters.

Corrective Action

The project introduces:

  • Improved parameter monitoring.
  • Supervisor verification.
  • Additional surveillance.
  • Refresher briefing.
  • Targeted inspection.

Follow-Up

A later evaluation confirms improved compliance and reduced repair rates.

This demonstrates the relationship between field observation, process evaluation, corrective action, and KPI improvement.

Practical Example: Mechanical Installation

Situation

Several pump installations show repeated alignment problems.

Field Evaluation

The QA/QC professional observes:

  • Current installation procedure available.
  • Alignment tools calibrated.
  • Personnel qualified.
  • Foundation condition acceptable.
  • Different teams using different alignment sequences.

Finding

The approved procedure is being interpreted inconsistently.

Action

The project:

  • Clarifies the installation procedure.
  • Provides a standard sequence.
  • Conducts competency briefings.
  • Introduces additional verification.
  • Monitors first-pass alignment acceptance.

Result

Subsequent installations show improved acceptance.

The field evaluation therefore identifies a process-control issue rather than simply recording failed alignment measurements.

Case Study: Workshop Process Evaluation

Project Background

A large mechanical fabrication project is manufacturing pressure-containing assemblies. The project has experienced increasing rework despite having approved QA/QC procedures.

Initial Data

Quality records show:

  • Increased dimensional NCRs.
  • Increased weld repairs.
  • More inspection rejections.
  • Increased rework.

Field Evaluation

The QA/QC team conducts direct observations.

They identify:

  • Different teams using different work instructions.
  • Some operators using locally retained copies of procedures.
  • Material traceability not consistently maintained.
  • Measurement equipment correctly calibrated but inconsistently used.
  • Supervisors focusing strongly on production output.

Systemic Findings

The underlying problem is not one individual error.

The field evidence indicates weaknesses in:

  • Document control.
  • Supervision.
  • Procedure implementation.
  • Material control.
  • Process standardisation.

Improvement Programme

The project implements:

  • Controlled procedure distribution.
  • Removal of obsolete copies.
  • Supervisor verification.
  • Standardised work instructions.
  • Additional traceability checks.
  • Targeted process surveillance.

Outcome

Follow-up evaluations demonstrate:

  • Improved procedural compliance.
  • Reduced dimensional deviations.
  • Improved material traceability.
  • Reduced rework.
  • Improved first-pass acceptance.

The case demonstrates that field evaluation can reveal weaknesses that are difficult to identify through document review alone.

Case Study: Construction-Site Process Check

Scenario

A mechanical installation team is preparing equipment for final alignment and testing.

The approved procedure requires:

  • Foundation verification.
  • Equipment positioning.
  • Preliminary alignment.
  • Final alignment.
  • Torque verification.
  • Inspection.
  • Documentation.

During field evaluation, the QA/QC professional observes that the team is moving directly from preliminary positioning to final assembly without completing the specified intermediate verification.

Potential Consequences

  • Incorrect alignment.
  • Installation rework.
  • Equipment vibration.
  • Testing failure.
  • Commissioning delays.

Immediate Response

The evaluator should:

  • Identify the deviation.
  • Assess affected work.
  • Prevent uncontrolled progression where necessary.
  • Notify responsible personnel.
  • Determine whether formal NCR action is required.
  • Verify the correct procedure.
  • Establish corrective action.

Systemic Investigation

If similar practices are found across multiple teams, the project should investigate whether:

  • The procedure is unclear.
  • Training is inadequate.
  • Supervision is insufficient.
  • Production pressure is influencing behaviour.
  • Inspection points are poorly communicated.

This transforms a field observation into a wider process-improvement opportunity.

Benefits of Direct Field Evaluation

Quality Benefits

  • Identifies actual process deviations.
  • Detects weaknesses before final inspection.
  • Improves procedure compliance.
  • Reduces recurring defects.
  • Strengthens preventive controls.
  • Improves traceability.

Manufacturing Benefits

  • Better process consistency.
  • Reduced rework.
  • Improved productivity through correct-first-time work.
  • Better equipment utilisation.
  • Improved workmanship.

Installation Benefits

  • Reduced installation errors.
  • Improved alignment.
  • Better assembly control.
  • Improved testing readiness.
  • Reduced commissioning problems.

Management Benefits

  • Provides objective field evidence.
  • Supports risk-based decision-making.
  • Identifies training needs.
  • Supports corrective-action verification.
  • Improves KPI interpretation.
  • Strengthens audit evidence.

Commercial Benefits

  • Reduces cost of poor quality.
  • Reduces rework.
  • Minimises material waste.
  • Reduces schedule disruption.
  • Improves project predictability.

Common Weaknesses in Field Evaluations

QA/QC professionals should avoid:

  • Treating field evaluation as fault-finding only.
  • Checking documentation without observing actual work.
  • Observing only completed activities.
  • Focusing on individual workers without assessing the process.
  • Using outdated procedures as evaluation criteria.
  • Ignoring environmental conditions.
  • Failing to verify calibration.
  • Accepting verbal explanations without evidence.
  • Recording vague findings.
  • Failing to identify affected work.
  • Closing observations without effectiveness verification.
  • Conducting evaluations without considering risk.
  • Treating every observation as an NCR.
  • Failing to communicate significant findings.
  • Not following up recurring observations.

Professional Field Evaluation Procedure

Phase 1: Plan

  • Define evaluation scope.
  • Review quality requirements.
  • Identify critical activities.
  • Review previous findings.
  • Identify risks.
  • Select evaluation criteria.

Phase 2: Prepare

  • Obtain current documents.
  • Review ITPs.
  • Review drawings.
  • Review previous NCRs.
  • Prepare evaluation checklist.
  • Confirm site access.

Phase 3: Observe

  • Observe actual work.
  • Check process sequence.
  • Verify materials.
  • Check equipment.
  • Observe personnel.
  • Verify inspection points.

Phase 4: Interview

  • Ask process-related questions.
  • Verify personnel understanding.
  • Confirm escalation knowledge.
  • Identify practical difficulties.

Phase 5: Verify

  • Compare physical work with documents.
  • Review records.
  • Check measurements.
  • Verify traceability.
  • Confirm calibration.

Phase 6: Evaluate

Determine:

  • Conformity.
  • Deviation.
  • Potential risk.
  • Systemic weakness.
  • Improvement opportunity.

Phase 7: Report

Record:

  • Activity.
  • Location.
  • Requirement.
  • Observation.
  • Evidence.
  • Classification.
  • Required action.

Phase 8: Follow Up

  • Verify corrective action.
  • Revisit the work area.
  • Review subsequent data.
  • Confirm effectiveness.
  • Identify lessons learned.

Integrating Field Evaluations with KPIs

Field evaluation results should feed into the broader quality performance system.

For example:

Repeated field observations of poor fit-up may correlate with:

  • Increased weld repairs.
  • Increased inspection rejection.
  • Increased NCRs.

This creates a useful relationship:

Field Observation → Process Weakness → Quality Defect → KPI Trend → Corrective Action

Similarly, improved field compliance should eventually produce measurable improvements in:

  • First-pass acceptance.
  • Rework rate.
  • NCR rate.
  • Weld repair rate.
  • Testing performance.

Therefore, field evaluation provides the qualitative evidence that helps explain quantitative KPI results.

Integrating Field Evaluation with Risk Management

Field findings should also inform risk assessment.

A repeated deviation in a critical process may require:

  • Risk reassessment.
  • Increased surveillance.
  • Additional inspection.
  • Additional competency verification.
  • Procedure revision.
  • Management escalation.

The response should be proportionate to the technical consequence.

For example, repeated failure to maintain traceability for a critical pressure-containing material should receive greater management attention than a minor administrative documentation observation.

Advanced Professional Judgement

At Level 6, direct field evaluation requires the ability to interpret what is observed within the wider project context.

The QA/QC professional should consider:

  • Is the procedure itself adequate?
  • Is the procedure practical?
  • Does the workforce understand it?
  • Are resources available?
  • Is production pressure influencing compliance?
  • Are the same deviations occurring elsewhere?
  • Does the deviation affect mechanical integrity?
  • Does the deviation indicate a systemic weakness?
  • Is the inspection process detecting problems early enough?
  • Are corrective actions working?

A mature evaluator does not simply ask whether a worker followed a procedure. They also ask whether the management system has created the conditions necessary for correct implementation.

Key Takeaways

Direct field evaluation provides essential evidence about whether mechanical QA/QC procedures are actually working at the point of execution.

The main principles are:

  • Evaluate processes directly where work occurs.
  • Compare actual practice with approved requirements.
  • Verify current document revisions.
  • Observe critical process steps.
  • Check material identification and traceability.
  • Verify personnel competence.
  • Check tools and equipment.
  • Confirm calibration status.
  • Evaluate inspection and test requirements.
  • Verify hold and witness points.
  • Interview personnel to assess understanding.
  • Review supporting records.
  • Document objective evidence.
  • Distinguish deviations from systemic weaknesses.
  • Link observations with NCR and KPI trends.
  • Evaluate corrective-action effectiveness.
  • Use field evidence to support risk assessment.
  • Focus on prevention as well as detection.
  • Use follow-up evaluations to verify improvement.
  • Apply professional judgement to determine significance.

Conclusion

Direct field evaluation and process checking provide the practical connection between a mechanical QA/QC management system and the work being performed in workshops and on construction sites. Procedures, specifications, ITPs, drawings, and quality plans establish what should happen, but direct observation establishes whether those requirements are being implemented effectively. By observing actual work, checking current documentation, verifying materials and equipment, assessing personnel competence, examining measurement systems, reviewing inspection points, and comparing physical activities with approved requirements, QA/QC professionals can identify process deviations before they develop into significant quality failures.

For Level 6 professionals, the value of field evaluation extends beyond identifying individual mistakes. The most important capability is recognising patterns and determining whether an observation represents an isolated deviation, a training issue, a procedural weakness, or a systemic failure within the quality management system. Field findings should therefore be connected with inspection data, NCRs, KPIs, risk assessments, audits, corrective actions, and continual improvement activities. When effectively implemented, direct field evaluation improves procedure compliance, strengthens process control, reduces rework, improves first-pass acceptance, enhances material and equipment traceability, supports mechanical integrity, and provides reliable evidence that quality assurance processes are functioning as intended across manufacturing and installation environments.

W:H: