
Lesson 2: Collect, analyse, and interpret mechanical data to support QA/QC decision-making.
1: Establish Secure and Structured Data Collection Workflows for Accurate Mechanical Engineering Data
Accurate mechanical engineering data is the foundation of effective QA/QC decision-making. Dimensional measurements, pressure readings, material strength values, temperature records, torque measurements, inspection results and equipment-performance data provide objective evidence about whether components and processes conform to specified requirements. However, the usefulness of this information depends on how systematically it is collected, verified, protected and transferred into the organisation’s quality records. A technically correct measurement can lose its value if the wrong component is identified, the unit is omitted, the instrument is not traceable, the reading is altered without authorisation, or the record cannot later be connected to its original inspection activity.
A secure and structured data collection workflow therefore needs to connect the physical workshop floor with the controlled QA/QC information system. The workflow should establish what must be measured, who is authorised to measure it, which equipment should be used, how measurements should be recorded, how data should be verified, where records should be stored, and how changes should be controlled. This approach supports mechanical engineering data integrity while improving traceability, inspection efficiency, audit readiness and confidence in engineering decisions.
For complex mechanical manufacturing and maintenance environments, data collection should not be treated as a simple administrative task. It is an engineering control activity. Reliable data enables QA/QC personnel to identify dimensional drift, pressure abnormalities, material-strength variation, recurring defects and potential equipment deterioration. A well-designed workflow also reduces transcription errors, strengthens accountability and ensures that historical data can be analysed when investigating non-conformances or assessing long-term mechanical performance.
Understanding Structured Mechanical Data Collection
Structured data collection means obtaining engineering information through a defined and repeatable process rather than through informal notes or uncontrolled records.
The workflow should establish:
- What characteristic is being measured.
- Why the measurement is required.
- Which component or system is being inspected.
- Which measurement method is applicable.
- Which instrument is authorised.
- What units are required.
- What acceptance criteria apply.
- Who performs the measurement.
- When the measurement is taken.
- How the result is recorded.
- How the result is verified.
- How the record is stored.
- How subsequent changes are controlled.
A structured approach ensures that measurements collected at different times, by different inspectors or across different production areas can be compared meaningfully.
Key Definitions and Concepts
| Term | Definition | Mechanical QA/QC Application |
|---|---|---|
| Data Collection | Systematic gathering of technical information | Recording shaft diameter measurements |
| Dimensional Measurement | Quantifying a physical characteristic | Measuring thickness, diameter or length |
| Pressure Log | Time-based record of pressure readings | Monitoring hydraulic system pressure |
| Material Strength Value | Measured mechanical property of a material | Recording tensile or yield strength |
| Traceability | Ability to link data to its source and history | Connecting a reading to a component and gauge |
| Data Integrity | Accuracy, completeness and consistency of information | Preventing unauthorised alteration of results |
| Measurement Record | Controlled record of an inspection result | QA/QC dimensional inspection sheet |
| Calibration | Comparison or adjustment of measuring equipment against a recognised reference | Verifying gauge accuracy |
| Measurement Uncertainty | Quantified doubt associated with a measurement | Assessing confidence in a dimensional result |
| Acceptance Criterion | Defined requirement used to determine conformity | Drawing tolerance |
| Data Validation | Checking whether collected information is credible and complete | Reviewing units and missing values |
| Audit Trail | Record showing data creation and subsequent changes | Tracking amendments to inspection records |
| Controlled Record | Information managed under an approved system | Archived inspection report |
| Sampling | Selecting representative units from a population | Inspecting selected components from a batch |
| Metadata | Information describing a data record | Inspector, date, instrument and component ID |
| Data Security | Protection against unauthorised access, alteration or loss | Access-controlled QA database |
| Electronic Record | Digitally stored engineering information | Digital inspection report |
| Master Data | Controlled reference information used consistently | Component identification and specification |
| Non-Conformance | Failure to meet a specified requirement | Dimension outside drawing tolerance |
| Verification | Confirmation that information is accurate and suitable | Checking recorded measurement against original reading |
Why Accurate Workshop Data Matters
Mechanical engineering decisions frequently depend on relatively small differences in measured values. A dimensional result of 50.04 mm may have a completely different engineering significance from 50.14 mm depending on the specified tolerance. Similarly, a pressure reading without a unit, timestamp or equipment identifier may be unsuitable for meaningful engineering analysis.
Data collection therefore needs to preserve the context of every measurement.
A reliable record should allow an engineer to answer:
- What was measured?
- Which component was measured?
- Where was it measured?
- When was it measured?
- Which instrument was used?
- Who performed the measurement?
- What was the result?
- What unit was used?
- What requirement was being assessed?
- Was the instrument within calibration?
- Was the result accepted or rejected?
- Was any corrective action initiated?
Types of Mechanical Engineering Data
Mechanical QA/QC environments can generate many categories of technical data.
Dimensional Data
Examples include:
- Diameter.
- Length.
- Width.
- Thickness.
- Bore size.
- Hole position.
- Clearance.
- Flatness.
- Parallelism.
- Concentricity.
- Alignment.
Pressure Data
Examples include:
- Hydraulic pressure.
- Pneumatic pressure.
- Test pressure.
- Operating pressure.
- Pressure decay.
- Pressure differential.
Material Data
Examples include:
- Tensile strength.
- Yield strength.
- Hardness.
- Elongation.
- Material grade.
- Chemical composition where applicable.
- Heat-treatment condition.
Equipment Data
Examples include:
- Vibration.
- Temperature.
- Rotational speed.
- Torque.
- Load.
- Running hours.
- Lubrication condition.
Quality Data
Examples include:
- Inspection status.
- Non-conformance records.
- Defect frequency.
- Rework quantity.
- Scrap quantity.
- Inspection results.
- Corrective-action status.
Establishing a Data Collection Workflow

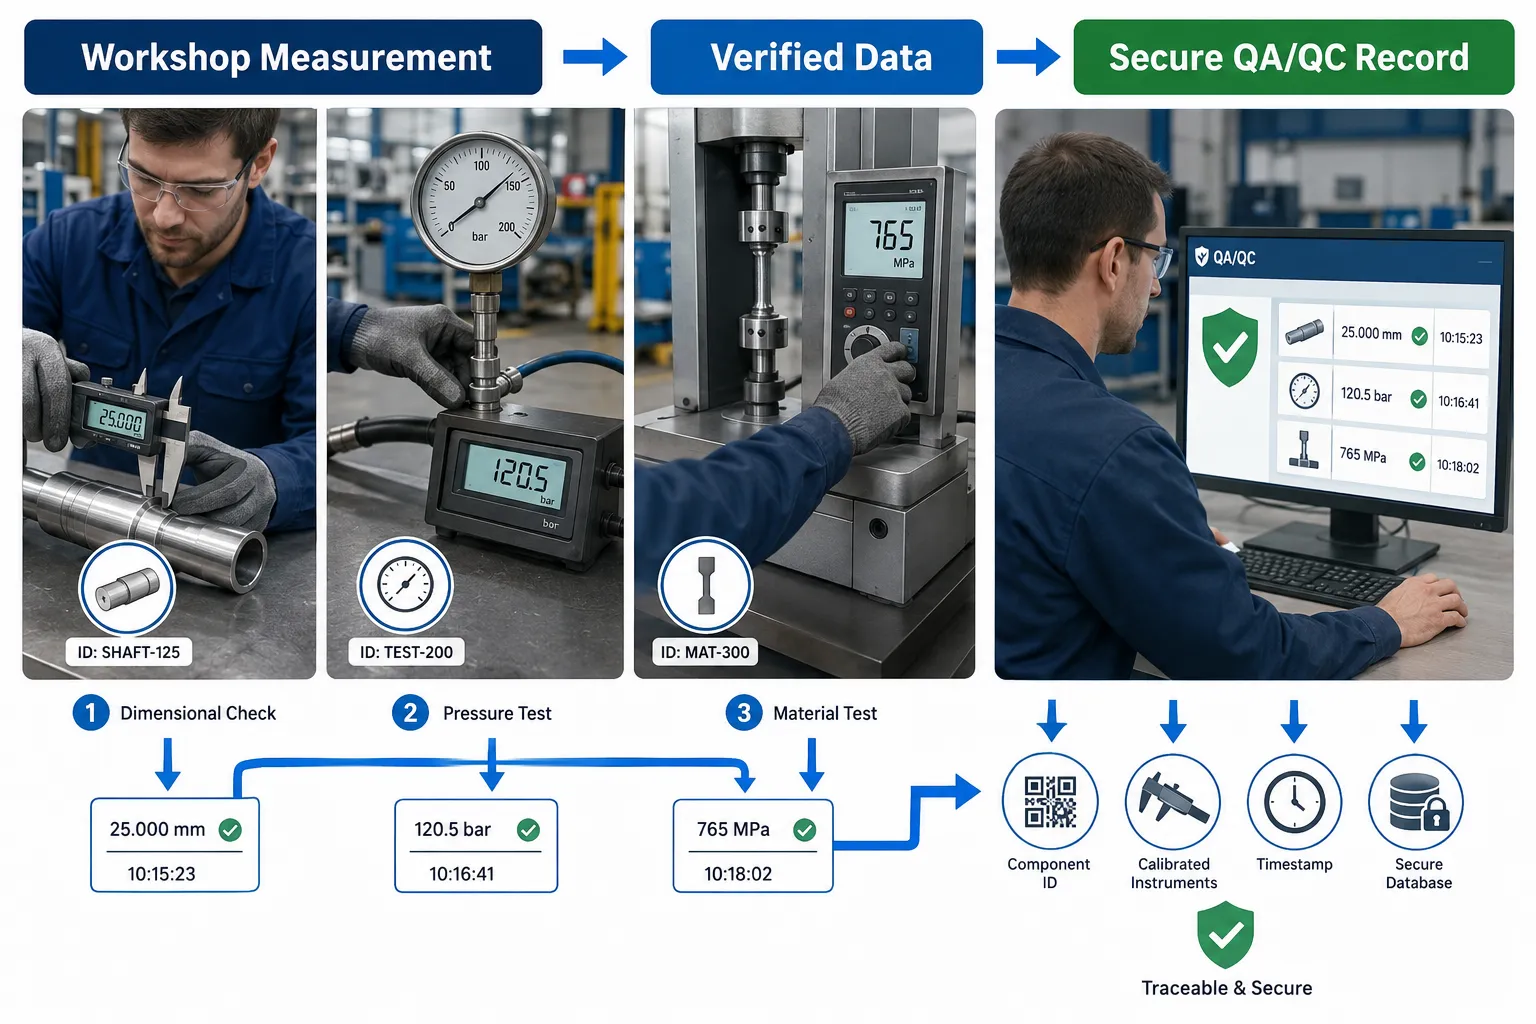
A robust workflow should begin before the measurement is taken.
Step 1: Define the Data Requirement
The engineering team should identify exactly what information is required.
This may be based on:
- Engineering drawings.
- Inspection and test plans.
- Manufacturing procedures.
- Technical specifications.
- Quality-control procedures.
- Equipment requirements.
- Maintenance plans.
- Customer requirements.
The characteristic should be clearly defined so that different inspectors do not interpret the requirement differently.
Step 2: Identify the Measurement Point
The exact measurement location should be established.
For example, a shaft may require measurements at:
- Position A.
- Position B.
- Position C.
A pressure test may require readings at:
- Inlet.
- Outlet.
- Test connection.
- Defined monitoring point.
Clear identification improves repeatability and comparability.
Step 3: Define the Required Unit
Every numerical measurement should have an appropriate unit.
Examples include:
- mm.
- μm.
- MPa.
- bar.
- kN.
- Nm.
- °C.
Units should not be assumed.
A numerical value without a unit can be misleading and potentially unsafe.
Step 4: Select the Appropriate Instrument
The measurement instrument should match:
- Required accuracy.
- Measurement range.
- Resolution.
- Component geometry.
- Environmental conditions.
- Applicable inspection method.
Potential equipment includes:
- Vernier callipers.
- Micrometers.
- Bore gauges.
- Dial indicators.
- Height gauges.
- Pressure gauges.
- Load cells.
- Hardness testers.
- Material-testing machines.
- Coordinate measuring equipment.
Step 5: Verify Instrument Status
Before collecting data, inspectors should verify:
- Identification number.
- Calibration status.
- Calibration due date.
- Physical condition.
- Measurement range.
- Required resolution.
An instrument that is damaged or outside its required calibration status should not be used for controlled acceptance decisions unless an approved procedure specifically permits its use for another purpose.
Data Collection at the Workshop Floor
Workshop-floor conditions can be challenging.
Inspectors may work around:
- Machinery.
- Noise.
- Vibration.
- Temperature changes.
- Oils and contaminants.
- Moving equipment.
- Restricted access.
- Production pressure.
The data collection workflow should therefore be designed to remain practical without compromising measurement quality.
Secure Identification of Components
Every measurement should be linked to the correct component.
Identification may use:
- Component number.
- Serial number.
- Batch number.
- Heat number.
- Drawing reference.
- Work-order number.
- Production lot.
- Equipment identification.
This prevents data from being associated with the wrong physical item.
Example: Dimensional Inspection Record
A controlled dimensional record might contain:
- Component ID.
- Drawing reference.
- Characteristic number.
- Nominal dimension.
- Tolerance.
- Actual measurement.
- Measurement unit.
- Instrument ID.
- Calibration status.
- Inspector ID.
- Date and time.
- Inspection status.
- Comments.
This structure allows the result to be traced back to the original inspection.
Data Collection for Pressure Logs
Pressure data requires particular attention to time and operating conditions.
A useful pressure log may record:
- Equipment ID.
- Test ID.
- Pressure point.
- Initial pressure.
- Test pressure.
- Holding period.
- Final pressure.
- Pressure unit.
- Temperature where relevant.
- Date and time.
- Instrument ID.
- Inspector identification.
For time-dependent testing, the sequence of readings can be more important than a single value.
Example of Pressure Data
A pressure-test record might show:
| Time | Pressure |
|---|---|
| 10:00 | 100 bar |
| 10:15 | 100 bar |
| 10:30 | 99.8 bar |
| 10:45 | 99.7 bar |
| 11:00 | 99.7 bar |
The trend may require engineering interpretation depending on the applicable test requirements.
The data should therefore retain timestamps rather than simply recording a final value.
Collecting Material Strength Data
Material strength information should be connected to the correct material identity.
Relevant identifiers may include:
- Material grade.
- Batch number.
- Heat number.
- Test specimen identification.
- Manufacturing source.
- Test date.
- Test method.
- Test equipment.
- Result.
For example, tensile strength results should not be stored as isolated numerical values without identifying the material and test specimen.
Data Collection and Material Traceability
Material traceability becomes particularly important when investigating non-conformances.
If several components later demonstrate abnormal mechanical behaviour, the organisation may need to determine whether they came from:
- The same material batch.
- The same supplier.
- The same heat.
- The same manufacturing process.
- The same production period.
Structured records make this analysis possible.
Measurement Repeatability
A structured workflow should ensure that measurements can be repeated consistently.
Factors include:
- Measurement location.
- Measurement direction.
- Instrument type.
- Measurement force.
- Environmental condition.
- Component preparation.
- Inspector technique.
For example, measuring a cylindrical component at different locations or orientations can produce different values.
The measurement method should therefore define how and where the measurement is taken.
Measurement System Considerations
A measurement system should provide data suitable for the intended decision.
Important considerations include:
- Accuracy.
- Repeatability.
- Reproducibility.
- Resolution.
- Stability.
- Calibration.
- Environmental suitability.
If the tolerance is extremely small compared with the capability of the measuring instrument, the resulting data may not support a reliable conformity decision.
Data Validation
Data validation involves checking whether collected information is complete, logical and credible.
Validation checks may include:
- Correct component identification.
- Correct unit.
- Correct instrument.
- Correct date.
- Correct measurement range.
- Correct decimal places.
- No missing critical fields.
- No impossible values.
- Correct specification reference.
For example, a pressure record showing “5000 MPa” for a low-pressure hydraulic test should trigger review because the value may be inconsistent with the intended process.
Data Verification
Verification should confirm that recorded data reflects the actual measurement.
This may involve:
- Comparing electronic records with original readings.
- Checking instrument identification.
- Reviewing inspection sheets.
- Confirming component identity.
- Reviewing unusual results.
- Checking operator entries.
Data Integrity Principles
A secure mechanical QA/QC data system should maintain:
- Accuracy.
- Completeness.
- Consistency.
- Traceability.
- Timeliness.
- Authenticity.
- Availability.
These characteristics allow data to remain trustworthy throughout its lifecycle.
Preventing Unauthorised Data Changes
Quality records should not be freely editable.
Controls may include:
- User authentication.
- Role-based access.
- Controlled permissions.
- Revision history.
- Audit trails.
- Electronic signatures.
- Approval workflows.
- Restricted deletion rights.
Where corrections are necessary, the original information should remain traceable wherever the record system requires it.
Electronic Data Collection
Digital inspection systems can reduce manual transcription.
Examples include:
- Tablet-based inspection forms.
- Digital callipers connected to data systems.
- Automated pressure sensors.
- Digital hardness testers.
- Machine-integrated measurement systems.
Potential benefits include:
- Faster data capture.
- Reduced transcription errors.
- Automatic timestamps.
- Improved traceability.
- Faster statistical analysis.
- Easier retrieval.
However, digital systems must be properly controlled.
Manual Data Collection
Manual recording may still be appropriate in some workshop situations.
Where paper records are used:
- Use controlled forms.
- Record information legibly.
- Avoid unapproved alterations.
- Record corrections according to procedure.
- Identify the inspector.
- Record date and time.
- Transfer information to the controlled system promptly.
Secure Digital Storage
Engineering data should be stored in an approved system with appropriate controls.
Security measures may include:
- User authentication.
- Access permissions.
- Regular backups.
- Controlled servers.
- Data recovery arrangements.
- Audit trails.
- Cybersecurity controls.
The objective is to protect quality records from unauthorised alteration, accidental loss and inappropriate access.
Data Backup and Recovery
Mechanical inspection data can represent significant historical value.
Backups should support recovery from:
- Hardware failure.
- Software failure.
- Accidental deletion.
- System corruption.
- Cyber incidents.
The organisation should establish appropriate backup and recovery procedures for critical quality information.
Data Traceability
Traceability means being able to follow the history of data.
For example:
Component → Inspection → Instrument → Inspector → Result → Approval → Archive
This chain allows engineers to reconstruct what happened during an inspection.
Practical Example: Precision Shaft Inspection
A production facility manufactures precision shafts.
The drawing specifies:
- Nominal diameter: 50.00 mm.
- Tolerance: ±0.05 mm.
The inspection workflow requires three measurement positions.
The inspector:
- Identifies the shaft by serial number.
- Confirms the drawing revision.
- Checks the micrometer identification.
- Confirms calibration status.
- Cleans the measurement surfaces.
- Measures each defined position.
- Records the values in the controlled inspection system.
- Reviews the results against specification.
- Signs the inspection record.
- Submits the record for QA/QC review.
This workflow produces a traceable dataset rather than three isolated numbers.
Practical Example: Hydraulic Pressure Testing
A hydraulic assembly undergoes pressure testing.
The controlled workflow establishes:
- Test pressure.
- Test duration.
- Measurement points.
- Gauge identification.
- Required recording intervals.
- Acceptance criteria.
The inspector records pressure at defined time intervals.
If the pressure changes unexpectedly, the time-based data allows the QA/QC engineer to investigate the pattern rather than relying only on the final pressure value.
Practical Example: Material Strength Testing
A batch of material is received with a defined material grade and heat number.
Test specimens are prepared and assigned unique identifiers.
The workflow records:
- Material identity.
- Heat number.
- Specimen ID.
- Test method.
- Equipment ID.
- Test result.
- Test date.
- Inspector or technician.
- Acceptance status.
If a later mechanical failure is associated with that material batch, the organisation can trace the historical test results.
Data Collection Errors and Their Consequences
Poor data collection can lead to:
- Incorrect acceptance decisions.
- False rejection.
- Missed defects.
- Incorrect process adjustments.
- Inaccurate statistical analysis.
- Weak root-cause investigations.
- Poor maintenance decisions.
- Audit findings.
- Loss of customer confidence.
The consequences can extend beyond quality administration into mechanical reliability and operational safety.
Common Data Collection Errors
Missing Units
Recording “50.02” without stating mm makes the result incomplete.
Incorrect Component Identification
A correct measurement attached to the wrong component becomes misleading.
Incorrect Instrument Identification
Without instrument traceability, the measurement cannot be adequately evaluated.
Manual Transcription Errors
A reading of 50.02 can become 50.20 through incorrect data entry.
Missing Timestamps
Time-based trends cannot be properly reconstructed.
Uncontrolled Corrections
Changes without traceability weaken data integrity.
Incomplete Inspection Records
Missing results can create uncertainty about whether inspection occurred.
Incorrect Specification Revision
Using an obsolete drawing can result in an incorrect conformity decision.
Structured Data Fields
A standardised data form should use consistent fields.
For dimensional data:
- Component ID.
- Characteristic ID.
- Nominal value.
- Lower limit.
- Upper limit.
- Actual value.
- Unit.
- Instrument ID.
- Date.
- Time.
- Inspector.
- Status.
For pressure data:
- Equipment ID.
- Test ID.
- Measurement point.
- Pressure.
- Unit.
- Time.
- Temperature where relevant.
- Instrument ID.
- Inspector.
- Acceptance status.
For material strength:
- Material grade.
- Heat number.
- Specimen ID.
- Test method.
- Strength value.
- Unit.
- Test equipment.
- Date.
- Acceptance status.
Data Collection Workflow
A practical workflow can be structured as follows:
Planning
Identify the required characteristics and acceptance criteria.
Preparation
Select the correct measurement equipment and controlled documents.
Identification
Confirm component, batch or equipment identity.
Measurement
Perform the measurement according to the approved method.
Recording
Enter the result immediately and accurately.
Verification
Check the result and supporting information.
Review
Compare the result against the applicable requirement.
Approval
Apply the appropriate inspection approval or disposition.
Storage
Store the record in the controlled system.
Analysis
Make the data available for statistical and engineering evaluation.
Retention
Maintain the record according to applicable organisational requirements.
Key Benefits
Improved Data Accuracy
Structured workflows reduce incomplete and incorrectly recorded information.
Better Traceability
Each measurement can be linked to the relevant component, equipment and inspection activity.
Stronger QA/QC Decisions
Engineers can base decisions on reliable evidence.
Faster Non-Conformance Investigation
Historical data can be retrieved and connected to specific components or batches.
Improved Statistical Analysis
Consistent data fields make trend analysis and SPC more reliable.
Better Audit Readiness
Controlled records provide evidence that inspections were performed correctly.
Reduced Transcription Errors
Digital data capture can reduce manual re-entry.
Improved Production Visibility
QA/QC teams can identify emerging trends more quickly.
Better Maintenance Decisions
Historical measurements can reveal equipment deterioration.
Improved Knowledge Retention
Structured historical records preserve engineering information for future analysis.
Integrating Data Collection With QA/QC Processes
Data collection should connect directly with the wider quality system.
A measurement may lead to:
Measurement → Conformity decision → NCR if required → Root-cause investigation → Corrective action → Verification
This ensures that data has a practical purpose.
Data and Non-Conformance Management
When a measurement falls outside an approved requirement, the result should trigger the appropriate controlled response.
The response may include:
- Identifying the non-conforming component.
- Preventing unintended use.
- Recording the deviation.
- Reviewing related components.
- Investigating the cause.
- Determining disposition.
- Implementing corrective action.
- Verifying effectiveness.
The original measurement should remain available as objective evidence.
Data and Trend Analysis
Structured data allows QA/QC engineers to analyse:
- Repeated dimensional deviations.
- Increasing pressure loss.
- Material-strength trends.
- Recurring defects.
- Machine-related variation.
- Supplier performance.
Without standardised data, meaningful trend analysis becomes difficult.
Data and Statistical Process Control
Once workshop data has been collected consistently, it can support:
- Mean calculations.
- Standard deviation.
- Range analysis.
- Control charts.
- Process capability.
- Trend analysis.
- Sampling analysis.
The quality of SPC output depends heavily on the quality and consistency of the underlying data.
Data Governance Responsibilities
Different roles may have different responsibilities.
Inspector
- Perform measurements correctly.
- Record results accurately.
- Identify equipment.
- Report unusual findings.
QA/QC Engineer
- Define data requirements.
- Review results.
- Verify conformity.
- Analyse trends.
- Manage non-conformances.
Engineering Manager
- Approve significant process decisions.
- Ensure appropriate resources.
- Review performance trends.
IT or Data Administrator
- Maintain secure systems.
- Control access.
- Support backup and recovery.
Clear responsibilities reduce ambiguity.
Case Study: Establishing a Secure Workshop Data Workflow
Background
A mechanical manufacturing facility produces precision components for industrial equipment. Historically, inspectors recorded dimensional results on paper forms and later transferred selected values into spreadsheets.
The organisation experienced:
- Missing measurements.
- Incorrect component numbers.
- Inconsistent units.
- Delayed data entry.
- Difficulty tracing old inspection results.
Initial Assessment
A review identifies that the data collection process has no consistent workflow.
Different inspectors use different methods.
Some records include:
- Component number.
- Measurement.
Others include additional information such as:
- Instrument number.
- Drawing revision.
- Inspection time.
This inconsistency reduces the value of the historical dataset.
New Workflow
The organisation introduces a controlled digital inspection form.
Required fields include:
- Component ID.
- Drawing revision.
- Characteristic ID.
- Nominal value.
- Tolerance.
- Actual measurement.
- Unit.
- Instrument ID.
- Calibration status.
- Inspector.
- Date and time.
Mandatory fields prevent incomplete records from being submitted.
Verification
QA/QC personnel review unusual results.
The system provides traceability between:
Component → Inspection → Instrument → Inspector → Result.
Outcome
The organisation achieves:
- Improved data completeness.
- Better traceability.
- Faster QA/QC review.
- Improved trend analysis.
- Reduced transcription errors.
- Faster identification of recurring dimensional problems.
Advanced Application: Linking Data From Different Sources
Mechanical QA/QC decisions may require data from multiple systems.
For example:
Inspection data + Maintenance history + Machine operating hours + Material batch data
can provide a more complete understanding of process behaviour.
Suppose dimensional drift occurs after approximately 1,000 operating hours.
Maintenance records may reveal that the same machine also experienced increased vibration during that period.
This relationship may provide evidence of equipment deterioration.
Data Security and Access Control
Not everyone requires the same level of access to engineering data.
Access can be structured according to responsibilities.
For example:
- Inspectors: create and submit records.
- QA/QC engineers: review and approve records.
- Engineering managers: review controlled reports.
- Administrators: maintain system permissions.
This reduces the risk of inappropriate changes.
Audit Trails
An audit trail records relevant activity within a controlled system.
It can show:
- Who created a record.
- When it was created.
- Who reviewed it.
- Whether a change occurred.
- Who made the change.
- When the change occurred.
This strengthens confidence in the integrity of engineering records.
Electronic Signatures
Where electronic systems support formal approval, electronic signatures can link an individual to a quality decision.
The signature process should provide appropriate:
- User identification.
- Authentication.
- Timestamp.
- Record association.
Data Retention
Mechanical quality records may be valuable long after the original inspection.
Retention should consider:
- Product lifecycle.
- Contract requirements.
- Organisational procedures.
- Applicable regulatory requirements.
- Traceability needs.
- Historical analysis.
Records should remain accessible and protected throughout the required retention period.
Data Collection and Continual Improvement
Reliable data provides the evidence required to improve processes.
A continual-improvement cycle can be represented as:
Collect → Analyse → Identify → Improve → Verify → Standardise
For example:
- Dimensional data identifies drift.
- Analysis identifies tool wear.
- Engineering introduces controlled tool management.
- Follow-up measurements confirm reduced variation.
- The improved procedure is standardised.
Practical Data Collection Checklist
A structured workflow should ensure that:
- The correct component is identified.
- The correct drawing or specification is used.
- The measurement point is defined.
- The appropriate instrument is selected.
- Calibration status is confirmed.
- Units are recorded.
- Measurements are recorded immediately.
- Inspector identification is captured.
- Date and time are recorded.
- Unusual results are reviewed.
- Records are securely stored.
- Changes remain traceable.
Professional Engineering Considerations
A Chartered-level engineering approach requires data to be treated as technical evidence rather than simply administrative information.
Engineers should ask:
- Is the measurement technically credible?
- Is the instrument appropriate?
- Is the measurement traceable?
- Is the dataset complete?
- Can the result be reproduced?
- Is the data sufficiently accurate for the decision?
- Has the correct specification been applied?
- Can the result be connected to the physical component?
- Is the information protected against unauthorised alteration?
- Can the data support future engineering analysis?
These questions strengthen the reliability of QA/QC decisions.
Conclusion
Establishing secure and structured data collection workflows is fundamental to effective mechanical engineering QA/QC. Dimensional measurements, pressure logs, material-strength values and other technical records provide the evidence needed to assess conformity, identify defects, monitor process performance and support engineering decisions. However, numerical values are only useful when their identity, measurement method, units, instrument, timing and acceptance criteria are properly controlled. A well-designed workflow therefore begins before measurement and continues through verification, approval, secure storage and future analysis.
A robust system should connect workshop-floor activities with controlled quality records. Component identification, drawing revision, measurement location, instrument identification, calibration status, units, inspector details and timestamps should be captured consistently. Digital inspection systems can improve efficiency and reduce transcription errors, while controlled paper systems can still provide reliable results when appropriately managed. In either case, data integrity, traceability, access control and auditability remain essential.
Secure data collection also creates a foundation for advanced QA/QC analysis. Once reliable measurements are consistently captured, engineers can identify dimensional drift, compare production batches, investigate recurring defects, assess supplier performance, correlate equipment condition with product quality and apply statistical process control. Historical records can also support maintenance planning and root-cause analysis when mechanical failures occur.
Ultimately, the objective is to create a trustworthy engineering information chain: the physical component is correctly identified, the measurement is performed using suitable equipment, the result is accurately recorded, the information is verified, the record is securely retained and the resulting dataset can support future technical decisions. This approach strengthens mechanical quality assurance, improves inspection traceability, reduces data-related errors and provides a reliable evidence base for continuous improvement, operational reliability and informed QA/QC decision-making.
2: Analyse Complex Mechanical Testing Datasets Using Software Tools or Data Matrices to Identify Anomalies, Measurement Errors, or Outliers
Mechanical testing generates large volumes of technical information that can be difficult to evaluate reliably through manual inspection alone. Dimensional measurements, pressure readings, tensile-test results, hardness values, vibration measurements, temperature records, fatigue-test results, torque measurements and equipment-performance data may contain hundreds or thousands of individual observations. The engineering challenge is not simply to collect these values but to determine whether the data accurately represents the physical behaviour of the component, material, machine or process being evaluated.
Effective mechanical QA/QC data analysis requires a structured combination of engineering judgement, statistical reasoning and appropriate software tools. Data matrices, spreadsheets, statistical packages, quality-control software and engineering data-analysis platforms can be used to organise datasets, calculate statistical measures, identify trends and highlight unusual observations. These tools help engineers distinguish genuine mechanical behaviour from measurement errors, data-entry mistakes, equipment problems and statistically unusual observations.
The purpose of anomaly and outlier analysis is not to automatically remove unusual data. An unusual result may represent a genuine defect, a developing equipment problem, an abnormal material condition or a special process event. Equally, it may result from an incorrectly calibrated instrument, incorrect test setup, transcription error or data-recording problem. Professional QA/QC analysis therefore requires the engineer to investigate unusual results before deciding whether they should be retained, corrected, repeated or excluded according to an approved procedure.
Understanding Mechanical Testing Datasets
A mechanical testing dataset is a structured collection of measurements or observations obtained during inspection, testing, manufacturing or equipment monitoring.
Examples include:
- Shaft diameter measurements.
- Component thickness measurements.
- Tensile strength results.
- Yield strength values.
- Hardness readings.
- Hydraulic pressure measurements.
- Pneumatic test results.
- Torque measurements.
- Vibration levels.
- Temperature readings.
- Rotational speed.
- Fatigue-cycle results.
- Surface-defect measurements.
- Dimensional inspection results.
- Equipment operating hours.
The quality of the analysis depends on the quality and structure of the underlying dataset. Poorly organised data can hide important trends, create false anomalies or make genuine defects difficult to identify.
Key Definitions and Concepts
| Term | Definition | Mechanical QA/QC Application |
|---|---|---|
| Dataset | A structured collection of related observations | Dimensional measurements from a production batch |
| Data Matrix | Organised arrangement of variables and observations | Components listed against multiple inspection characteristics |
| Variable | A measurable characteristic that can change | Shaft diameter or pressure |
| Observation | An individual recorded measurement | One measured shaft diameter |
| Mean | Arithmetic average of observations | Average component diameter |
| Median | Middle value after ordered observations | Central value in a skewed dataset |
| Range | Difference between highest and lowest value | Spread of dimensional readings |
| Standard Deviation | Measure of data dispersion around the mean | Variation in shaft diameters |
| Outlier | Observation substantially different from the general dataset | Unusually high hardness result |
| Anomaly | Unusual or unexpected data behaviour | Sudden pressure change |
| Measurement Error | Difference between the measured and actual value | Error caused by an unsuitable gauge |
| Data Entry Error | Incorrect information introduced during recording | Entering 52.0 instead of 25.0 |
| Trend | Directional movement in data over time | Gradual increase in vibration |
| Distribution | Pattern showing how observations are spread | Distribution of tensile strength results |
| Correlation | Degree to which variables move together | Relationship between operating hours and vibration |
| Validation | Checking whether data is credible and suitable | Reviewing unusual measurements |
| Data Cleaning | Identifying and correcting legitimate data-quality problems | Removing duplicate records after verification |
| Statistical Signal | Pattern suggesting non-random process behaviour | Sustained shift in control-chart results |
| Repeatability | Consistency of repeated measurements under the same conditions | Repeated gauge readings |
| Traceability | Ability to connect data to its source | Linking a result to a component and instrument |
Why Dataset Analysis Is Important in Mechanical QA/QC
Mechanical systems can fail for many different reasons, and the evidence is often contained within apparently ordinary inspection data. A single unusual measurement may provide the first indication of an equipment problem. A series of gradually increasing values may reveal deterioration before a component reaches an unacceptable condition.
Data analysis allows engineers to identify:
- Abnormal dimensional behaviour.
- Increasing process variation.
- Repeated material-strength deviations.
- Pressure instability.
- Equipment deterioration.
- Measurement inconsistencies.
- Testing-system problems.
- Data-entry errors.
- Recurring production defects.
- Potential process drift.
The objective is to transform raw measurement values into meaningful engineering information.
Data Matrices for Mechanical Engineering
A data matrix provides a structured way of organising complex testing information.
For example:
| Component ID | Diameter mm | Thickness mm | Hardness HV | Pressure bar | Inspection Status |
|---|---|---|---|---|---|
| C001 | 50.02 | 8.01 | 185 | 100.1 | Accept |
| C002 | 50.01 | 8.00 | 187 | 100.0 | Accept |
| C003 | 50.03 | 8.02 | 186 | 100.2 | Accept |
| C004 | 50.21 | 8.01 | 186 | 100.1 | Review |
| C005 | 50.02 | 8.00 | 185 | 100.0 | Accept |
The fourth component immediately warrants investigation because its diameter differs significantly from the surrounding measurements.
A matrix makes relationships between multiple variables easier to identify.
Structuring Data Before Analysis
Before analysing complex datasets, engineers should confirm that the information has been organised consistently.
Important controls include:
- Consistent component identification.
- Consistent units.
- Standardised variable names.
- Correct decimal places.
- Defined measurement dates.
- Defined measurement times.
- Instrument identification.
- Inspector identification.
- Test method identification.
- Specification references.
- Clear acceptance criteria.
Poor structure can create artificial anomalies.
For example, mixing millimetres and inches in the same column could produce values that appear statistically abnormal even though the underlying measurements are correct.
Data Validation Before Statistical Analysis
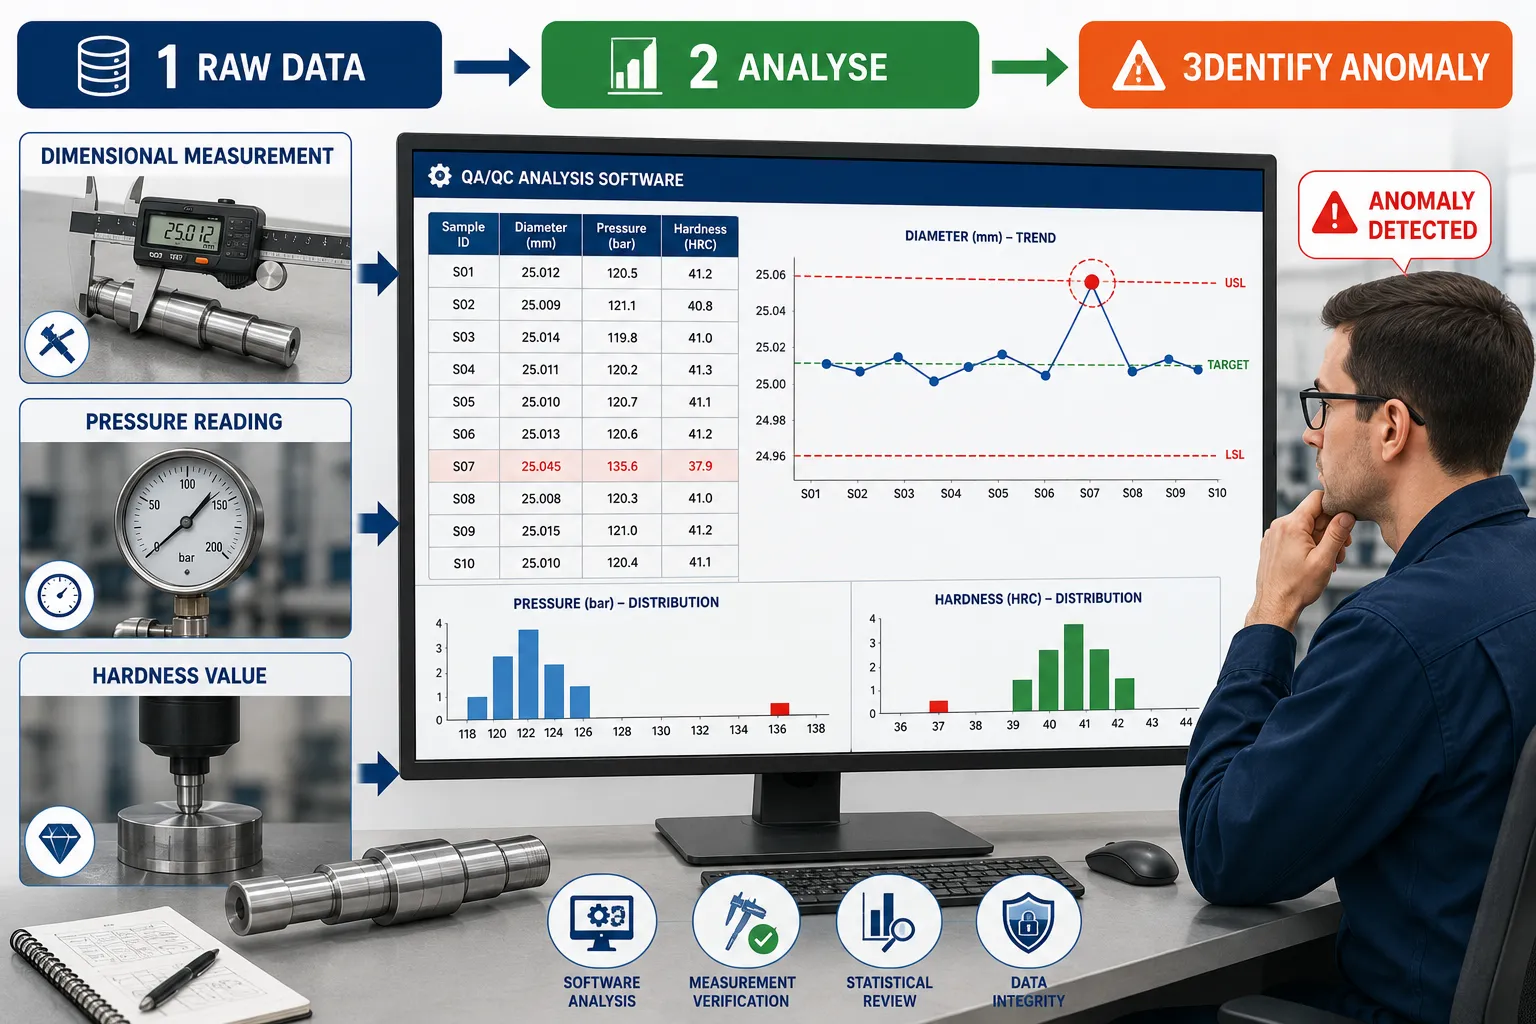
Statistical software can process incorrect information extremely efficiently. This means that sophisticated software does not automatically guarantee correct conclusions.
Data should therefore be validated before analysis.
Initial Validation Checks
The engineer should examine:
- Missing values.
- Duplicate records.
- Incorrect units.
- Impossible values.
- Incorrect decimal placement.
- Incorrect component IDs.
- Unusual timestamps.
- Inconsistent test conditions.
- Instrument identification.
- Calibration status.
- Specification references.
A dataset should be technically credible before statistical interpretation begins.
Software Tools for Mechanical Data Analysis
Software selection should reflect the complexity and purpose of the analysis.
Common tools may include:
- Spreadsheet software.
- Statistical analysis software.
- Statistical process-control software.
- Computerised maintenance systems.
- Quality-management platforms.
- Engineering data-analysis applications.
- Database systems.
- Visualisation and dashboard tools.
Spreadsheets can be effective for moderate datasets and straightforward statistical calculations. Larger or more complex datasets may require dedicated statistical or engineering software.
Spreadsheet-Based Analysis
A spreadsheet can support:
- Sorting.
- Filtering.
- Mean calculations.
- Median calculations.
- Standard deviation.
- Minimum and maximum values.
- Range calculations.
- Conditional formatting.
- Histograms.
- Scatter plots.
- Trend charts.
- Control charts.
- Data validation.
For example, conditional formatting can highlight measurements outside specified engineering limits.
However, automated highlighting should not replace engineering investigation.
Statistical Software
Dedicated statistical software can provide more advanced analysis, including:
- Distribution analysis.
- Regression.
- Correlation.
- Hypothesis testing.
- Capability analysis.
- Control charts.
- Outlier identification.
- Statistical modelling.
- Probability analysis.
Such tools can be valuable when mechanical testing datasets contain large numbers of observations.
Visualisation of Mechanical Testing Data
Visualisation often makes patterns easier to identify than raw tables.
Useful graphical techniques include:
- Line charts.
- Scatter plots.
- Histograms.
- Box plots.
- Control charts.
- Pareto charts.
- Heat maps.
- Distribution plots.
The choice of visualisation should reflect the question being investigated.
Using Histograms
A histogram displays how frequently measurements occur within defined intervals.
For mechanical dimensional data, a histogram can reveal:
- Central tendency.
- Spread.
- Skewness.
- Multiple populations.
- Potentially unusual values.
For example, a shaft-diameter dataset may produce a relatively narrow distribution around the nominal dimension. If several observations form a separate group, the engineer should investigate whether the dataset contains different production conditions or measurement problems.
Using Box Plots
Box plots are useful for identifying:
- Median.
- Interquartile range.
- Overall spread.
- Potential outliers.
They are particularly useful when comparing multiple groups.
For example, an engineer may compare hardness results from:
- Supplier A.
- Supplier B.
- Supplier C.
A noticeably different distribution may warrant additional investigation.
Using Scatter Plots
Scatter plots help engineers explore relationships between two variables.
Examples include:
- Operating hours versus vibration.
- Temperature versus dimensional deviation.
- Machine speed versus surface variation.
- Pressure versus leakage rate.
- Material batch versus strength.
A visible relationship does not automatically prove causation, but it may identify a relationship worthy of engineering investigation.
Identifying Anomalies
An anomaly is an observation or pattern that differs from what would normally be expected.
Anomalies may appear as:
- Single unusual measurements.
- Sudden changes.
- Repeated unexpected values.
- Unexpected clusters.
- Changes in variance.
- Abrupt shifts.
- Unusual relationships between variables.
The important distinction is that an anomaly is a signal for investigation rather than automatic evidence of a defect.
Identifying Outliers
An outlier is a data point that is unusually distant from the main body of observations.
For example, consider hardness results:
185, 187, 186, 184, 188, 186, 187, 250
The value of 250 is substantially different from the other measurements.
Possible explanations include:
- Incorrect material.
- Incorrect test setup.
- Testing equipment problem.
- Operator error.
- Data-entry error.
- Genuine material anomaly.
The value should therefore be investigated before removal.
Statistical Approaches to Outlier Detection
Several statistical approaches can support outlier investigation.
These may include:
- Standard-deviation analysis.
- Z-scores.
- Interquartile range.
- Box-plot analysis.
- Control charts.
- Distribution analysis.
- Robust statistical methods.
The selected approach should reflect the dataset and the engineering purpose.
Standard-Deviation Approach
If the dataset approximately follows an appropriate distribution, standard deviation can help identify observations that are unusually distant from the mean.
For example:
Mean = 50.00 mm
Standard deviation = 0.02 mm
A measurement of 50.01 mm is relatively close to the mean, whereas a measurement of 50.15 mm may warrant investigation.
However, statistical distance alone does not establish that the measurement is erroneous.
Interquartile Range Approach
The interquartile range, or IQR, describes the spread between the first and third quartiles.
It can support identification of potential outliers without relying entirely on the mean and standard deviation.
This can be useful when data contains skewness or when extreme observations could distort the mean.
Control Charts as Anomaly Detection Tools
Control charts can identify changes in process behaviour over time.
Potential signals include:
- Points beyond control limits.
- Sustained shifts.
- Trends.
- Cycles.
- Changes in variation.
A control-chart signal should trigger investigation rather than automatic rejection.
Distinguishing Common and Special Causes
One of the most important aspects of mechanical data analysis is distinguishing ordinary process variation from unusual process behaviour.
Common-cause variation is associated with the normal operation of a process.
Special-cause variation is associated with an identifiable change or unusual event.
Potential special causes include:
- Tool failure.
- Fixture movement.
- Equipment malfunction.
- Incorrect machine setting.
- Material change.
- Measurement-system failure.
- Environmental change.
- Operator intervention.
Understanding this distinction prevents inappropriate process adjustments.
Measurement Errors
Measurement errors can originate from many sources.
Potential sources include:
- Incorrect instrument selection.
- Poor calibration.
- Instrument damage.
- Incorrect measurement technique.
- Temperature effects.
- Surface contamination.
- Misalignment.
- Excessive measurement force.
- Poor repeatability.
- Recording mistakes.
An unusual measurement should therefore be assessed in relation to the measurement system.
Example: Measurement Error Investigation
Suppose ten measurements of a shaft are:
50.01, 50.02, 50.00, 50.01, 50.02, 50.01, 50.00, 50.02, 50.01, 50.40 mm.
The final value appears anomalous.
The engineer should investigate:
- Was the correct shaft measured?
- Was the measurement point correct?
- Was the gauge correctly positioned?
- Was the instrument within calibration?
- Was the shaft contaminated?
- Was the result entered correctly?
- Can the measurement be repeated?
- Does another instrument produce the same result?
Only after investigation should the result be classified.
Genuine Outlier Versus Measurement Error
A critical QA/QC principle is that an outlier is not automatically an error.
Consider two possibilities.
Scenario A
The instrument was incorrectly positioned and repeated measurements return to approximately 50.01 mm.
The original value may represent measurement error.
Scenario B
A second calibrated instrument also measures approximately 50.40 mm.
The unusual dimension may represent a genuine component defect.
The same statistical signal therefore leads to two completely different engineering conclusions depending on the investigation.
Data Cleaning
Data cleaning should be controlled and documented.
Appropriate actions may include:
- Correcting verified transcription errors.
- Standardising units.
- Resolving duplicate records.
- Completing missing information where the original evidence exists.
- Flagging questionable measurements.
- Separating verified errors from genuine observations.
Data should not simply be deleted because it produces an inconvenient result.
Maintaining Original Evidence
Where an observation is suspected to be erroneous, the original information should normally remain traceable according to the organisation’s data-control procedure.
A controlled approach may use:
Original value → Investigation status → Verified correction or retention → Reason recorded
This protects the integrity of the dataset.
Data Analysis Workflow
A professional workflow can be structured into several stages.
Stage 1: Define the Engineering Question
Determine what needs to be understood.
Examples:
- Is the process stable?
- Are dimensions drifting?
- Is a component population consistent?
- Is equipment deterioration occurring?
- Is a material batch abnormal?
Stage 2: Collect the Dataset
Retrieve relevant inspection and testing records.
Stage 3: Validate the Data
Check completeness, consistency and traceability.
Stage 4: Organise the Data
Create a suitable matrix with defined variables.
Stage 5: Explore the Dataset
Calculate:
- Mean.
- Median.
- Minimum.
- Maximum.
- Range.
- Standard deviation.
Stage 6: Visualise the Data
Use appropriate charts and graphs.
Stage 7: Identify Anomalies
Look for unusual values and patterns.
Stage 8: Investigate the Cause
Review equipment, measurement methods, materials, processes and records.
Stage 9: Determine Data Status
Classify observations as:
- Valid.
- Confirmed error.
- Requires investigation.
- Genuine non-conformance.
- Special-cause signal.
Stage 10: Report Findings
Communicate the technical conclusion and supporting evidence.
Practical Example: Dimensional Dataset
A machining team analyses 100 shaft measurements.
Most results fall between:
49.98 mm and 50.03 mm.
However, three values are:
50.14 mm, 50.16 mm and 50.15 mm.
The engineer notices that all three components were manufactured during the same production shift.
Further analysis shows:
- Same machine.
- Same operator.
- Same fixture.
- Same material batch.
The cluster suggests that the issue may not be random.
Further investigation reveals a fixture-setting problem.
This example demonstrates why data analysis should consider patterns rather than isolated numbers.
Practical Example: Pressure-Test Dataset
A pressure system is tested repeatedly.
Historical pressure-decay results are stable.
The latest test shows a significantly larger pressure reduction.
The engineer compares:
- Test temperature.
- Test duration.
- Gauge identification.
- Gauge calibration.
- Initial pressure.
- Final pressure.
- Equipment configuration.
The investigation finds that the pressure gauge was replaced immediately before the test.
A repeat test with a verified gauge produces results consistent with historical behaviour.
The apparent anomaly was therefore associated with measurement equipment rather than system integrity.
Practical Example: Material Strength Dataset
A batch of steel specimens produces tensile-strength results that are generally consistent.
One specimen produces a significantly lower result.
The engineer examines:
- Material heat number.
- Specimen preparation.
- Test-machine calibration.
- Test method.
- Specimen dimensions.
- Test record.
The specimen is found to have been incorrectly prepared.
The unusual result is therefore investigated as a test-related issue rather than immediately classified as evidence of material failure.
Correlation Analysis
Correlation can help identify relationships between variables.
For example, an engineer may compare:
Operating hours versus vibration level.
If vibration increases as operating hours increase, this may indicate deterioration.
However, correlation alone does not prove causation.
The engineer should investigate additional evidence such as:
- Bearing condition.
- Lubrication.
- Alignment.
- Load.
- Operating speed.
- Maintenance history.
Time-Series Analysis
Mechanical equipment often generates data over time.
Time-series analysis can identify:
- Gradual deterioration.
- Cyclic behaviour.
- Sudden changes.
- Seasonal or environmental effects.
- Maintenance-related changes.
For example, vibration data collected weekly may reveal a gradual increase that is not obvious when looking at individual readings.
Comparing Current and Historical Data
Historical datasets provide valuable context.
Current results can be compared with:
- Previous production batches.
- Previous inspections.
- Previous maintenance periods.
- Supplier performance.
- Equipment operating history.
This can help determine whether an unusual result is genuinely unusual or simply part of normal historical variation.
Data Segmentation
Large datasets can be divided into meaningful groups.
Possible categories include:
- Machine.
- Shift.
- Operator.
- Supplier.
- Material batch.
- Production date.
- Tool number.
- Equipment condition.
Segmentation can reveal patterns hidden in the overall dataset.
Example of Data Segmentation
Suppose overall production data appears acceptable.
When separated by machine, one machine shows substantially greater dimensional variation.
The engineering team can then focus investigation on:
- Machine alignment.
- Tool condition.
- Fixture condition.
- Maintenance history.
- Machine calibration.
This is more efficient than investigating the entire production system equally.
Identifying Data Entry Errors
Software can help detect inconsistent records.
Potential indicators include:
- Impossible values.
- Duplicate component IDs.
- Missing units.
- Unusual decimal positions.
- Incorrect dates.
- Repeated identical values.
- Abrupt unexplained changes.
For example, a pressure log normally records values between 90 and 110 bar, but one entry shows 1,050 bar.
The value should be investigated before statistical analysis.
Using Automated Alerts
Software systems can be configured to flag:
- Values outside specification.
- Missing fields.
- Unexpected trends.
- Statistical signals.
- Duplicate records.
- Unusual deviations.
Automated alerts improve response speed, but the final engineering judgement should remain controlled and evidence-based.
Data Security During Analysis
Mechanical testing datasets may contain commercially sensitive information.
Controls should include:
- Appropriate user access.
- Controlled file permissions.
- Secure storage.
- Version control.
- Backup arrangements.
- Controlled sharing.
- Protection against unauthorised modification.
Analysis files should not create uncontrolled alternative versions of official quality records.
Reporting Analytical Findings
An engineering data-analysis report should clearly distinguish between:
- Observed data.
- Statistical findings.
- Engineering interpretation.
- Confirmed causes.
- Suspected causes.
- Recommendations.
A professional report might state:
“Three measurements were identified as statistically unusual. Investigation confirmed that all three were associated with the same fixture configuration. Repeat measurements following fixture correction returned to the historical process range.”
This is stronger than simply stating:
“Three outliers were removed.”
Key Benefits of Software-Based Data Analysis
Improved Analytical Speed
Large datasets can be processed much faster than through manual calculations.
Greater Visibility
Graphs and dashboards make trends easier to recognise.
Improved Consistency
Standardised calculations reduce manual calculation differences.
Early Detection
Automated monitoring can highlight emerging problems.
Better Traceability
Analysis can remain connected to source records.
Stronger Decision-Making
Engineers gain objective evidence for QA/QC decisions.
Improved Root-Cause Investigation
Data can be segmented and compared across multiple variables.
Better Process Control
Statistical signals can support proactive process intervention.
Improved Historical Knowledge
Current results can be compared with previous performance.
Limitations of Software-Based Analysis
Software should support engineering judgement rather than replace it.
Potential limitations include:
- Incorrect formulas.
- Incorrect data import.
- Poorly defined variables.
- Inappropriate statistical methods.
- False outlier identification.
- Poor data quality.
- Incorrect assumptions.
- Misleading visualisation.
A sophisticated graph based on incorrect data remains technically unreliable.
Professional Decision-Making Framework
When an unusual value appears, the engineer should consider:
- Is the value correctly recorded?
- Is the component correctly identified?
- Was the correct test method used?
- Was the equipment suitable?
- Was the equipment calibrated?
- Was the test condition correct?
- Can the result be repeated?
- Does historical data support the result?
- Does another independent measurement confirm it?
- Could the result represent a genuine defect?
- Does the result require escalation?
- Has the investigation been documented?
This approach prevents premature conclusions.
Case Study: Identifying an Outlier in a Mechanical Production Dataset
Background
A manufacturing facility produces precision-machined components. Each component is inspected for diameter, surface-related characteristics and hardness.
The QA/QC department notices that the latest production dataset contains several unusual diameter measurements.
Initial Data Review
Software analysis shows that most measurements are concentrated around the target dimension.
Four measurements are substantially higher.
The system automatically flags them.
Investigation
The QA/QC engineer does not immediately remove the values.
The following factors are reviewed:
- Component identification.
- Drawing revision.
- Inspection instrument.
- Calibration status.
- Inspector.
- Production machine.
- Tool condition.
- Production shift.
- Material batch.
The four unusual measurements came from the same machine.
Additional Testing
A repeat inspection is performed using a verified measurement instrument.
The repeated results remain high.
The measurements are therefore considered genuine rather than measurement errors.
Engineering Investigation
Maintenance records reveal that the machine had experienced fixture instability during the same production period.
Further inspection confirms fixture movement.
QA/QC Decision
The affected components are identified and segregated.
The organisation then:
- Investigates the fixture.
- Corrects the mechanical condition.
- Re-inspects affected components.
- Reviews the production period.
- Records the non-conformance.
- Verifies the corrective action.
Outcome
The data-analysis process prevented the organisation from treating the unusual values as simple statistical anomalies.
Instead, the data provided evidence of a genuine mechanical production issue.
Recommended Analytical Workflow
For routine mechanical QA/QC applications, the following sequence provides a robust approach:
Define
Identify the engineering question and decision required.
Collect
Retrieve relevant and traceable measurements.
Validate
Check data quality before statistical processing.
Structure
Organise observations into a consistent data matrix.
Analyse
Apply appropriate statistical methods.
Visualise
Use graphs to identify patterns.
Flag
Identify anomalies and potential outliers.
Investigate
Determine whether unusual observations are genuine or caused by measurement/data problems.
Confirm
Repeat or independently verify important findings.
Decide
Determine whether the issue represents normal variation, measurement error, process variation or genuine non-conformance.
Document
Record the evidence, analysis and decision.
Improve
Use the findings to support corrective or preventive action.
Practical Application in Mechanical QA/QC
A competent engineering data-analysis process should enable teams to move from raw measurements to meaningful technical conclusions.
For example:
Raw measurement → Data validation → Statistical analysis → Anomaly detection → Engineering investigation → Verified conclusion → QA/QC action
This chain ensures that statistical analysis remains connected to physical engineering reality.
Conclusion
Analysing complex mechanical testing datasets using software tools and structured data matrices is an important capability within modern mechanical QA/QC. Large quantities of dimensional, pressure, material and equipment-performance data can contain valuable evidence about process stability, component conformity and mechanical reliability. Statistical software, spreadsheets and data-visualisation tools provide efficient methods for organising this information, calculating statistical measures and identifying unusual patterns that may require engineering attention.
However, software-generated anomalies and outliers must always be interpreted carefully. A statistically unusual value is not automatically a measurement error, and it is not automatically evidence of a defective component. The engineer must consider the measurement system, calibration status, test conditions, component identity, historical performance, production circumstances and repeat-test evidence before reaching a conclusion. This distinction is particularly important in safety- and quality-critical mechanical engineering environments, where inappropriate removal of genuine abnormal results could conceal an emerging failure mechanism.
A robust approach therefore combines data validation, statistical analysis, visualisation, engineering investigation and documented professional judgement. Data matrices can reveal relationships between components, machines, suppliers, materials and operating conditions, while historical comparisons can establish whether an apparent anomaly represents a new event or an established pattern. When appropriately controlled, software-based analysis can support earlier detection of defects, more effective root-cause investigation, stronger process control and more reliable QA/QC decisions.
The ultimate objective is not simply to identify unusual numbers. It is to understand why the data behaves differently, determine whether the difference has engineering significance and take an evidence-based decision. By maintaining traceability from the original measurement through analysis, investigation and final disposition, organisations can strengthen mechanical quality control, improve equipment reliability and establish a stronger evidence base for continual improvement.
write the this part 3:Interpret raw material test reports to make informed, evidence-based decisions on whether to accept, rework, or reject a batch of mechanical components.
write the seo geo and AIO optimized ,more and more details form Write Act as a Chartered Electrical Engineer (CEng)
Senior Electrical QA/QC Engineer Specialist,asasenior Academic education Content Writer, Curriculum Developer, Instructional Designer, Case study with conculasion , and Subject Matter Expert with 15+ years of experience in international education, vocational qualifications, higher education, and professional training. ,write its points in proper heading use the main heading size is H2 and sub heading size is H3 , H4 etc write this part in at least 2500 or 3000 words which add the ralted 1 table which use proper definations , Key concepts, Detailed explanations, Processes and procedures, key benefits , practical examples , which use 50% paragraphs and 50 % bullets point format.
3: Interpret Raw Material Test Reports to Make Evidence-Based Decisions on Whether to Accept, Rework, or Reject a Batch of Mechanical Components
Raw material quality has a direct influence on the performance, reliability, durability and safety of mechanical components. Before components enter fabrication, machining or assembly, QA/QC personnel need reliable evidence that the supplied material conforms to the specified grade, mechanical properties and purchasing requirements. Raw material test reports provide this evidence by documenting information such as material identification, chemical composition, tensile strength, yield strength, elongation, hardness, heat treatment, test methods and traceability references.
Interpreting these reports requires more than checking whether a certificate has been supplied. A competent QA/QC engineer must compare the reported results against the applicable material specification, engineering requirements, purchase documentation and approved quality criteria. The engineer must also establish whether the test report is traceable to the actual material received. Where results are satisfactory, the batch may be accepted through the appropriate quality-control process. Where deviations exist, the material may require further verification, controlled rework or rejection depending on the technical significance of the deviation.
Evidence-based material disposition is particularly important in mechanical engineering because material properties can influence load capacity, fatigue resistance, wear behaviour, fracture resistance, corrosion performance and dimensional stability. A material that appears visually acceptable may still have inadequate mechanical properties. Conversely, an apparent discrepancy in documentation may be caused by an administrative or traceability issue rather than an actual material defect. Professional interpretation therefore requires technical analysis, verification and controlled judgement rather than an automatic accept-or-reject decision.
Understanding Raw Material Test Reports
A raw material test report is a controlled technical document containing evidence about the characteristics and test results of a particular material batch, heat, lot or product.
Depending on the material and application, the report may contain:
- Material grade.
- Product form.
- Heat number.
- Batch number.
- Chemical composition.
- Tensile strength.
- Yield strength.
- Elongation.
- Reduction of area.
- Hardness.
- Impact properties where applicable.
- Heat-treatment condition.
- Test temperature.
- Test method.
- Specimen identification.
- Manufacturing route.
- Inspection date.
- Supplier information.
- Certification references.
The exact information required depends on the engineering specification and the material application.
Key Definitions and Concepts
| Term | Definition | Mechanical QA/QC Application |
|---|---|---|
| Raw Material | Material supplied for manufacturing or fabrication | Steel bar used to machine shafts |
| Material Grade | Defined classification identifying material composition and properties | Specified engineering steel grade |
| Heat Number | Unique identifier associated with a material melt or heat | Links test results to material production |
| Batch | Defined quantity of material produced or supplied under specified conditions | Group of plates received from a supplier |
| Material Test Report | Document containing material test and identification information | Evidence of conformity |
| Tensile Strength | Maximum tensile stress reached during a tensile test | Assesses material load-bearing capability |
| Yield Strength | Stress at which specified plastic deformation begins | Important for structural loading |
| Elongation | Measure of material deformation before fracture | Indicates ductility |
| Hardness | Resistance of material to indentation or deformation | Supports wear and material verification |
| Chemical Composition | Concentration of specified elements in a material | Confirms material grade |
| Traceability | Ability to connect material to its origin and records | Links component to heat number |
| Conformity | Fulfilment of specified requirements | Material meets the approved specification |
| Non-Conformance | Failure to meet a specified requirement | Yield strength below specified minimum |
| Rework | Controlled activity to bring material or component into conformity | Approved machining or treatment |
| Rejection | Formal decision that material cannot be accepted for intended use | Material fails critical requirements |
| Material Disposition | Decision concerning the status or use of material | Accept, rework, hold or reject |
| Verification | Confirmation that information is accurate and applicable | Checking report against received material |
| Specification | Technical requirements defining acceptable characteristics | Material standard or project requirement |
| Certificate | Controlled document providing stated conformity evidence | Supplier material certificate |
| Objective Evidence | Verifiable information supporting a quality decision | Test results and traceability records |
Why Raw Material Verification Is Critical
The quality of finished mechanical components depends partly on the properties of the material from which they are manufactured.
Material deficiencies can result in:
- Premature component failure.
- Reduced load capacity.
- Excessive wear.
- Cracking.
- Distortion.
- Poor machinability.
- Fatigue failure.
- Inadequate hardness.
- Reduced corrosion resistance.
- Unexpected deformation.
A QA/QC engineer should therefore establish material conformity before the material becomes embedded in the production process.
Relationship Between Material Properties and Mechanical Performance
Material properties determine how a component responds to operating conditions.
For example, yield strength is particularly relevant where components are subjected to sustained mechanical loading. Tensile strength provides information about maximum tensile stress before failure, while elongation provides information about ductility.
Hardness can provide useful evidence about:
- Wear resistance.
- Heat-treatment condition.
- Material consistency.
- Surface performance.
The relevance of each property depends on the intended mechanical application.
Essential Information to Check
When reviewing a raw material test report, the engineer should first establish whether the document contains sufficient identification and technical information.
Key checks include:
- Supplier name.
- Material description.
- Material grade.
- Product form.
- Size or dimensions.
- Heat number.
- Batch or lot number.
- Quantity.
- Test date.
- Test method.
- Mechanical properties.
- Chemical composition where required.
- Heat-treatment condition.
- Applicable specification.
- Authorised approval.
- Traceability information.
Missing critical information may prevent acceptance even if the numerical results appear satisfactory.
Material Identification and Traceability
Traceability is one of the most important elements of raw material acceptance.
The test report should be traceable to the physical material received.
This may require matching:
- Heat number.
- Batch number.
- Material marking.
- Delivery documentation.
- Purchase order.
- Packing list.
- Material label.
- Inspection record.
For example, if the material certificate identifies Heat No. H4728 but the physical material is marked H4729, the material should not simply be accepted based on the certificate. The discrepancy requires investigation.
Reviewing the Applicable Specification
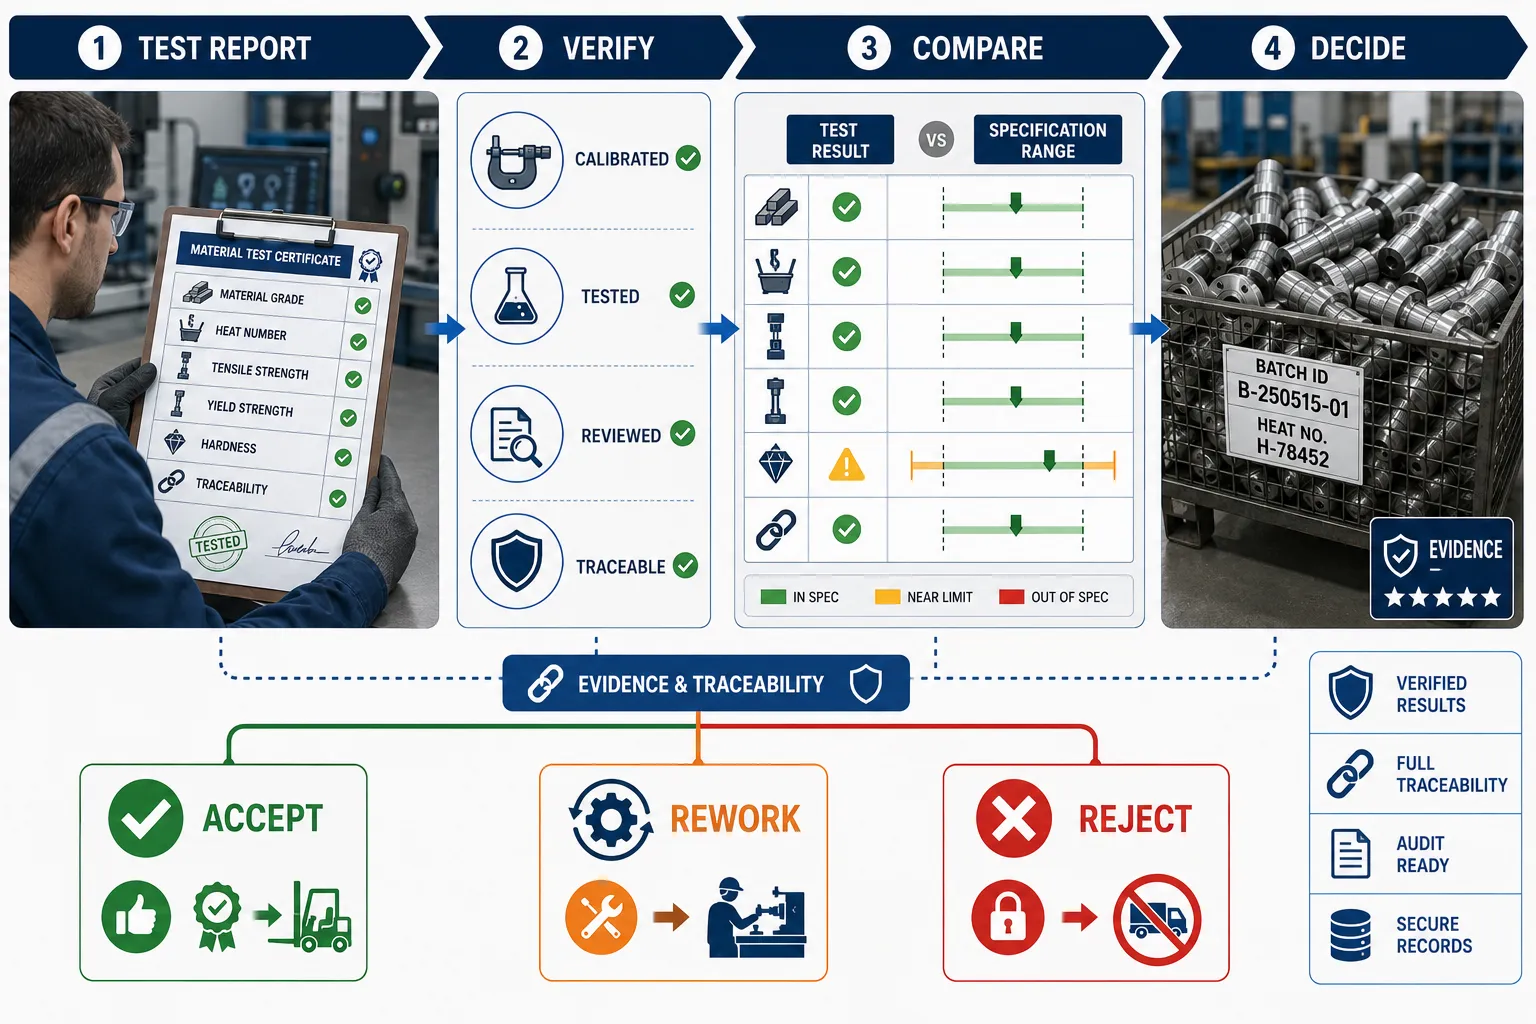
A test report should always be compared against the correct technical requirement.
The engineer may need to review:
- Material specification.
- Engineering drawing.
- Purchase specification.
- Approved supplier requirements.
- Project specification.
- Manufacturing procedure.
- Customer requirements.
The applicable revision should be confirmed because requirements can change.
Using an outdated specification can lead to an incorrect material disposition.
Chemical Composition
Chemical composition provides information about the elements present in the material.
Depending on the material grade, relevant elements may include:
- Carbon.
- Manganese.
- Silicon.
- Chromium.
- Nickel.
- Molybdenum.
- Sulphur.
- Phosphorus.
The importance of each element depends on the material system and intended application.
Chemical composition can influence:
- Strength.
- Hardness.
- Ductility.
- Weldability.
- Corrosion resistance.
- Heat-treatment response.
Comparing Chemical Composition With Requirements
The engineer should compare reported values against the specified ranges.
For example, if the specification requires carbon between defined limits, the reported value must be checked against those limits.
A result outside a specified chemical limit may indicate:
- Incorrect material grade.
- Production variation.
- Testing problem.
- Documentation error.
- Material contamination.
- Traceability problem.
Such a result requires controlled investigation.
Tensile Strength
Tensile strength is the maximum engineering stress reached during a tensile test before fracture.
It can provide evidence about the material’s strength capability.
When reviewing tensile strength:
- Confirm the required minimum.
- Confirm the reported result.
- Verify the unit.
- Confirm the test method.
- Check specimen identification.
- Confirm material traceability.
A result below the specified minimum may represent a significant non-conformance.
Yield Strength
Yield strength indicates the stress level associated with the specified onset of permanent deformation according to the applicable test definition.
It is particularly important when components must resist permanent deformation under operating loads.
A QA/QC engineer should determine whether the reported value satisfies the applicable minimum requirement.
Elongation
Elongation provides information about ductility.
A low elongation value may indicate reduced ductility depending on the material specification and test conditions.
When reviewing elongation, the engineer should consider:
- Specified minimum.
- Reported value.
- Test specimen dimensions.
- Test method.
- Material condition.
Hardness
Hardness testing measures resistance to indentation or deformation using the applicable method.
Different hardness scales may be used depending on material and application.
Examples include:
- Brinell.
- Rockwell.
- Vickers.
The engineer should ensure that the reported hardness scale is clearly identified.
A value without a hardness scale may be incomplete because numerical values from different scales are not directly interchangeable.
Heat Treatment
Heat treatment can significantly affect mechanical properties.
Relevant conditions may include:
- Annealing.
- Normalising.
- Quenching.
- Tempering.
- Solution treatment.
- Ageing.
The test report should identify the applicable treatment where required by the material specification.
If a material was supplied in the wrong heat-treatment condition, its properties may not meet the intended requirements.
Test Method Verification
The test method is an important part of interpreting test results.
A numerical result should not be assessed in isolation.
The engineer should confirm:
- Test method.
- Test standard.
- Specimen preparation.
- Test temperature.
- Test equipment.
- Applicable acceptance criteria.
A result obtained using an inappropriate test method may not provide valid evidence of conformity.
Reviewing Test Report Consistency
The report should be internally consistent.
The engineer should look for inconsistencies between:
- Material grade.
- Chemical composition.
- Mechanical properties.
- Heat treatment.
- Product form.
- Heat number.
- Test method.
For example, a report may identify one material grade while the chemical composition appears more consistent with another grade. Such inconsistencies require investigation.
Data Validation
Before making a disposition decision, the reported information should be validated.
Validation may include:
- Checking numerical values.
- Checking units.
- Confirming decimal places.
- Checking material identifiers.
- Reviewing test dates.
- Confirming laboratory information.
- Checking specification references.
An obvious typographical error should not automatically be interpreted as a material failure.
Distinguishing Documentation Errors From Material Non-Conformance
This distinction is important.
Consider a report stating a tensile strength of 650 MPa where the physical test record shows 650 MPa but the certificate contains 560 MPa due to a transcription error.
The issue may be documentation-related.
However, if independent verification confirms a tensile strength of 560 MPa when the required minimum is 620 MPa, the issue is a genuine material non-conformance.
The QA/QC response should therefore be based on evidence.
Material Acceptance Process
A controlled material acceptance process can follow several stages.
Stage 1: Receive the Material
Record delivery and identify the material.
Stage 2: Check Physical Identification
Confirm markings, labels and heat numbers.
Stage 3: Review Documentation
Obtain the material test report and related records.
Stage 4: Verify Traceability
Match physical material to documentation.
Stage 5: Review Requirements
Confirm the applicable specification and revision.
Stage 6: Compare Results
Evaluate chemical and mechanical properties.
Stage 7: Validate Test Information
Check methods, units and identification.
Stage 8: Determine Conformity
Establish whether requirements are satisfied.
Stage 9: Make Disposition Decision
Select appropriate status.
Stage 10: Record and Release
Update the quality system and control material status.
Accept, Rework, or Reject
Material disposition should be evidence-based.
Accept
Acceptance is appropriate when:
- Material identification is correct.
- Traceability is established.
- Test reports are valid.
- Results meet requirements.
- Required documentation is complete.
- No unresolved quality concerns remain.
Rework
Rework may be considered where:
- The deviation is technically recoverable.
- An approved process exists.
- Rework will not compromise material properties.
- Engineering approval is available where required.
- Verification testing can demonstrate conformity.
Reject
Rejection may be necessary where:
- Critical material properties fail.
- Material grade cannot be confirmed.
- Traceability is lost.
- Required properties cannot be restored.
- Rework is technically unsuitable.
- Applicable requirements prohibit acceptance.
Material Hold Status
Not every questionable batch should immediately be rejected.
A controlled hold status may be appropriate when:
- Documentation is incomplete.
- Traceability needs investigation.
- Test results are unclear.
- Additional testing is required.
- Supplier clarification is pending.
The hold prevents unintended use while preserving the opportunity for evidence-based resolution.
Rework Considerations
Rework must not be treated as a convenient way to bypass material requirements.
Before approving rework, engineers should consider:
- Material grade.
- Nature of deviation.
- Required process.
- Effect on mechanical properties.
- Effect on dimensional requirements.
- Effect on residual stresses.
- Need for repeat testing.
- Applicable specification.
For example, machining an oversized component may be straightforward, but changing the material through heat treatment could substantially affect mechanical properties and require additional verification.
Practical Example: Accepted Steel Batch
A batch of steel bars is received for machining.
The material certificate confirms:
- Correct grade.
- Correct heat number.
- Required chemical composition.
- Tensile strength within specification.
- Yield strength above the minimum.
- Elongation within requirements.
- Correct heat-treatment condition.
The physical markings match the certificate.
The QA/QC engineer verifies all information and releases the material.
The decision is supported by traceable objective evidence.
Practical Example: Batch Placed on Hold
A batch of plates arrives with apparently satisfactory mechanical properties.
However, the heat number on the physical plates does not match the material certificate.
The engineer cannot establish traceability.
The correct decision is to place the batch on controlled hold while the discrepancy is investigated.
The material should not be released simply because the reported mechanical properties appear acceptable.
Practical Example: Material Requiring Further Testing
A supplied material certificate reports a hardness value close to the specification boundary.
The value is not clearly outside the requirement, but the test method and test location are unclear.
The QA/QC engineer requests clarification and, where appropriate, additional testing.
The batch remains controlled until sufficient evidence is obtained.
This illustrates the importance of evidence quality, not simply numerical results.
Practical Example: Rejected Material
A material specification requires a minimum yield strength of 420 MPa.
The verified test result is 385 MPa.
Independent verification confirms the result.
The deviation is significant and cannot be corrected through an approved process without changing the material’s required condition.
The batch is therefore rejected or otherwise disposed of according to the approved quality procedure.
Sampling of Raw Material Test Results
Where a material batch is represented by testing of selected specimens, the engineer should understand the sampling basis.
Relevant questions include:
- How many specimens were tested?
- Were specimens representative?
- Which heat or batch do they represent?
- Was sampling performed according to the applicable specification?
- Were test specimens correctly identified?
A single test result should not be assumed to represent a large population without an appropriate technical basis.
Supplier Performance
Historical supplier performance can provide useful context.
QA/QC teams may review:
- Previous non-conformances.
- Repeated documentation errors.
- Material test failures.
- Delivery quality.
- Traceability performance.
- Corrective-action history.
However, historical performance should not override current objective evidence.
Using Historical Data
Suppose a supplier has delivered 50 acceptable batches but the current batch shows an unexplained chemical-composition deviation.
The current evidence still requires investigation.
Historical performance can influence risk-based controls but should not be used to justify acceptance of a non-conforming batch.
Software-Assisted Material Report Analysis
Digital quality systems can help engineers compare reported material properties against controlled specifications.
Potential functions include:
- Automatic limit checks.
- Data validation.
- Batch tracking.
- Heat-number traceability.
- Supplier history.
- Non-conformance alerts.
- Statistical comparison.
Automated checks can improve efficiency but should remain subject to appropriate engineering review.
Identifying Trends Across Material Batches
Historical datasets can reveal whether a supplier’s performance is changing.
Engineers may analyse:
- Yield strength.
- Tensile strength.
- Hardness.
- Chemical composition.
- Non-conformance frequency.
A gradual shift towards specification limits may indicate an emerging supplier or production issue.
Evidence-Based Decision Matrix
A structured decision framework can assist material disposition.
| Finding | Traceability | Technical Result | Typical Status |
|---|---|---|---|
| All requirements satisfied | Complete | Within specification | Accept |
| Documentation unclear | Incomplete | Apparently acceptable | Hold |
| Minor recoverable deviation | Complete | Potentially recoverable | Engineering review / Rework |
| Critical property below requirement | Complete | Non-conforming | Reject or formal disposition |
| Material identity uncertain | Incomplete | Cannot verify | Hold |
| Test method unsuitable | Uncertain | Evidence unreliable | Further verification |
| Corrected documentation error | Complete | Verified compliant | Accept |
| Verified critical test failure | Complete | Outside requirement | Reject |
This table provides a decision framework rather than an automatic disposition rule. The applicable specification and approved quality procedure remain the controlling requirements.
Root-Cause Investigation of Material Deviations
When a material fails requirements, investigation may consider:
- Supplier manufacturing process.
- Incorrect material grade.
- Heat-treatment problems.
- Sampling problems.
- Test-method errors.
- Laboratory issues.
- Documentation errors.
- Material mix-up.
- Traceability failure.
The objective is to understand why the deviation occurred and prevent recurrence where appropriate.
Corrective and Preventive Action
Material non-conformances can trigger corrective actions such as:
- Supplier investigation.
- Additional incoming inspection.
- Material segregation.
- Revised sampling.
- Laboratory verification.
- Supplier corrective action.
- Process review.
- Traceability improvements.
Preventive actions should address the underlying risk rather than merely correcting one certificate.
Importance of Laboratory Competence
Where material testing is performed externally, the QA/QC engineer should consider whether the test provider is appropriate for the required testing.
Relevant considerations may include:
- Applicable test methods.
- Equipment capability.
- Calibration.
- Personnel competence.
- Traceability.
- Report integrity.
The objective is to ensure that the evidence used for material acceptance is technically credible.
Handling Conflicting Test Results
Occasionally, two test reports may produce different results.
For example:
Supplier report: Yield strength = 450 MPa
Independent test: Yield strength = 405 MPa
Specified minimum: 420 MPa
This conflict requires investigation.
The engineer should examine:
- Test methods.
- Specimen locations.
- Material identification.
- Test equipment.
- Calibration.
- Test laboratory.
- Sampling.
- Test conditions.
The decision should not be based simply on choosing the more favourable result.
Material Disposition and Safety
Material acceptance decisions can have direct safety implications.
If inadequate material is used in a component exposed to high mechanical loads, the consequences may include:
- Permanent deformation.
- Fatigue cracking.
- Fracture.
- Equipment damage.
- Production interruption.
- Injury risk.
For this reason, material acceptance should be controlled by objective evidence.
Documenting the Decision
A material disposition record should clearly show:
- Material identification.
- Batch or heat number.
- Applicable specification.
- Test report reference.
- Relevant results.
- Acceptance criteria.
- QA/QC decision.
- Supporting evidence.
- Approval.
- Date.
Where a deviation exists, the record should explain the disposition route.
Common Mistakes in Material Report Interpretation
Checking Only the Certificate Exists
A certificate’s existence does not prove conformity.
Ignoring Traceability
Correct test results are of limited value if they cannot be linked to the actual material.
Using the Wrong Specification
A material may appear compliant against one requirement but fail another applicable requirement.
Ignoring Units
MPa, ksi and other units must be correctly interpreted.
Accepting Based on Supplier Reputation
Historical performance does not replace current evidence.
Rejecting Without Investigation
A documentation error may not represent a material failure.
Ignoring Heat Treatment
Mechanical properties may depend strongly on material condition.
Treating Every Test Result as Equivalent
Different test methods and conditions can produce different results.
Professional Review Questions
Before accepting a material batch, a QA/QC engineer should ask:
- Is the material correctly identified?
- Does the heat number match?
- Is traceability complete?
- Is the correct specification being applied?
- Is the certificate current and valid?
- Are all required properties reported?
- Are chemical composition results compliant?
- Are tensile and yield properties compliant?
- Is elongation acceptable?
- Is hardness acceptable?
- Is heat treatment correct?
- Are test methods appropriate?
- Are units correct?
- Are any results unusual?
- Is additional verification required?
Advanced Data Interpretation
Material reports can also support broader QA/QC analysis.
By combining historical material results with manufacturing data, engineers may identify relationships between material characteristics and production performance.
For example:
Material hardness → Machining force → Tool wear → Dimensional variation
Such relationships can support process optimisation and supplier quality management.
Case Study: Evidence-Based Material Disposition
Background
A manufacturing facility receives a batch of alloy-steel bars for precision shafts.
The purchase requirement specifies minimum values for yield strength, tensile strength and elongation, together with defined chemical-composition limits.
Initial Review
The material certificate shows:
- Correct material grade.
- Correct heat number.
- Acceptable tensile strength.
- Acceptable elongation.
- Chemical composition within specified limits.
However, yield strength is reported below the specified minimum.
Initial Decision
The QA/QC engineer places the batch on hold rather than immediately releasing or rejecting it.
Investigation
The engineer checks:
- Certificate transcription.
- Test report.
- Test method.
- Specimen identification.
- Heat number.
- Laboratory details.
An independent test is requested according to the approved procedure.
Verification
The independent result confirms that yield strength remains below the specified minimum.
Engineering Assessment
The engineer determines that the material does not satisfy the specified mechanical-property requirement.
The potential consequences of using the material include inadequate resistance to permanent deformation in the intended component.
Final Disposition
The batch is rejected or subjected to an approved formal disposition process, depending on the governing requirements and engineering authority.
Learning Point
The decision was not based solely on the first numerical result. It followed a controlled process:
Certificate review → Traceability verification → Requirement comparison → Investigation → Independent verification → Engineering assessment → Disposition.
Integrating Material Acceptance With Production QA/QC
Material acceptance should occur before material enters uncontrolled production.
A suitable workflow is:
Material receipt → Identification → Certificate review → Traceability check → Test-result verification → Conformity assessment → Accept/Hold/Rework/Reject → Controlled release
This prevents potentially non-conforming material from progressing into later manufacturing stages.
Key Benefits of Evidence-Based Material Decisions
Improved Product Reliability
Correct material selection supports expected mechanical performance.
Reduced Manufacturing Risk
Early detection prevents defective material from entering production.
Improved Traceability
Heat and batch information enables complete material history.
Stronger Supplier Control
Historical analysis supports supplier performance management.
Better Non-Conformance Management
Objective evidence supports defensible dispositions.
Reduced Rework and Scrap
Early material verification prevents defective material from becoming finished components.
Improved Audit Readiness
Controlled records demonstrate how material acceptance decisions were made.
Better Safety Assurance
Critical material properties are verified before use.
Improved Engineering Confidence
Decisions are based on technical evidence rather than assumptions.
Recommended Material Report Interpretation Workflow
A practical QA/QC workflow can be summarised as:
Identify
Confirm material grade, batch and heat number.
Trace
Match documentation with physical material.
Specify
Identify the applicable technical requirements.
Verify
Check test methods, units and report integrity.
Compare
Evaluate reported properties against requirements.
Investigate
Review unusual or conflicting information.
Confirm
Obtain additional evidence where necessary.
Disposition
Accept, hold, rework or reject according to approved requirements.
Document
Record the evidence and decision.
Monitor
Use historical data to identify recurring supplier or material issues.
Practical Application to Mechanical Component Manufacturing
Consider a manufacturer producing high-load shafts.
The material must provide sufficient:
- Yield strength.
- Tensile strength.
- Ductility.
- Hardness.
- Material consistency.
Before machining begins, the QA/QC engineer reviews the material test report.
If the material conforms, the batch is released.
If a property is questionable, the material is placed on hold.
If additional testing confirms compliance, it may be released.
If critical requirements remain unsatisfied, the material is rejected or managed through the applicable formal disposition process.
This prevents material-related problems from being discovered only after machining and assembly.
Conclusion
Interpreting raw material test reports is a critical mechanical QA/QC activity because material properties provide the foundation for the performance and reliability of manufactured components. A professional assessment must consider material identification, traceability, specification requirements, chemical composition, tensile strength, yield strength, elongation, hardness, heat treatment, test methods and the credibility of the supporting evidence. A certificate should never be treated as sufficient evidence simply because it has been supplied; its information must be verified against the physical material and applicable engineering requirements.
Evidence-based material disposition requires a controlled sequence of identification, verification, comparison, investigation and decision-making. When results satisfy the applicable requirements and traceability is complete, the material can normally proceed through the approved acceptance process. Where information is incomplete or questionable, controlled hold status and additional verification may be appropriate. Rework should only be considered when the deviation is technically recoverable and an approved method can demonstrate that the resulting material or component meets all relevant requirements. Where critical properties remain non-conforming or traceability cannot be established, rejection or formal engineering disposition may be necessary.
The strongest QA/QC approach also considers historical and statistical evidence. Supplier trends, recurring material deviations, changes in mechanical properties and relationships between material characteristics and manufacturing performance can provide early indications of emerging quality problems. By connecting raw material test reports with inspection records, production information and non-conformance data, engineering teams can move from isolated certificate checking towards proactive material-quality management.
Ultimately, the purpose of material test-report interpretation is to ensure that every batch entering mechanical production has a defensible technical status. Accept, rework, hold and reject decisions should be based on verified evidence, applicable requirements, traceability and sound engineering judgement. This approach reduces manufacturing risk, protects mechanical integrity, strengthens supplier quality management and provides a reliable foundation for producing safe, consistent and high-performing mechanical components.