
Lesson 6: Present research outcomes in a professional, structured format.
Presenting research outcomes in a professional, structured format is a critical stage of electrical engineering QA/QC research. A technically strong investigation has limited value if its findings are difficult to understand, poorly organised, inadequately evidenced, or presented without a clear connection to the research objectives. This lesson develops the knowledge and professional skills required to communicate electrical QA/QC research outcomes clearly to academic, technical, managerial, and workplace audiences. Learners will explore how to structure research reports, organise findings, present data and analysis, communicate conclusions, and develop evidence-based recommendations in a format that is logical, credible, and suitable for professional decision-making.
Within electrical engineering quality assurance and quality control, research outcomes may include inspection findings, testing results, defect trends, non-conformance data, quality-performance indicators, stakeholder feedback, benchmark comparisons, analytical results, and conclusions about complex QA/QC problems. Presenting these outcomes effectively requires more than reporting data. Learners must establish a logical relationship between the research question, methodology, evidence, analysis, findings, conclusions, and recommendations. Clear tables, figures, charts, summaries, and structured explanations can help decision-makers understand important quality issues without losing the technical context behind the evidence.
The lesson also focuses on professional research communication, evidence-based reporting, technical accuracy, clarity, consistency, and appropriate academic presentation. Learners will consider how to communicate complex electrical QA/QC findings to different audiences while maintaining objectivity and research integrity. By the end of the lesson, learners will be better prepared to transform detailed research evidence into a coherent professional research report that demonstrates analytical competence, supports informed QA/QC decisions, communicates practical implications, and provides a credible basis for quality improvement within electrical engineering environments.
1. Structure a Comprehensive Research Report That Logically Presents Complex QA/QC Investigations and Findings
A comprehensive research report is the principal mechanism through which an electrical engineering QA/QC investigation is communicated, evaluated, and applied in a professional environment. A well-structured report does more than document what was investigated; it creates a logical evidence trail showing why the research was undertaken, how the investigation was designed, how data were collected and analysed, what the evidence demonstrates, how findings compare with relevant industry expectations, and what conclusions can reasonably be drawn. For complex electrical quality problems, this structure is particularly important because quality issues may involve several interacting factors, including design information, materials, installation practices, testing, inspection, competence, supervision, documentation, procurement, commissioning, environmental conditions, and project controls.
At Level 6, learners are expected to demonstrate a systematic and analytical approach to professional research reporting. The report should communicate technical information accurately while remaining understandable to its intended audience. It should distinguish evidence from interpretation, findings from conclusions, and conclusions from recommendations. It should also demonstrate that the researcher understands the limitations of the investigation and has not extended claims beyond what the available evidence can support.
A professional electrical QA/QC research report should therefore be viewed as a connected system rather than a collection of independent sections. Each part should contribute to the overall research argument. The introduction establishes the problem and research purpose; the methodology explains how evidence was obtained; the findings present what the research discovered; the analysis explains what the findings mean; the discussion connects the evidence with existing knowledge and industry practice; and the conclusion answers the research objectives. Recommendations then identify appropriate opportunities for improvement.
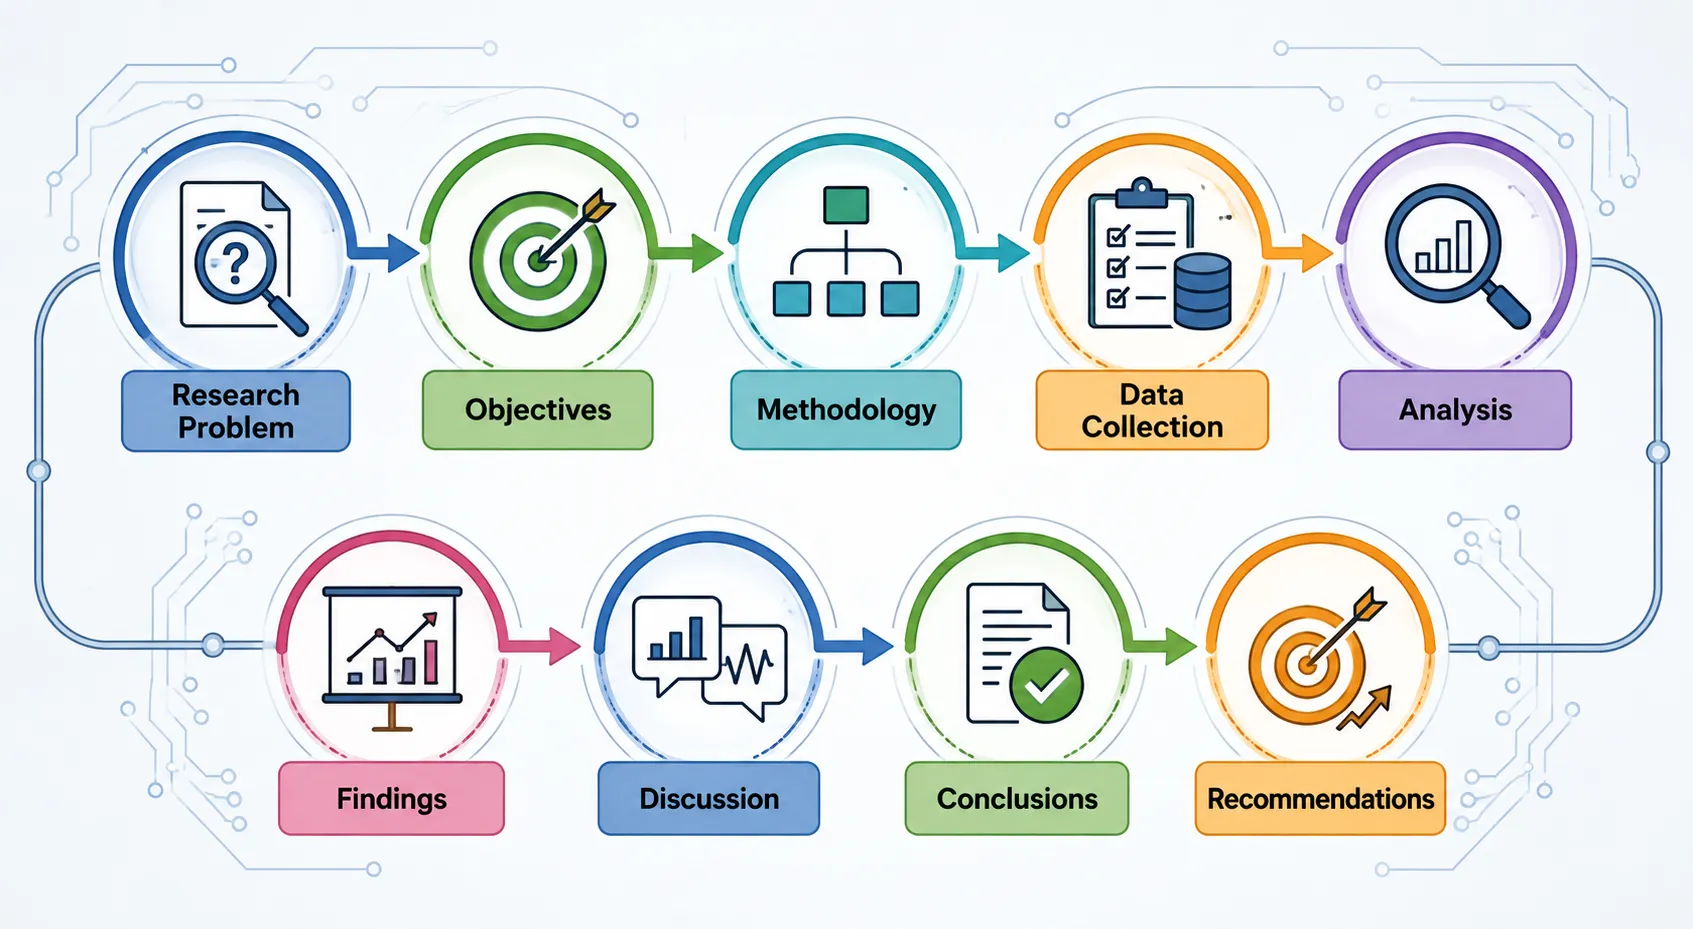
Purpose of a Comprehensive Electrical QA/QC Research Report
The main purpose of a research report is to communicate research evidence in a structured and traceable manner. In electrical engineering QA/QC, this may involve presenting the results of an investigation into recurring defects, testing failures, inspection weaknesses, documentation problems, commissioning delays, supplier quality issues, or other quality-control concerns.
A professional report should enable a reader to understand:
What quality issue was investigated
Why the issue required investigation
What the research aimed to establish
How the research was conducted
What evidence was collected
How the evidence was analysed
What patterns or relationships were identified
How findings compare with relevant benchmarks
What conclusions are supported by the evidence
What practical implications arise
What improvements may be appropriate
The report should also provide sufficient information for another suitably qualified professional to understand the basis of the research judgement.
Key Concepts and Definitions
| Key concept | Definition | Application in electrical QA/QC research |
|---|---|---|
| Research Report | A structured document communicating an investigation and its outcomes | Presents a complete electrical quality investigation |
| Research Problem | The specific issue requiring systematic investigation | Recurring electrical installation defects |
| Research Objective | A defined outcome the research intends to achieve | Determine causes of repeated QA/QC failures |
| Research Question | A focused question guiding the investigation | Why are similar defects recurring? |
| Methodology | The overall approach used to conduct research | Qualitative, quantitative or mixed methods |
| Data Collection | Systematic gathering of research evidence | Inspection records, testing data and interviews |
| Findings | Results identified through data analysis | Recurring defects in specific installation stages |
| Analysis | Examination of data to identify meaning, patterns or relationships | Comparing defect trends across project phases |
| Discussion | Interpretation of findings in relation to research context | Explaining why quality weaknesses occurred |
| Conclusion | Evidence-based judgement derived from the findings | Determining the significance of the identified QA/QC weakness |
| Recommendation | Proposed action arising from research conclusions | Strengthening progressive inspection controls |
| Benchmark | Reference used to evaluate performance | Applicable standard, specification or quality target |
| Limitation | Factor restricting research interpretation | Limited project sample |
| Traceability | Ability to follow evidence from source to conclusion | Linking findings to inspection and test records |
| Executive Summary | Concise overview of the entire investigation | Gives managers the key findings and conclusions |
| Research Integrity | Honest, transparent and responsible presentation of evidence | Reporting favourable and unfavourable findings accurately |
Why Report Structure Matters in Electrical QA/QC Research
Complex electrical QA/QC investigations can generate large quantities of technical information. Without an appropriate structure, important findings can become difficult to identify and relationships between evidence and conclusions can become unclear.
A logical structure helps the researcher:
Maintain a clear line of argument
Avoid unnecessary repetition
Separate evidence from opinion
Present complex information systematically
Improve reader comprehension
Demonstrate research competence
Support professional decision-making
Establish evidence traceability
Identify limitations transparently
Connect findings to recommendations
For example, if a report investigates repeated electrical testing failures, simply presenting a table of failed tests does not explain the underlying problem. The report needs to establish the research context, explain how testing information was collected, analyse patterns, examine possible causes, compare results against appropriate requirements, and develop an evidence-based conclusion.
Recommended Structure of a Professional Research Report
A comprehensive electrical QA/QC research report can be organised into the following sequence:
Title
Executive Summary
Introduction
Research Background
Research Problem
Aim and Objectives
Research Questions
Literature Review
Research Methodology
Data Collection
Data Analysis
Research Findings
Discussion
Benchmark and Industry Comparison
Practical Implications
Conclusions
Recommendations
Research Limitations
References
Appendices
Not every project requires exactly the same headings. The structure should reflect the research objectives, methodology, institutional requirements, and complexity of the investigation.
Developing a Clear Report Title
The title should immediately communicate the subject of the investigation.
An effective title should identify:
Main research topic
Electrical engineering context
QA/QC focus
Investigation area
Relevant project or process where appropriate
For example:
“Investigation of Recurring Electrical Installation Defects and Their Impact on QA/QC Performance”
This is more informative than:
“Electrical Quality Research”
A strong title allows the reader to understand the report’s purpose before reading the main content.
Writing an Effective Executive Summary
The executive summary provides a concise overview of the entire research project.
Although positioned near the beginning, it is generally most effective when written after the main report has been completed.
It should briefly communicate:
Research problem
Research aim
Methodology
Key findings
Major conclusions
Principal recommendations
Practical significance
The executive summary should not introduce information that does not appear elsewhere in the report.
For an electrical QA/QC investigation, a manager should be able to read the executive summary and understand:
What went wrong
What the research investigated
What evidence was found
How significant the problem is
What the research concludes
What action may be required
Establishing the Research Background
The background section provides context for the investigation.
It should explain why the subject is relevant to electrical engineering quality management.
Relevant background may include:
Nature of the electrical system
Project environment
Quality-control context
Existing processes
Previous quality concerns
Relevant technical requirements
Known industry challenges
Reasons for undertaking the research
The background should remain focused on the research problem rather than becoming a general history of electrical engineering.
Defining the Research Problem
The research problem should be precise.
For example:
“Repeated electrical cable termination defects have been identified during final inspection, resulting in rework and delayed testing. The underlying causes and effectiveness of existing QA/QC controls require systematic investigation.”
This provides a clear foundation for the research.
A well-defined problem should identify:
What is happening
Where it is happening
Why it matters
What remains uncertain
Why research is necessary
Establishing the Research Aim
The research aim provides the overall direction.
For example:
“To investigate the causes of recurring cable termination defects and evaluate the effectiveness of existing QA/QC controls within the selected electrical engineering environment.”
The aim should be broad enough to encompass the investigation but sufficiently focused to remain manageable.
Developing Research Objectives
Objectives translate the aim into measurable research activities.
Appropriate objectives may include:
Identify recurring electrical quality defects.
Examine factors associated with defect occurrence.
Analyse inspection and testing records.
Evaluate existing QA/QC controls.
Compare findings with relevant benchmarks.
Determine practical implications.
Formulate evidence-based conclusions.
Recommend appropriate quality improvements.
Objectives should connect directly with the later findings and conclusions.
Formulating Research Questions
Research questions provide an analytical framework for the investigation.
Examples include:
What are the most common electrical installation defects?
What factors contribute to recurring defects?
How effective are existing inspection controls?
How do research findings compare with applicable benchmarks?
What practical implications arise from the findings?
Every major research question should be addressed somewhere in the report.
Structuring the Literature Review
The literature review establishes the existing knowledge relevant to the research problem.
It should not simply list sources.
A strong literature review should:
Identify established concepts
Compare different perspectives
Examine previous research
Identify areas of agreement
Identify inconsistencies
Highlight knowledge gaps
Establish the rationale for the current investigation
For electrical QA/QC research, relevant themes may include:
Quality management
Electrical inspection
Testing practices
Defect prevention
Non-conformance management
Root-cause analysis
Quality assurance
Quality control
Risk-based approaches
Continual improvement
The literature review should ultimately explain why the current research is necessary.
Structuring the Methodology
The methodology explains how the research was conducted.
A reader should understand:
Research approach
Research design
Data sources
Participants or sample
Data collection methods
Analytical methods
Ethical considerations
Reliability measures
Validity considerations
Research limitations
For example, an investigation might use a mixed-method approach combining:
Quantitative defect records
Inspection results
Testing data
Qualitative interviews
Workplace observations
The methodology should justify why these methods were appropriate.
Connecting Methodology With Research Questions
A strong report demonstrates alignment between:
Research question
↓
Research objective
↓
Methodology
↓
Data collection
↓
Analysis
↓
Finding
↓
Conclusion
This alignment is essential.
If a research question asks why a defect occurs, simply counting defects may not provide sufficient evidence to establish contributing factors. Additional qualitative or observational evidence may be required.
Presenting Data Collection
The report should explain how data were obtained.
Possible sources include:
Inspection records
Test certificates
Non-conformance reports
Audit findings
Quality dashboards
Commissioning records
Questionnaires
Interviews
Site observations
Document reviews
The researcher should explain why each source was relevant.
Ensuring Data Traceability
Every significant finding should be traceable to an evidence source.
For example:
Inspection records
↓
Defect classification
↓
Frequency analysis
↓
Trend identification
↓
Research finding
↓
Benchmark comparison
↓
Conclusion
This makes the report more defensible.
Presenting Complex QA/QC Data
Complex data should be presented in a way that supports understanding.
Useful presentation methods include:
Tables
Bar charts
Line charts
Process diagrams
Flowcharts
Trend graphs
Summary matrices
Categorisation frameworks
However, visual material should have a clear analytical purpose.
A chart should not be included simply to make the report appear more professional.
Example of Appropriate Data Presentation
Suppose a project records 120 electrical defects.
The researcher categorises them into:
Cable installation
Termination
Labelling
Testing
Documentation
Equipment installation
A table can show:
| Defect category | Number identified | Percentage | Priority |
|---|---|---|---|
| Cable installation | 32 | 26.7% | High |
| Termination | 28 | 23.3% | High |
| Documentation | 24 | 20.0% | Medium |
| Testing | 18 | 15.0% | High |
| Equipment installation | 12 | 10.0% | Medium |
| Labelling | 6 | 5.0% | Low |
The table presents the distribution clearly, while the accompanying text should interpret what the distribution means.
Structuring the Findings Section
The findings section should present what the research discovered without unnecessarily mixing it with recommendations.
A useful structure could be:
Finding 1: Defect Distribution
Present the major defect categories.
Finding 2: Recurring Defects
Identify repeated issues.
Finding 3: Process Patterns
Explain where defects are concentrated.
Finding 4: Testing Outcomes
Present relevant testing results.
Finding 5: Documentation Performance
Present record-related findings.
Finding 6: Stakeholder Evidence
Present relevant interview or questionnaire results.
This allows readers to follow the evidence systematically.
Distinguishing Findings From Discussion
This distinction is particularly important.
The findings section answers:
“What did the research discover?”
The discussion section answers:
“What do those findings mean?”
For example:
Finding:
“Termination defects represented 23.3% of recorded defects.”
Discussion:
“The concentration of termination defects suggests that installation-stage controls may require further evaluation, particularly where similar defects recur across multiple teams.”
The first statement reports evidence; the second interprets it.
Structuring the Discussion
The discussion should connect findings to:
Research questions
Research objectives
Literature
Industry practice
Benchmarks
Workplace context
The discussion may examine:
Why findings occurred
Whether findings support previous research
Whether findings challenge existing practice
Possible explanations
Alternative interpretations
Practical implications
This is where the researcher demonstrates higher-level analytical thinking.
Comparing Findings With Industry Benchmarks
A professional QA/QC report should establish how findings compare with relevant benchmarks.
Potential benchmarks include:
Applicable electrical standards
International standards
National requirements
Project specifications
Manufacturer requirements
Organisational quality targets
Historical performance
Recognised professional practices
The researcher should verify that the benchmark is relevant before making a comparison.
Presenting Non-Conformities
Where evidence identifies a non-conformity, the report should communicate:
Requirement
Observed condition
Evidence
Significance
Immediate impact
Potential cause
Corrective-action status
The presentation should remain factual.
Avoid statements such as:
“The team clearly ignored quality requirements.”
A more objective approach is:
“The inspection records indicate repeated deviations from the specified installation requirement.”
Presenting Anomalies
Anomalies should be clearly identified rather than hidden.
The researcher should consider:
Whether the result is genuine
Whether measurement conditions influenced it
Whether data-entry errors are possible
Whether the anomaly requires further investigation
An unusual result should not automatically become the basis for a major conclusion.
Presenting Limitations
Every professional research report should explain its limitations.
Possible limitations include:
Restricted access to project records
Small sample size
Limited observation period
Single project environment
Incomplete historical data
Participant availability
Limited testing information
The researcher should explain how each limitation affects interpretation.
For example:
“The investigation was conducted within one project environment; therefore, findings should not automatically be generalised to all electrical construction projects.”
Developing Objective Conclusions
The conclusion should bring the research argument together.
It should:
Answer the research questions
Address the research objectives
Summarise significant findings
Reflect benchmark comparisons
Recognise limitations
Avoid introducing new evidence
A strong conclusion does not simply repeat the executive summary.
It provides a final analytical judgement.
Developing Evidence-Based Recommendations
Recommendations should arise directly from conclusions.
Potential recommendations may include:
Revising inspection procedures
Introducing additional verification points
Improving training
Strengthening document control
Improving supplier checks
Revising testing arrangements
Enhancing corrective-action monitoring
Improving quality-data analysis
Each recommendation should ideally identify:
Proposed action
Reason
Responsible party
Priority
Required resources
Expected benefit
Performance measure
Creating a Logical Report Argument
The complete report should follow a logical progression:
Problem
What quality issue exists?
↓
Purpose
Why is it being investigated?
↓
Method
How was it investigated?
↓
Evidence
What data were collected?
↓
Findings
What did the data reveal?
↓
Analysis
What do the findings mean?
↓
Benchmark
How do findings compare with expectations?
↓
Conclusion
What can reasonably be established?
↓
Recommendation
What should potentially happen next?
This structure makes complex research considerably easier to understand.
Practical Example: Recurring Electrical Defects
Consider an electrical construction project experiencing repeated cable termination defects.
The report could be structured as follows:
Research Problem
Recurring termination defects are causing rework and delaying testing.
Research Aim
Investigate the causes and evaluate existing QA/QC controls.
Methodology
Use inspection records, interviews and site observations.
Findings
Termination defects occur across multiple teams.
Most defects are identified during final inspection.
Work instructions vary between teams.
Early-stage verification is inconsistent.
Analysis
The evidence suggests that final inspection is effective at detection but earlier preventive controls may be insufficient.
Benchmark Comparison
Findings are evaluated against applicable project quality requirements and relevant technical criteria.
Conclusion
The evidence supports the existence of a recurring process-control weakness.
Recommendation
Consider standardised work instructions, competence verification and progressive inspection.
This demonstrates how each report section contributes to the overall research argument.
Practical Example: Testing and Commissioning Investigation
A second investigation may focus on repeated commissioning failures.
A structured report could examine:
Testing records
Installation inspection records
Commissioning results
Non-conformance reports
Documentation
Interviews with commissioning personnel
The report may identify that commissioning failures are concentrated in systems where earlier testing was incomplete.
The conclusion may therefore identify a relationship between progressive verification and commissioning performance while recognising any limitations in the available evidence.
Using Appendices Effectively
Appendices should contain supporting information that is useful but too detailed for the main report.
Examples include:
Raw data
Interview questions
Survey instruments
Detailed inspection tables
Sample test records
Data-analysis calculations
Research instruments
Additional charts
The main report should remain readable without requiring the reader to examine every appendix.
Referencing and Evidence Management
A professional research report should clearly distinguish:
Researcher’s original analysis
Published evidence
Standards
Project documentation
Interview information
Observational evidence
References should be consistent with the required academic or organisational referencing system.
Technical claims should be supported by appropriate evidence rather than unsupported statements.
Maintaining Professional Technical Language
Electrical QA/QC reports should use accurate professional terminology.
Appropriate terms include:
Non-conformance
Inspection
Verification
Testing
Traceability
Corrective action
Quality assurance
Quality control
Root cause
Benchmark
Evidence
Reliability
Validity
Compliance
Defect recurrence
However, technical terminology should not be used unnecessarily. A professional report should remain accessible to readers with different responsibilities.
Writing for Different Audiences
The same research may be read by:
Electrical engineers
QA/QC engineers
Project managers
Site supervisors
Clients
Consultants
Academic assessors
Senior management
Therefore, the report should balance technical depth with clarity.
Senior management may need:
Key findings
Risks
Cost implications
Programme effects
Recommendations
Technical professionals may require:
Detailed evidence
Test data
Inspection findings
Methodology
Benchmark comparisons
A well-structured report can satisfy both audiences through layered presentation.
Quality Control of the Research Report
Before submission, the researcher should review the report systematically.
Check:
Research objectives are clearly stated.
Research questions are answered.
Methodology is explained.
Data sources are identified.
Findings are evidence-based.
Tables and figures are correctly labelled.
Conclusions follow from findings.
Recommendations follow from conclusions.
Limitations are acknowledged.
References are complete.
Terminology is consistent.
Formatting is professional.
Common Reporting Mistakes
Researchers should avoid:
Mixing findings and recommendations
Presenting unsupported conclusions
Using excessive technical jargon
Repeating the same information
Including irrelevant data
Presenting charts without interpretation
Hiding contradictory evidence
Ignoring research limitations
Making claims beyond the sample
Introducing new evidence in the conclusion
Using inconsistent terminology
Failing to connect findings with research objectives
Benefits of a Well-Structured QA/QC Research Report
A comprehensive report provides several benefits.
Improved Evidence Communication
Complex research becomes easier to understand.
Stronger Professional Credibility
A logical report demonstrates methodological and analytical competence.
Better Decision-Making
Managers and engineers can identify the most significant findings quickly.
Improved Traceability
Evidence can be followed from collection through to conclusion.
Better Quality Improvement
Recommendations can be connected directly to demonstrated quality weaknesses.
Improved Academic Assessment
Clear alignment between objectives, methodology, findings and conclusions makes achievement easier to evaluate.
Reduced Misinterpretation
Structured presentation reduces the risk that findings will be misunderstood.
Better Knowledge Transfer
Research outcomes can be communicated to future project teams and quality professionals.
A Step-by-Step Procedure for Structuring the Report
Stage 1: Define the Research Problem
Clearly identify the electrical QA/QC issue.
Stage 2: Establish the Aim and Objectives
Determine exactly what the research intends to investigate.
Stage 3: Develop Research Questions
Convert the research problem into focused questions.
Stage 4: Review Existing Knowledge
Identify relevant literature, standards and established practices.
Stage 5: Select the Methodology
Choose suitable research methods based on the research objectives.
Stage 6: Collect Evidence
Gather reliable and relevant data.
Stage 7: Analyse the Data
Identify patterns, relationships, anomalies and significant findings.
Stage 8: Organise the Findings
Use logical headings, tables and figures.
Stage 9: Discuss the Findings
Interpret the evidence and relate it to existing knowledge and practice.
Stage 10: Compare With Benchmarks
Evaluate findings against relevant industry expectations.
Stage 11: Formulate Conclusions
Develop objective conclusions based on the evidence.
Stage 12: Develop Recommendations
Identify practical improvement opportunities.
Stage 13: Review Limitations
Explain factors affecting confidence and generalisation.
Stage 14: Conduct a Final Quality Review
Check accuracy, consistency, structure, references and professional presentation.
Report Structure as an Evidence Chain
One of the most useful ways to understand professional research reporting is to view the report as an evidence chain:
Research Problem
↓
Research Objectives
↓
Research Questions
↓
Literature Review
↓
Methodology
↓
Data Collection
↓
Data Analysis
↓
Findings
↓
Discussion
↓
Benchmark Evaluation
↓
Conclusions
↓
Recommendations
If one link is weak, the credibility of the overall research may be affected.
For example, if the research question is poorly defined, the methodology may collect irrelevant data. If the data are poorly collected, findings may be unreliable. If findings are poorly interpreted, conclusions may become unsupported. If conclusions are weak, recommendations may not address the actual problem.
Case Study: Structuring a Comprehensive QA/QC Investigation
Background
An electrical engineering project has experienced recurring quality problems during installation and commissioning. Management wants to understand why defects continue to occur despite existing inspection procedures.
Research Problem
The central issue is recurring electrical QA/QC defects that result in rework and commissioning delays.
Research Objectives
The investigation aims to:
Identify common defects.
Determine contributing factors.
Evaluate existing QA/QC controls.
Compare findings against relevant benchmarks.
Determine practical implications.
Develop evidence-based conclusions.
Methodology
The researcher uses:
Inspection records
Non-conformance reports
Testing records
Site observations
Interviews
This provides both quantitative and qualitative evidence.
Findings
The research identifies:
Recurring termination defects
Inconsistent inspection timing
Documentation gaps
Variable supervision
Repeated corrective actions
Analysis
The researcher identifies relationships between late defect detection and rework.
Benchmark Evaluation
The findings are compared with applicable project requirements and recognised quality expectations.
Conclusion
The research concludes that existing controls are effective at detecting certain defects but provide opportunities for stronger early-stage prevention.
Recommendations
Potential improvements include:
Progressive inspection
Standardised work instructions
Improved competence verification
Better corrective-action tracking
The case demonstrates how a comprehensive report can convert complex evidence into a logical professional argument.
Final Report Review Framework
Before finalising the research report, learners should evaluate whether the document answers five fundamental questions:
What?
What QA/QC issue was investigated?
Why?
Why was the investigation necessary?
How?
How was evidence collected and analysed?
What Was Found?
What does the evidence demonstrate?
What Does It Mean?
What conclusions and practical implications arise?
If the report clearly answers these questions, its overall structure is likely to be coherent.
Conclusion
Structuring a comprehensive research report is essential for presenting complex electrical QA/QC investigations in a professional, logical and academically credible manner. A high-quality report provides a clear pathway from the original quality problem through the research objectives, methodology, evidence collection, analysis, findings, discussion, benchmark comparison, conclusions and recommendations. This structure ensures that the reader can understand not only what the research discovered but also how the researcher reached the final judgement.
For electrical engineering QA/QC research, effective reporting is particularly important because investigations frequently involve complex technical and organisational factors. Defects may originate from design information, material selection, installation practices, testing, inspection, competence, supervision, documentation, procurement or commissioning. A structured research report allows these factors to be presented systematically without losing the central research argument.
The strongest reports maintain clear separation between findings, analysis, conclusions and recommendations. Findings communicate the evidence; analysis identifies patterns and relationships; discussion interprets their significance; conclusions establish what the evidence supports; and recommendations translate those conclusions into potential workplace improvements. Tables, charts, process diagrams and appendices should be used where they improve understanding and traceability rather than simply increasing visual content.
A comprehensive report should also demonstrate research integrity. Contradictory evidence should be acknowledged, limitations should be clearly stated, and conclusions should remain within the boundaries of the research evidence. Where the investigation covers a limited sample or project environment, the researcher should avoid unsupported generalisation. This is particularly important when findings are used to influence professional QA/QC decisions.
Ultimately, the purpose of a professional research report is to transform complex research evidence into a clear, defensible and useful body of knowledge. By following the sequence of problem identification, objective setting, methodological design, evidence collection, analysis, findings, discussion, benchmark evaluation, conclusion and recommendation, electrical engineering researchers can communicate QA/QC investigations in a way that supports academic assessment, professional decision-making and continual quality improvement.
2. Utilize Advanced Academic and Technical Writing Skills to Articulate Research Outcomes Clearly to Industry Stakeholders
Effective communication of research outcomes is a fundamental professional competency in electrical engineering QA/QC. A technically rigorous investigation can lose much of its practical value if its findings are presented in language that is unclear, overly academic, poorly structured, or disconnected from the needs of industry stakeholders. Advanced academic and technical writing therefore requires the researcher to transform complex research evidence into accurate, concise, logically structured and professionally relevant communication that can be understood and acted upon by engineers, QA/QC professionals, project managers, consultants, clients, contractors and senior decision-makers.
In electrical engineering environments, research outcomes may involve complex datasets, inspection findings, testing results, quality trends, non-conformities, process weaknesses, benchmark comparisons and evidence concerning recurring defects. Industry stakeholders need to understand not only what the research discovered, but also why the findings matter, how reliable the evidence is, what risks or opportunities are involved, and what actions may reasonably follow. Advanced writing skills provide the bridge between technical investigation and professional decision-making. The researcher must therefore balance technical precision with accessibility, ensuring that important engineering terminology is retained while unnecessary complexity is removed.
At Level 6 diploma standard, effective research communication should demonstrate more than basic report-writing ability. Learners should be able to critically organise information, distinguish evidence from interpretation, communicate uncertainty appropriately, adapt language to different stakeholder groups, use professional terminology accurately, and develop conclusions and recommendations that are supported by the research evidence. The quality of written communication should reflect the quality of the underlying investigation.
Understanding Academic and Technical Writing in Electrical QA/QC
Academic writing and technical writing share several characteristics, including accuracy, evidence, logical structure and clarity, but they serve somewhat different purposes.
Academic writing primarily demonstrates understanding, analysis, evaluation and engagement with existing knowledge. Technical writing focuses more strongly on communicating technical information so that professionals can understand, evaluate and potentially act upon it.
Electrical QA/QC research often requires both forms of communication. A research report may contain academic analysis of existing literature while simultaneously presenting highly technical findings from inspections, testing, audits or workplace investigations.
Effective writing should therefore:
Present evidence accurately.
Explain technical concepts clearly.
Maintain logical progression.
Use appropriate professional terminology.
Distinguish fact from interpretation.
Avoid unsupported claims.
Communicate research limitations.
Connect findings with stakeholder concerns.
Present conclusions objectively.
Translate evidence into practical implications.
Key Concepts and Definitions
| Key concept | Definition | Application to electrical QA/QC research |
|---|---|---|
| Academic Writing | Structured communication demonstrating evidence-based analysis and evaluation | Explaining research findings using scholarly evidence |
| Technical Writing | Clear communication of specialised technical information | Reporting electrical testing or inspection outcomes |
| Stakeholder | Person or organisation affected by or interested in the research outcome | Client, engineer, contractor, consultant or manager |
| Technical Accuracy | Correct representation of technical information | Reporting test results without distortion |
| Clarity | Ease with which information can be understood | Explaining complex QA/QC findings logically |
| Conciseness | Communicating necessary information without unnecessary wording | Summarising major defects efficiently |
| Objectivity | Presenting evidence without inappropriate personal bias | Reporting favourable and unfavourable results fairly |
| Evidence | Information supporting a statement or conclusion | Inspection records, testing results and observations |
| Interpretation | Explanation of what evidence means | Explaining why recurring defects may be occurring |
| Research Outcome | Result or knowledge generated by an investigation | Identified causes of repeated quality failures |
| Technical Audience | Readers with relevant engineering or professional knowledge | QA/QC engineers and electrical consultants |
| Executive Audience | Decision-makers requiring concise strategic information | Project directors and senior management |
| Recommendation | Evidence-based proposed improvement | Strengthening inspection or verification controls |
| Research Limitation | Factor restricting interpretation or generalisation | Small sample or limited project access |
| Traceability | Ability to follow a conclusion back to its evidence | Linking findings to inspection records |
Why Advanced Writing Matters to Industry Stakeholders
Industry stakeholders often work under significant time and information pressures. A project manager may need to understand the commercial and programme implications of a quality problem quickly, while an electrical engineer may need detailed technical evidence to evaluate whether a proposed corrective action is appropriate.
Poor communication can result in:
Misinterpretation of technical findings
Incorrect prioritisation of quality issues
Delayed decision-making
Inappropriate corrective actions
Disagreement between project stakeholders
Loss of confidence in research
Difficulty implementing recommendations
Effective communication produces the opposite effect. It enables stakeholders to identify the problem, understand the evidence, evaluate its significance and make informed decisions.
Identifying the Information Needs of Stakeholders
Before writing research outcomes, the researcher should consider who will read the report and what information each audience requires.
Electrical QA/QC Engineers
They may require:
Technical evidence
Inspection findings
Test results
Defect classifications
Root-cause evidence
Benchmark comparisons
Corrective-action implications
Project Managers
They may focus on:
Programme impact
Rework
Cost implications
Quality trends
Resource requirements
Risk
Recommended actions
Clients and Consultants
They may require:
Compliance status
Evidence of quality performance
Significant findings
Risks
Assurance
Improvement measures
Senior Management
Senior decision-makers generally require:
Key findings
Strategic implications
Significant risks
Performance trends
Priority recommendations
Required decisions
The same research evidence may therefore need to be communicated differently depending on the audience.
Translating Complex Findings Into Clear Language
Electrical QA/QC research can contain highly technical information. The researcher should preserve technical accuracy while ensuring that the meaning is accessible.
For example, instead of writing:
“The observed non-conformance profile demonstrates a multidimensional deficiency in the proceduralisation of progressive verification mechanisms.”
A clearer professional statement would be:
“The findings indicate weaknesses in progressive inspection and verification controls.”
The second version communicates the same general idea more directly.
Principles of Clear Technical Writing
Accuracy
Every technical statement should reflect the available evidence.
Clarity
The reader should not have to interpret unnecessarily complicated language.
Precision
Use terminology that accurately describes the engineering issue.
Conciseness
Remove unnecessary words without removing important meaning.
Consistency
Use the same terms throughout the report.
Objectivity
Avoid emotionally loaded or unsupported statements.
Traceability
Important conclusions should be connected to identifiable evidence.
Relevance
Include information that contributes to the research purpose.
Using Appropriate Technical Terminology
Professional electrical QA/QC writing requires accurate terminology.
Relevant terminology may include:
Quality assurance
Quality control
Inspection
Testing
Verification
Validation
Non-conformance
Defect
Corrective action
Preventive control
Root cause
Compliance
Benchmark
Traceability
Quality performance
Rework
Commissioning
Test evidence
However, terminology should be used according to its actual meaning.
For example, a defect should not automatically be described as a non-conformance unless the available evidence demonstrates deviation from an applicable requirement.
Distinguishing Evidence From Interpretation
This is one of the most important aspects of advanced research writing.
Consider:
“Inspection records show that 28 termination defects were identified during the study period.”
This is evidence.
“Late-stage verification may be allowing installation errors to remain undetected until final inspection.”
This is an interpretation.
The researcher should make the distinction clear.
Useful language includes:
“The data indicate…”
“The findings suggest…”
“The evidence demonstrates…”
“The analysis identified…”
“This may indicate…”
“The available evidence supports…”
“A possible explanation is…”
These expressions help maintain appropriate levels of certainty.
Communicating Levels of Certainty
Research findings do not always provide absolute certainty.
The researcher should distinguish between:
Demonstrated evidence
Strong indication
Possible relationship
Preliminary finding
Uncertain interpretation
For example:
Strong:
“The testing records demonstrate repeated failures.”
More cautious:
“The available evidence suggests that inconsistent installation practices may contribute to repeated failures.”
The second statement is appropriate when the evidence does not establish direct causation.
Writing Objective Findings
Findings should be factual and evidence-based.
Avoid:
“The installation team performed very poorly.”
Prefer:
“Inspection records identified recurring installation defects across three work areas.”
The second statement is more objective because it identifies the evidence rather than making a personal judgement.
Presenting Research Outcomes to Industry Stakeholders
Research outcomes should generally follow a logical communication sequence:
Problem
What issue was investigated?
Evidence
What did the research discover?
Significance
Why does the finding matter?
Benchmark
How does performance compare with expectations?
Implication
What does the finding mean for the workplace?
Action
What improvement may be appropriate?
This structure helps stakeholders move from understanding the problem to evaluating potential responses.
Structuring a Research Findings Section
A professional findings section can be organised around the research objectives.
For example:
Finding 1: Defect Frequency
Present the major defect categories.
Finding 2: Defect Distribution
Show where defects occur.
Finding 3: Recurrence
Identify repeated problems.
Finding 4: Process Weaknesses
Present evidence concerning inspection or verification.
Finding 5: Benchmark Comparison
Compare results with relevant expectations.
Finding 6: Stakeholder Evidence
Present relevant interview or questionnaire findings.
This approach prevents the report from becoming a disconnected collection of observations.
Using Tables Effectively
Tables are particularly valuable when communicating complex QA/QC information.
For example:
| QA/QC issue | Evidence | Significance | Stakeholder implication |
|---|---|---|---|
| Termination defects | Inspection records | Rework and retesting | Installation controls require review |
| Documentation gaps | Quality records | Reduced traceability | Document control may require improvement |
| Testing failures | Test reports | Commissioning delays | Earlier verification may be beneficial |
| Repeat non-conformities | NCR records | Recurring quality weakness | Root-cause controls require evaluation |
The table gives stakeholders a quick overview while the surrounding paragraphs provide deeper interpretation.
Using Charts and Graphs
Charts should be used when visual presentation improves understanding.
Useful applications include:
Defect frequency
Monthly quality trends
Non-conformance categories
First-pass acceptance
Rework trends
Inspection performance
Testing outcomes
A chart should always be accompanied by a short explanation of what the reader should notice.
For example:
“The trend indicates a reduction in termination defects following the introduction of additional progressive inspection points.”
The researcher should avoid simply inserting a graph without interpreting it.
Communicating Research Findings in Executive Summaries
An executive summary should focus on information that supports decision-making.
A strong structure is:
Research purpose
Key evidence
Major finding
Significant implication
Main conclusion
Priority recommendation
Avoid excessive methodology detail in the executive summary unless it materially affects confidence in the findings.
Writing for Technical Professionals
Technical stakeholders generally require greater detail.
A technical section may include:
Test parameters
Inspection criteria
Defect classifications
Data trends
Benchmark comparisons
Methodological details
Technical limitations
Corrective-action considerations
However, technical detail should remain relevant to the research question.
Writing for Non-Technical Decision-Makers
A senior manager may not require every technical detail.
The researcher should explain:
What happened
Why it matters
What evidence supports the finding
What risk or opportunity exists
What decision may be required
Technical terminology should be explained where necessary.
For example:
Instead of simply stating:
“First-pass yield decreased by 12%.”
The researcher could write:
“First-pass acceptance decreased by 12%, meaning more installed work required correction or reinspection before approval.”
This provides the operational meaning of the technical measure.
Presenting Complex Data Without Overloading the Reader
Large amounts of data can obscure important findings.
The researcher should:
Highlight significant patterns.
Group similar data.
Use appropriate tables.
Summarise repetitive information.
Move detailed datasets to appendices.
Explain significant trends.
Avoid unnecessary duplication.
The purpose is not to show every piece of collected data but to present sufficient evidence to support the research argument.
Using the “Evidence–Meaning–Implication” Model
A useful writing technique is:
Evidence → Meaning → Implication
Evidence
“Twenty-eight termination defects were identified.”
Meaning
“Termination was one of the most frequent defect categories.”
Implication
“This concentration indicates that termination controls may warrant further review.”
This model is particularly effective for communicating research outcomes to industry stakeholders.
Academic Integrity in Research Communication
Advanced academic and technical writing must maintain research integrity.
The researcher should:
Report findings honestly.
Avoid manipulating data.
Acknowledge contradictory evidence.
Identify limitations.
Reference external sources appropriately.
Avoid plagiarism.
Avoid fabricated evidence.
Avoid unsupported claims.
Distinguish original analysis from published information.
Research credibility depends heavily on transparency.
Avoiding Overstatement
A common reporting weakness is making conclusions stronger than the evidence allows.
For example:
“The new inspection process eliminated quality problems.”
This is difficult to justify unless comprehensive evidence supports it.
A more defensible statement may be:
“The findings indicate a reduction in identified quality defects following implementation of the revised inspection process.”
The second statement is appropriately evidence-based.
Communicating Limitations to Stakeholders
Limitations should not be hidden because they provide important context.
Examples include:
Limited sample size
Single-project investigation
Short observation period
Incomplete historical data
Restricted access to records
Limited stakeholder participation
The researcher should explain how these limitations affect confidence in the findings.
Practical Implications of Research Findings
Industry stakeholders are particularly interested in what research findings mean for workplace performance.
Potential implications include:
Reduced rework
Improved inspection effectiveness
Better defect prevention
Improved traceability
Reduced commissioning delays
Improved documentation
Enhanced quality assurance
Better resource allocation
Improved supplier management
The researcher should avoid claiming benefits that were not demonstrated by the research.
Writing Evidence-Based Recommendations
Recommendations should be specific and connected to the findings.
Weak:
“Quality should be improved.”
Stronger:
“Introduce standardised termination verification points before cable testing to improve early detection of installation defects.”
The stronger recommendation identifies an action and its intended quality purpose.
Developing Action-Oriented Recommendations
A recommendation can be structured around:
Action
Reason
Responsibility
Priority
Expected outcome
Measurement
For example:
“Introduce a documented pre-testing termination inspection conducted by the responsible QA/QC engineer before commissioning activities. This should target the recurring termination defects identified in the research and be monitored through first-pass acceptance rates.”
Case Study: Communicating Recurring Electrical Defects
Background
A commercial electrical project has experienced repeated cable termination defects. The project team has reported increased rework and delays to final testing.
Research Finding
The investigation identifies:
Recurring termination defects.
Variation in installation practices.
Inconsistent progressive inspection.
Increased defects during periods of high workload.
Repeated corrective actions for similar issues.
Poor Communication
“Termination quality is poor because workers are not careful enough.”
This statement is subjective and does not communicate sufficient evidence.
Professional Communication
“The research identified recurring termination defects across multiple work areas. Inspection records indicate that defects were frequently detected during later-stage verification, while observations identified inconsistent application of installation and inspection procedures. The findings suggest that earlier verification and greater consistency in process controls may reduce recurrence.”
The second version is more useful because it connects evidence, interpretation and implication.
Case Study: Communicating Testing Failures
Suppose an electrical QA/QC investigation identifies repeated insulation-resistance testing failures.
The researcher should avoid immediately stating:
“The installation is unsafe.”
Instead, the report should establish:
Number of failed tests
Relevant testing context
Pattern of failures
Locations affected
Repeat occurrences
Available inspection evidence
Applicable benchmark
Research limitations
A professional conclusion could then explain what the evidence supports without exceeding the scope of the investigation.
Adapting Writing to Stakeholder Priorities
Different stakeholders may interpret the same finding differently.
For example, recurring defects may represent:
For the QA/QC Engineer
A process-control weakness.
For the Project Manager
Potential rework and programme impact.
For the Client
A quality assurance concern.
For the Contractor
Potential productivity and resource implications.
For Senior Management
A broader performance and risk issue.
Advanced writing should therefore communicate the technical finding while making its practical significance clear.
Process for Communicating Research Outcomes
Step 1: Identify the Audience
Determine who will read or use the research.
Step 2: Define the Key Message
Identify the most important finding.
Step 3: Select Supporting Evidence
Choose evidence that directly supports the message.
Step 4: Interpret the Evidence
Explain what the evidence means.
Step 5: Establish Significance
Explain why the finding matters.
Step 6: Compare With Benchmarks
Show how the outcome relates to relevant expectations.
Step 7: Explain Limitations
Identify factors affecting certainty.
Step 8: Develop Conclusions
State what can reasonably be established.
Step 9: Formulate Recommendations
Identify evidence-based improvement opportunities.
Step 10: Review the Communication
Check clarity, accuracy, objectivity and stakeholder relevance.
Key Benefits of Advanced Research Communication
Better Decision-Making
Clear research communication enables stakeholders to make evidence-based decisions.
Improved Quality Management
Findings can be translated into practical QA/QC improvements.
Increased Professional Credibility
Well-written research demonstrates technical and analytical competence.
Greater Stakeholder Confidence
Transparent evidence and clear conclusions improve trust.
Improved Knowledge Transfer
Research outcomes can be communicated to other teams and future projects.
Reduced Misinterpretation
Clear terminology and logical structure reduce misunderstanding.
Stronger Corrective Action
Stakeholders can better understand the relationship between defects, causes and proposed responses.
Improved Organisational Learning
Research findings can contribute to continual improvement and lessons learned.
Common Writing Errors to Avoid
Researchers should avoid:
Excessively long sentences.
Unsupported technical claims.
Unexplained abbreviations.
Excessive jargon.
Repetition.
Emotional language.
Unsupported causation.
Selective reporting.
Unclear conclusions.
Recommendations unrelated to findings.
Excessive use of passive voice.
Inconsistent terminology.
Poorly labelled tables and figures.
Presenting raw data without interpretation.
Improving Sentence Construction
Technical writing benefits from direct sentence construction.
Instead of:
“It was identified through the investigation that there were a number of defects which were found to have occurred within the termination activities.”
Use:
“The investigation identified recurring termination defects.”
The second sentence is shorter, clearer and more professional.
Using Active and Passive Voice Appropriately
Both forms can be useful.
Active:
“The QA/QC team reviewed 120 inspection records.”
Passive:
“Three recurring defect categories were identified.”
Active voice is useful when responsibility or action needs to be clear. Passive voice can be appropriate when the process or result is more important than the person performing it.
Using Headings and Subheadings
Headings allow stakeholders to navigate complex research.
Useful headings include:
Research Findings
Defect Trends
Benchmark Comparison
Root-Cause Evidence
Quality Implications
Research Limitations
Conclusions
Recommendations
Headings should accurately represent the content that follows.
Linking Findings to Research Objectives
A strong report should demonstrate that each objective has been addressed.
For example:
| Research objective | Evidence presented | Outcome |
|---|---|---|
| Identify recurring defects | Inspection records | Major defect categories established |
| Examine contributing factors | Interviews and observations | Process factors identified |
| Evaluate QA/QC controls | Procedure review | Control weaknesses identified |
| Compare with benchmarks | Standards and project requirements | Performance gaps evaluated |
| Develop improvements | Findings and analysis | Recommendations formulated |
This creates a clear evidence trail for both academic assessment and professional review.
Professional Review of Written Outcomes
Before communicating research outcomes to stakeholders, the researcher should ask:
Is the main finding immediately clear?
Is every important claim supported?
Are technical terms used correctly?
Is the language objective?
Are limitations acknowledged?
Can a non-specialist understand the main implication?
Can a technical professional verify the evidence?
Are recommendations linked to findings?
Are conclusions appropriately cautious?
Does the report distinguish evidence from interpretation?
Conclusion
Advanced academic and technical writing is essential for transforming electrical QA/QC research into information that industry stakeholders can understand, evaluate and use. The purpose of professional research communication is not simply to make a report grammatically correct or visually attractive. It is to establish a reliable communication pathway between technical evidence and professional decision-making.
A high-quality research outcome should clearly communicate the problem investigated, the evidence collected, the analytical findings, the significance of those findings, the comparison with relevant benchmarks, the limitations of the research and the conclusions that can reasonably be drawn. The writing should remain objective, precise and evidence-based while adapting its level of technical detail to the intended audience.
For electrical QA/QC professionals, this means being able to communicate complex issues such as recurring defects, inspection weaknesses, testing failures, non-conformities, rework patterns and quality-performance trends without oversimplifying the engineering evidence. The researcher should use appropriate terminology, logical structures, tables, charts and concise explanations to make complex information accessible without compromising technical accuracy.
The strongest research communication also recognises that different stakeholders require different forms of information. Engineers may require detailed technical evidence, QA/QC professionals may need traceable findings and benchmark comparisons, project managers may focus on programme and rework implications, while senior management may require concise conclusions and strategic recommendations. Advanced technical writing allows the same research evidence to be communicated effectively across these different professional perspectives.
Ultimately, the ability to articulate research outcomes clearly demonstrates an important Level 6 professional capability: the ability to convert research evidence into credible knowledge that can support quality improvement and informed decision-making. When academic rigour, technical accuracy, professional clarity and evidence-based judgement are combined, electrical QA/QC research becomes significantly more valuable to industry stakeholders and more capable of contributing to continual improvement.
3. Design Professional Visual Aids to Effectively Communicate Complex Electrical Data and Research Metrics
Professional visual communication is an essential component of effective electrical engineering QA/QC research. Complex investigations can generate substantial quantities of numerical data, inspection results, testing measurements, defect records, non-conformance information, quality-performance indicators, research metrics and benchmark comparisons. Presenting all of this information through paragraphs alone can make important patterns difficult to identify. Professional visual aids provide a structured method for converting complex research evidence into accessible visual information that allows engineers, QA/QC professionals, project managers, clients, consultants and senior decision-makers to understand important findings efficiently.
In electrical QA/QC research, visual aids should do more than improve the appearance of a report. They should support analysis, reveal relationships, communicate trends, highlight anomalies, demonstrate comparisons and strengthen the evidence behind research conclusions. A well-designed chart can demonstrate a changing defect rate more effectively than several paragraphs, while a comparison table can allow stakeholders to identify performance gaps against industry benchmarks immediately. Similarly, a process diagram can explain a complex quality-control workflow without requiring lengthy narrative explanation.
At Level 6 diploma standard, learners should be capable of selecting, designing and evaluating visual communication methods rather than simply inserting charts into a report. The choice of visual aid should be determined by the nature of the data, the research objective, the intended audience and the message that needs to be communicated. Visuals should be technically accurate, clearly labelled, appropriately scaled, professionally formatted and directly connected to the research findings. They should also maintain research integrity by avoiding misleading representations, inappropriate comparisons or unnecessary visual complexity.
Purpose of Visual Aids in Electrical QA/QC Research
The primary purpose of a visual aid is to make relevant information easier to understand without changing its meaning.
A professional visual aid can help stakeholders:
Identify quality trends quickly.
Compare different performance categories.
Recognise recurring defects.
Identify significant anomalies.
Understand relationships between variables.
Evaluate performance against benchmarks.
Understand research metrics.
Prioritise quality problems.
Interpret complex datasets.
Support evidence-based decisions.
Visual aids are particularly valuable where research findings contain multiple variables or large datasets.
For example, a table containing hundreds of inspection records may be technically accurate but difficult to interpret. A properly designed chart can summarise the same information and reveal the dominant defect categories immediately.
Understanding Visual Communication in QA/QC
Visual communication involves representing information through graphical or structured formats rather than relying entirely on written language.
Common visual aids include:
Tables
Bar charts
Line graphs
Pie or doughnut charts
Scatter plots
Heat maps
Process diagrams
Flowcharts
Research frameworks
Dashboards
Benchmark comparison charts
Trend diagrams
Infographics
Each type has a different purpose. Selecting the wrong visual can make the information harder to understand.
For example, a line chart is generally appropriate for showing change over time, whereas a scatter plot is more appropriate for investigating relationships between two quantitative variables.
Key Concepts and Definitions
| Key concept | Definition | Electrical QA/QC application |
|---|---|---|
| Visual Aid | A graphical method used to communicate information | Chart showing electrical defect trends |
| Data Visualisation | Representation of data using graphical formats | Displaying inspection performance |
| Research Metric | A measurable indicator used to evaluate research or quality performance | Defect rate or first-pass acceptance |
| Dashboard | Consolidated visual display of multiple indicators | QA/QC performance dashboard |
| Benchmark | Reference point used to evaluate performance | Comparison against a quality target |
| Trend | General direction of change in data | Monthly reduction in defects |
| Anomaly | Data point or pattern that differs significantly from expected behaviour | Unusual testing result |
| Correlation | Statistical association between variables | Relationship between workload and defects |
| Distribution | Pattern showing how data values are spread | Distribution of defect categories |
| KPI | Key performance indicator used to monitor performance | Non-conformance closure rate |
| Scale | Numerical range used on a chart axis | Voltage, defect count or percentage range |
| Legend | Visual key explaining symbols or categories | Identifying defect classifications |
| Data Label | Text identifying a specific data value | Percentage shown on a bar |
| Infographic | Visual presentation combining limited text and graphics | QA/QC research summary |
| Heat Map | Visual representation using intensity or categories | Areas with high defect concentration |
| Traceability | Ability to connect visual information to its source evidence | Chart linked to inspection records |
Why Visual Design Matters for Research Credibility
A visual aid can influence how stakeholders interpret research evidence. Poorly designed graphics may unintentionally exaggerate differences, hide important information or create false impressions.
Professional visual design therefore requires:
Accurate data.
Appropriate chart selection.
Consistent units.
Clear labels.
Appropriate scales.
Readable text.
Logical ordering.
Transparent source information.
Appropriate use of colour.
Consistent terminology.
The visual should reinforce the evidence rather than distort it.
Selecting the Appropriate Visual Aid
The first question should not be:
“What chart looks attractive?”
Instead, ask:
“What information needs to be communicated?”
The appropriate visual depends on the analytical purpose.
Comparing Categories
Use:
Bar charts
Horizontal bar charts
Comparison tables
Example:
Comparing the number of defects associated with cable installation, termination, testing and documentation.
Showing Trends
Use:
Line graphs
Trend charts
Example:
Showing monthly non-conformance levels.
Showing Relationships
Use:
Scatter plots
Relationship diagrams
Example:
Examining whether increased workload is associated with increased defect frequency.
Showing Composition
Use:
Stacked bars
Appropriate percentage charts
Example:
Showing the proportion of different defect categories.
Showing Processes
Use:
Flowcharts
Process diagrams
Research frameworks
Example:
Showing the QA/QC research process from data collection to conclusion.
Showing Geographic or Project Distribution
Use:
Heat maps
Site plans where appropriate
Example:
Identifying areas of a project with concentrated quality issues.
Designing Effective Bar Charts
Bar charts are highly useful for categorical electrical QA/QC data.
For example, a researcher may identify:
32 cable defects
28 termination defects
18 testing defects
24 documentation defects
12 equipment installation defects
6 labelling defects
A bar chart can quickly reveal which categories require the greatest attention.
A professional bar chart should include:
Clear title.
Meaningful category labels.
Appropriate numerical axis.
Consistent measurement units.
Readable values.
Appropriate ordering.
The categories may be ordered from highest to lowest frequency when prioritisation is important.
Designing Line Graphs for Quality Trends
Line graphs are particularly useful for time-series data.
For example, a QA/QC researcher may track monthly defects:
| Month | Defects |
|---|---|
| January | 34 |
| February | 31 |
| March | 28 |
| April | 24 |
| May | 19 |
| June | 17 |
A line graph can communicate the direction of change clearly.
The researcher should consider:
Consistent time intervals.
Appropriate axis scaling.
Clearly labelled units.
Relevant intervention points.
Avoiding unnecessary visual elements.
If a revised inspection procedure was introduced in April, the graph may help stakeholders consider whether the subsequent trend warrants further investigation.
Designing Benchmark Comparison Charts
Benchmark comparison is particularly important in electrical QA/QC research.
A visual can compare:
Actual Performance → Project Target → Industry Benchmark
For example:
| Metric | Actual | Target | Benchmark |
|---|---|---|---|
| First-pass acceptance | 82% | 90% | 95% |
| NCR closure | 76% | 85% | 90% |
| Inspection completion | 94% | 95% | 98% |
A grouped bar chart could allow stakeholders to identify gaps immediately.
However, the researcher must ensure that the metrics are genuinely comparable and that the benchmarks have the same definitions and measurement conditions.
Designing Research Dashboards
A research dashboard combines several important metrics into one visual interface.
An electrical QA/QC research dashboard might include:
Total defects.
Major defect categories.
First-pass acceptance.
Non-conformance rate.
Corrective-action closure.
Rework frequency.
Testing failures.
Inspection completion.
Benchmark comparison.
A dashboard should not contain every available metric. It should focus on indicators relevant to the research objectives.
Principles of an Effective Dashboard
A professional dashboard should:
Prioritise significant metrics.
Use consistent terminology.
Avoid unnecessary decoration.
Clearly distinguish actual results from benchmarks.
Display units consistently.
Provide sufficient context.
Identify the period covered.
Allow rapid interpretation.
The objective is decision support, not visual complexity.
Using Heat Maps for QA/QC Research
Heat maps can be effective when quality problems vary across locations, systems, work packages or process stages.
For example, a project may divide electrical work into:
Area A
Area B
Area C
Area D
The researcher can display defect concentration across these areas.
A heat map may help identify:
High-defect areas.
Repeated problem locations.
Areas requiring further investigation.
Possible relationships with work conditions.
However, the researcher should clearly explain what the intensity or categories represent.
Using Scatter Plots to Investigate Relationships
Scatter plots are useful for examining relationships between quantitative variables.
For example:
Workload → Defect Frequency
Each point could represent a project week.
The visual may help the researcher identify whether increased workload appears associated with increased defects.
However, the researcher must avoid claiming causation simply because a relationship appears visually.
An appropriate statement might be:
“The scatter plot indicates a possible positive relationship between workload and defect frequency; further analysis is required before causation can be established.”
Visualising Anomalies
Anomalies can be highlighted through:
Trend charts.
Scatter plots.
Control-style displays where appropriate.
Highlighted data points.
Comparison tables.
The researcher should explain why a result is considered unusual.
An anomaly may result from:
Measurement error.
Data-entry error.
Unusual operating conditions.
Genuine quality variation.
Environmental conditions.
Exceptional workload.
Process change.
Visual identification should lead to investigation rather than automatic judgement.
Designing Tables for Technical Research
Tables remain one of the most valuable visual aids in technical reporting.
A professional QA/QC table should:
Have a descriptive title.
Use consistent units.
Avoid excessive columns.
Group related information.
Use concise headings.
Include relevant source information.
Present values consistently.
For example:
| Finding | Evidence | Benchmark | Gap | Implication |
|---|---|---|---|---|
| Termination defects | 28 records | Project target | Above target | Review installation controls |
| Testing failures | 18 records | Quality target | Above target | Strengthen progressive testing |
| Documentation gaps | 24 records | Required records | Below expectation | Improve document control |
This format helps connect evidence directly with interpretation.
Using Infographics for Research Outcomes
Infographics can summarise complex research for stakeholders who need a rapid overview.
A professional electrical QA/QC infographic might show:
Problem → Data → Analysis → Finding → Benchmark → Conclusion
Each stage can contain one or two short labels.
Infographics should not replace detailed research analysis. They should provide a high-level summary.
Designing Visual Aids for Different Audiences
Technical Engineers
Use:
Detailed charts.
Technical tables.
Test-result comparisons.
Process diagrams.
Detailed metrics.
QA/QC Managers
Use:
Defect trends.
Non-conformance metrics.
Corrective-action performance.
Benchmark comparisons.
Project Managers
Use:
Rework trends.
Quality-related delays.
Priority issues.
Performance indicators.
Senior Management
Use:
High-level dashboards.
Key trends.
Significant deviations.
Priority recommendations.
The underlying evidence should remain consistent, even when presentation changes.
Using Colour Professionally
Colour can help distinguish categories, but it should not become decorative.
Colour can be used to:
Separate categories.
Highlight important deviations.
Distinguish actual performance from benchmarks.
Identify priority levels.
However, researchers should avoid excessive colours.
Visuals should remain understandable when:
Printed in grayscale.
Viewed on different screens.
Interpreted by people with colour-vision differences.
Patterns, labels and symbols can provide additional distinction.
Avoiding Misleading Visualisations
Research integrity applies to visual presentation as much as written content.
Avoid:
Manipulating axis scales to exaggerate differences.
Removing inconvenient data without explanation.
Using inconsistent units.
Comparing incompatible datasets.
Presenting percentages without sample size.
Using decorative 3D effects that distort proportions.
Hiding uncertainty.
Using inappropriate chart types.
For example, if defect levels change from 10 to 12, an axis beginning at 9 may visually exaggerate the difference. The scale should be appropriate to the analytical purpose.
Maintaining Data Accuracy
Before publishing a visual aid, verify:
Data values.
Calculations.
Percentages.
Units.
Dates.
Category names.
Benchmark values.
Source records.
A single incorrect figure can undermine confidence in the entire research report.
Presenting Percentages Correctly
Percentages should be calculated from clearly defined totals.
For example:
If 28 termination defects occur within 120 total defects:
28 ÷ 120 × 100 = 23.3%
The report should explain the denominator where necessary.
Avoid presenting percentages without sufficient context.
Communicating Research Metrics
Research metrics should be selected because they provide meaningful information.
Potential electrical QA/QC metrics include:
Defect rate.
First-pass acceptance rate.
Non-conformance rate.
Rework rate.
Corrective-action closure rate.
Inspection completion rate.
Testing failure rate.
Repeat-defect rate.
Average closure time.
The researcher should define each metric clearly.
Example: First-Pass Acceptance
First-pass acceptance measures the proportion of inspected work accepted without requiring corrective work or repeat inspection, according to the defined project measurement approach.
A research report may show:
First-Pass Acceptance = 82%
The visual should provide enough context to understand:
Measurement period.
Relevant work scope.
Target.
Benchmark.
Sample size where relevant.
Example: Non-Conformance Closure
A visual may present monthly closure performance.
This can help identify:
Improving performance.
Persistent backlog.
Seasonal changes.
Process bottlenecks.
Areas requiring management attention.
The researcher should distinguish between the number of NCRs raised and the rate at which they are closed.
Visualising Research Methodology
Visual aids can also explain how the research itself was conducted.
For example:
Research Question → Methodology → Data Collection → Analysis → Findings
This is useful when presenting research to academic assessors or professional stakeholders because it demonstrates methodological traceability.
Visualising the QA/QC Research Framework
A framework may show relationships between:
Inputs → QA/QC Processes → Quality Outcomes
Inputs might include:
Design information.
Materials.
Labour competence.
Procedures.
Processes might include:
Inspection.
Testing.
Verification.
Documentation.
Outcomes might include:
Defect levels.
Compliance.
Rework.
Commissioning performance.
Such diagrams can help stakeholders understand complex interactions.
Step-by-Step Procedure for Designing a Professional Visual Aid
Step 1: Define the Communication Objective
Determine exactly what the visual should communicate.
Step 2: Identify the Data Type
Establish whether the information is:
Categorical.
Numerical.
Time-based.
Geographic.
Relational.
Process-based.
Step 3: Identify the Audience
Determine the technical knowledge of the intended reader.
Step 4: Select the Appropriate Visual
Choose the chart, table or diagram that best matches the communication objective.
Step 5: Organise the Data
Check categories, units, dates and calculations.
Step 6: Create a Logical Hierarchy
Place the most important information where it can be identified quickly.
Step 7: Label Clearly
Use descriptive titles, axes, units and legends.
Step 8: Check Accuracy
Compare visual values against original research records.
Step 9: Add Interpretation
Explain the important pattern or finding.
Step 10: Review for Misleading Presentation
Check scales, categories, comparisons and omissions.
Step 11: Test Readability
Ensure the visual remains understandable at normal viewing size.
Step 12: Connect the Visual With the Research
Explain how it supports the research question, finding or conclusion.
Practical Example: Electrical Defect Dashboard
Consider a research project investigating installation quality.
The dashboard may display:
Total Defects: 120
First-Pass Acceptance: 82%
Repeat Defects: 31
NCR Closure: 76%
Testing Failures: 18
The dashboard could then include a bar chart showing defect categories and a trend chart showing monthly defect levels.
This combination provides a high-level view while allowing stakeholders to identify the most important issues.
Practical Example: Comparing QA/QC Performance
Suppose the research compares three work packages.
| Work package | Defects | First-pass acceptance |
|---|---|---|
| Package A | 18 | 94% |
| Package B | 31 | 82% |
| Package C | 12 | 96% |
A visual comparison immediately shows that Package B warrants further investigation.
The researcher should then examine why the performance differs rather than assuming the work package itself caused the poorer result.
Practical Example: Visualising Improvement
Suppose a revised inspection process is introduced during Month 4.
A line chart could show defect levels before and after implementation.
The chart might indicate a downward trend after the intervention.
However, the accompanying analysis should acknowledge other variables that changed during the same period.
Appropriate wording would be:
“The reduction in recorded defects following implementation is consistent with an improvement in quality performance; however, other changes during the study period mean that causation cannot be established from the trend alone.”
This combines visual communication with research integrity.
Designing Visual Aids for Presentations
When research findings are presented verbally, visual aids should be even more concise.
A presentation slide should generally focus on:
One main message.
One key chart or diagram.
Minimal supporting text.
Clearly visible figures.
Strong visual hierarchy.
A slide containing a complete research report is unlikely to communicate effectively.
Common Visual Design Errors
Researchers should avoid:
Too many charts on one page.
Tiny labels.
Excessive colours.
Decorative graphics.
Unnecessary 3D effects.
Missing units.
Unclear titles.
Inconsistent scales.
Unsupported benchmark comparisons.
Overloaded dashboards.
Charts without interpretation.
Data without sources.
Inconsistent terminology.
Evaluating the Effectiveness of a Visual Aid
A visual should be evaluated by asking:
Can the main message be identified quickly?
Are the data accurate?
Are categories clear?
Are units visible?
Is the scale appropriate?
Is the benchmark clearly identified?
Can the visual be interpreted without misleading assumptions?
Does it directly support the research objective?
Is it appropriate for the intended audience?
Does it improve understanding compared with text alone?
If the answer to several of these questions is no, the visual should be redesigned.
Key Benefits of Professional Visual Aids
Improved Comprehension
Complex data can be understood more quickly.
Faster Decision-Making
Stakeholders can identify significant findings without reviewing every data point.
Improved Pattern Recognition
Trends and relationships become easier to identify.
Better Benchmark Evaluation
Performance gaps can be displayed clearly.
Improved Research Credibility
Accurate and transparent visualisation strengthens professional presentation.
Enhanced Stakeholder Communication
Technical information becomes more accessible to different audiences.
Better Quality Improvement
Visual trends can help organisations identify recurring problems and improvement opportunities.
Stronger Academic Presentation
Well-designed visuals demonstrate the ability to communicate research evidence professionally.
Case Study: Visualising an Electrical QA/QC Investigation
Background
An electrical engineering project has recorded recurring defects over six months. The research team needs to communicate findings to the QA/QC manager, project manager and client.
Available Data
The researchers have:
Monthly defect records.
Inspection results.
Testing failures.
NCR records.
Corrective-action information.
Work-package data.
Visual Strategy
The researchers select:
A line chart for monthly defect trends.
A bar chart for defect categories.
A benchmark comparison table.
A compact KPI dashboard.
A process diagram showing the research methodology.
Findings
The visuals reveal:
Defects were concentrated in two work packages.
Termination issues were the largest category.
First-pass acceptance remained below the defined target.
Corrective-action closure improved over time.
Defect levels reduced after additional verification controls were introduced.
Interpretation
The visual evidence supports further investigation into termination processes and progressive verification.
However, the researchers avoid claiming that the additional controls alone caused the improvement because other project conditions changed during the same period.
Stakeholder Outcome
The QA/QC manager can identify priority areas quickly, while the technical team can access the detailed supporting evidence.
This demonstrates how visualisation can connect research data with workplace decision-making.
Advanced Visual Communication Strategy
At Level 6, learners should consider visual aids as part of the research argument rather than as decoration.
A strong visual communication strategy follows:
Research Objective → Data → Analytical Question → Visual Choice → Key Message → Interpretation
For example:
Objective: Identify recurring quality problems.
↓
Data: Inspection defect records.
↓
Analytical Question: Which defect categories occur most frequently?
↓
Visual Choice: Bar chart.
↓
Key Message: Termination defects are the largest category.
↓
Interpretation: Termination controls may require further evaluation.
This approach ensures that every visual has a clear analytical purpose.
Conclusion
Professional visual aids are an essential component of effective electrical engineering QA/QC research because they transform complex data and research metrics into information that stakeholders can interpret efficiently. Tables, charts, dashboards, process diagrams, benchmark comparisons, heat maps and other visual tools can reveal trends, relationships, anomalies and performance gaps that may be difficult to recognise through narrative text alone.
However, effective visualisation requires much more than selecting an attractive chart. The researcher must first understand the research objective, identify the nature of the data, determine the intended audience and select a visual format that communicates the required message accurately. Data must be checked carefully, units must remain consistent, scales must be appropriate and labels must be clear. Visuals must also maintain research integrity by avoiding exaggerated comparisons, selective presentation and unsupported interpretation.
For electrical QA/QC professionals, appropriate visualisation can provide particular value when presenting defect trends, inspection performance, testing outcomes, non-conformance data, rework, corrective-action performance and benchmark comparisons. A well-designed dashboard can give management an immediate overview of quality performance, while a detailed technical chart can help engineers investigate relationships between variables. Similarly, process diagrams can make research methodologies and quality-control systems easier to understand.
The strongest visual aids are directly connected to the research argument. They do not simply repeat the surrounding text; they help stakeholders understand what the evidence demonstrates and why it matters. Each visual should therefore have a clear purpose, an accurate data source, an appropriate design and a concise interpretation.
Ultimately, the ability to design professional visual aids demonstrates an important Level 6 research communication skill: the ability to convert complex electrical engineering evidence into clear, accurate and decision-relevant information. When visual accuracy, analytical reasoning, technical knowledge and professional design are combined, research outcomes become easier to understand, more credible to stakeholders and more useful for improving electrical QA/QC performance.
4. Research Methodologies, Findings, and Conclusions During a Formal Presentation or Review Process
Defending research methodologies, findings, and conclusions during a formal presentation or review process is an important professional competency for electrical engineering QA/QC specialists. Completing a research investigation is only one part of the research process; the researcher must also be able to explain, justify and critically defend the decisions made throughout the investigation. In a professional electrical QA/QC environment, research findings may be reviewed by Chartered Engineers, senior QA/QC managers, project directors, consultants, clients, academic assessors and other technical specialists. These stakeholders may challenge the reliability of the methodology, question the interpretation of data, request clarification of technical evidence, or ask whether the conclusions are sufficiently supported.
A successful research defence does not mean attempting to prove that every decision was perfect. Instead, it requires the researcher to demonstrate that decisions were reasonable, evidence-based, transparent and appropriate to the research objectives. A strong researcher should be able to explain why a particular methodology was selected, how data quality was controlled, how findings were analysed, how limitations were managed and why the conclusions represent a reasonable interpretation of the available evidence. Where weaknesses exist, they should be acknowledged rather than concealed.
For Level 6 electrical engineering QA/QC research, this requires a combination of academic reasoning, technical knowledge, professional judgement, communication skills and critical thinking. The researcher must be prepared to answer challenging questions without becoming defensive, distinguish evidence from personal opinion, explain methodological limitations and demonstrate that conclusions have not been exaggerated. The ability to defend research professionally therefore strengthens both the academic credibility and workplace value of the investigation.
Understanding the Purpose of a Formal Research Defence
A formal research presentation or review provides an opportunity for stakeholders to examine the quality and credibility of the research.
The review process may assess:
Whether the research problem was clearly defined.
Whether the methodology was appropriate.
Whether the data collection process was systematic.
Whether the evidence is reliable.
Whether the analysis was appropriate.
Whether alternative explanations were considered.
Whether the findings answer the research questions.
Whether the conclusions follow from the findings.
Whether the recommendations are justified.
Whether research limitations have been recognised.
The researcher should therefore prepare to defend the complete evidence chain rather than focusing only on the final results.
A useful way of understanding this process is:
Research Problem → Objectives → Methodology → Data → Analysis → Findings → Discussion → Conclusions
During a formal review, any link in this chain may be questioned.
Key Concepts and Definitions
| Key concept | Definition | Application in electrical QA/QC research |
|---|---|---|
| Research Defence | Formal justification of research decisions, evidence and conclusions | Explaining why a QA/QC methodology was selected |
| Methodology | Overall research approach used to investigate a problem | Qualitative, quantitative or mixed-method research |
| Research Design | Structured plan for conducting the investigation | Framework linking questions, data and analysis |
| Validity | Extent to which research measures or investigates what it intends to measure | Ensuring findings address the identified QA/QC problem |
| Reliability | Consistency and dependability of research measurements or procedures | Consistent collection of inspection data |
| Research Bias | Systematic influence that may distort research outcomes | Researcher preference affecting interpretation |
| Evidence | Information supporting a research statement or conclusion | Inspection records, test results and interviews |
| Finding | Result identified through systematic analysis | Recurring termination defects |
| Conclusion | Evidence-based judgement derived from findings | Determining whether existing controls are effective |
| Limitation | Factor restricting interpretation or generalisation | Small sample or limited project access |
| Triangulation | Comparison of evidence from multiple sources or methods | Comparing inspections, interviews and test records |
| Professional Judgement | Reasoned decision based on expertise and evidence | Evaluating the significance of a quality deviation |
| Critical Review | Systematic examination of research strengths and weaknesses | Challenging assumptions and alternative explanations |
| Defensible Conclusion | Conclusion supported sufficiently by available evidence | Avoiding unsupported claims of causation |
| Stakeholder | Individual or organisation with an interest in research outcomes | Client, consultant, QA/QC manager or project director |
Why Research Methodologies Must Be Defended
The methodology determines how evidence is generated. If the methodology is inappropriate, even accurate calculations and professionally presented findings may fail to answer the research question.
During a formal review, stakeholders may ask:
Why was this methodology selected?
Why were alternative methods rejected?
Why was this sample size considered appropriate?
Why were particular participants selected?
Why were specific data sources used?
How was data quality controlled?
How were bias and limitations addressed?
Why was a particular analytical technique selected?
The researcher should be able to answer these questions by referring to the research objectives rather than personal preference.
For example, saying:
“I chose interviews because I thought they would be useful.”
is weak.
A stronger defence would be:
“Interviews were selected because the research objective required an understanding of the operational factors contributing to recurring QA/QC defects. Inspection records could establish the frequency and location of defects but could not adequately explain how procedures were interpreted or applied by personnel.”
This demonstrates methodological reasoning.
Defending Qualitative Methodologies
Qualitative research can be appropriate where the research investigates:
Professional experiences.
Perceptions of quality procedures.
Organisational practices.
Reasons for recurring problems.
Interpretation of procedures.
Workplace behaviours.
Implementation challenges.
A researcher defending qualitative methods should explain that the purpose is to obtain detailed contextual understanding rather than simply numerical measurement.
Possible defence points include:
The research question required contextual information.
Participants had relevant professional experience.
Interviews provided information unavailable from records.
Observations helped verify reported practices.
Qualitative data were analysed systematically.
Evidence from different sources was compared.
Defending Quantitative Methodologies
Quantitative methods are appropriate when the research requires measurable evidence.
Examples include:
Defect frequency.
Failure rates.
Testing results.
Inspection performance.
Rework levels.
First-pass acceptance.
Corrective-action closure.
Quality trends.
During a review, the researcher should explain:
How measurements were defined.
How data were collected.
Why the dataset was appropriate.
How calculations were performed.
How missing data were treated.
How results were interpreted.
The researcher should also avoid claiming that numerical evidence automatically establishes causation.
Defending Mixed-Methods Research
A mixed-method approach can be appropriate where both numerical and contextual evidence are required.
For example:
Quantitative data:
Inspection records demonstrate how frequently defects occur.
Qualitative data:
Interviews and observations help explain why defects may be recurring.
The researcher can defend the approach by explaining that the two evidence types address complementary aspects of the research problem.
The methodology may therefore provide:
Measurement of quality performance.
Contextual understanding.
Cross-validation of findings.
Greater analytical depth.
Better understanding of workplace conditions.
Defending the Research Sample
Sample selection is often questioned during formal reviews.
The researcher should be able to explain:
Why the sample was selected.
What population it represents.
How inclusion criteria were established.
Whether the sample is sufficiently relevant.
What limitations arise from its size.
For example, a study conducted on one electrical project should not claim that its findings automatically represent every electrical engineering project.
A defensible statement would be:
“The selected project provided a relevant environment for investigating the identified QA/QC issue; however, the single-project scope limits wider generalisation.”
This demonstrates academic and professional maturity.
Defending Data Collection Procedures
The researcher should explain how data were collected consistently.
Relevant controls may include:
Standardised data collection forms.
Defined defect categories.
Consistent inspection criteria.
Controlled interview questions.
Document verification.
Date and location recording.
Data validation.
Duplicate checking.
The researcher should demonstrate that data were not collected selectively to support a preferred conclusion.
Defending Data Quality
Questions may focus on whether the data were accurate and reliable.
The researcher should be prepared to explain:
Source of the data.
Collection period.
Data validation.
Missing records.
Measurement consistency.
Data classification.
Error checking.
For electrical QA/QC research, this may involve verifying inspection records against:
Test certificates.
Non-conformance reports.
Site observations.
Quality records.
Commissioning documents.
Defending Research Findings
Research findings should be defended by returning to the evidence.
A useful structure is:
Claim → Evidence → Analysis → Significance
For example:
Claim: Termination defects were a significant quality issue.
Evidence: Inspection records identified 28 termination-related defects.
Analysis: Termination defects represented a substantial proportion of recorded installation issues.
Significance: The concentration indicates that termination activities require further evaluation.
This approach prevents the researcher from relying on unsupported assertions.
Distinguishing Findings From Opinions
A formal review may challenge whether a conclusion represents evidence or personal opinion.
Weak:
“I believe the workers need better training.”
Stronger:
“Interview and observation evidence identified inconsistent interpretation of termination procedures, suggesting that competence verification and procedural understanding require further evaluation.”
The second statement identifies the evidence behind the interpretation.
Defending Analytical Decisions
Researchers may be asked why a particular analytical method was used.
The answer should relate directly to the research objective.
For example:
“A frequency analysis was used because the research required identification of the most common defect categories.”
Or:
“A trend analysis was used because the research examined changes in defect occurrence over the study period.”
The researcher should avoid selecting analytical methods simply because they are technically sophisticated.
The most appropriate method is the one that answers the research question effectively.
Defending Benchmark Comparisons
Where findings are compared with industry standards or best practices, the researcher should explain:
Why the benchmark was selected.
Whether it was applicable.
Whether the definitions were comparable.
Whether the relevant edition was used.
Whether project-specific requirements were considered.
How differences were interpreted.
A benchmark should never be treated as relevant simply because it is well known.
Defending Conclusions
A conclusion should be directly connected to the evidence.
The researcher should be able to answer:
Which findings support this conclusion?
Which research objective does it address?
What alternative explanations were considered?
What limitations affect confidence?
Is the conclusion broader than the research evidence?
A strong conclusion may acknowledge uncertainty.
For example:
“The evidence supports an association between inconsistent progressive inspection and recurring installation defects, although the research design does not establish that inspection practices alone caused the defects.”
This is more defensible than:
“Inadequate inspection caused all defects.”
Defending Against Challenges to Causation
Causation is one of the most challenging areas in research review.
A reviewer may ask:
“How do you know that factor A caused factor B?”
The researcher should distinguish:
Correlation.
Association.
Contribution.
Causation.
If the methodology does not establish causation, the researcher should say so.
Appropriate expressions include:
“The findings indicate an association.”
“The evidence suggests a possible contribution.”
“The available data support this interpretation.”
“Causation cannot be established within the research scope.”
This demonstrates intellectual honesty.
Defending Research Limitations
A limitation is not necessarily a weakness that invalidates the research.
It is a factor that affects how findings should be interpreted.
Common limitations include:
Small sample.
Single project.
Limited observation period.
Incomplete historical records.
Restricted stakeholder participation.
Limited access to technical documentation.
Potential participant bias.
The researcher should explain:
What the limitation was.
Why it existed.
How it affected the research.
What mitigation was applied.
How it affects interpretation.
Managing Challenging Questions
A formal review may involve difficult or unexpected questions.
The researcher should avoid becoming defensive.
A useful approach is:
Listen
Allow the reviewer to complete the question.
Clarify
If necessary, confirm what aspect is being questioned.
Answer Directly
Provide the main answer first.
Provide Evidence
Refer to the relevant data or research section.
Acknowledge Limitations
Where appropriate, explain uncertainty.
Conclude
Return to the research objective.
For example:
“That is an important limitation. The study did not establish causation between workload and defect occurrence. However, the quantitative data identified an association, and this was supported by observations of increased process variability during high-workload periods.”
Handling Questions You Cannot Fully Answer
A researcher should never invent an answer.
A professional response may be:
“The available research data do not provide sufficient evidence to answer that question conclusively. It would require a longer observation period or additional data.”
This demonstrates research integrity.
Defending Research Against Alternative Interpretations
A strong researcher should consider alternative explanations.
Suppose defects increased during a period of high workload.
Possible explanations may include:
Increased workload.
Reduced supervision.
New personnel.
Material changes.
Design revisions.
Programme pressure.
Changes in inspection frequency.
The researcher should explain why the preferred interpretation is supported while acknowledging other possibilities.
Presenting Research Defence Professionally
A formal presentation should have a logical structure.
Suggested Presentation Structure
Research title.
Research problem.
Background.
Research aim.
Research objectives.
Research questions.
Methodology.
Data sources.
Key findings.
Benchmark comparison.
Discussion.
Conclusions.
Limitations.
Recommendations.
Final research implications.
The presentation should focus on the most significant information rather than reproducing the entire written report.
Using Visual Aids During the Defence
Visual aids can strengthen the defence when used appropriately.
Useful visuals include:
Research framework.
Methodology flowchart.
Defect trend charts.
Benchmark comparisons.
Data tables.
Process diagrams.
Research outcome dashboards.
Each visual should have a clear purpose.
For example:
Research Question → Methodology → Evidence → Analysis → Finding → Conclusion
This helps reviewers understand how the research argument was developed.
Responding to Methodological Criticism
Suppose a reviewer asks:
“Why did you not use a larger sample?”
A professional response might be:
“The sample was restricted by access to verified project records. The selected dataset was sufficient to address the defined project-level research objective, but I recognise that the limitation reduces the generalisability of the findings.”
This answer does three things:
Explains the decision.
Justifies it within context.
Acknowledges the limitation.
Responding to Criticism of Findings
If a reviewer challenges a finding, the researcher should return to evidence.
For example:
“The finding is based on inspection records covering the defined study period. The same pattern was also identified through site observations, which provided supporting evidence. However, the research does not establish that the observed pattern would occur in every project environment.”
This demonstrates triangulation and appropriate caution.
Responding to Criticism of Conclusions
If a conclusion is challenged, the researcher should explain its evidence chain.
A useful structure is:
Finding 1 + Finding 2 + Finding 3 → Analytical Interpretation → Conclusion
This demonstrates that the conclusion was not arbitrary.
Practical Example: Defending an Electrical QA/QC Study
Research Problem
A project experienced repeated cable termination defects and commissioning delays.
Methodology
The researcher used:
Quantitative inspection records.
Testing results.
Site observations.
Semi-structured interviews.
Findings
The research identified:
Repeated termination defects.
Inconsistent inspection timing.
Variability in work instructions.
Higher defect frequency in selected work periods.
Conclusion
The findings indicated weaknesses in progressive verification and process consistency.
Review Challenge
A reviewer asks:
“How can you claim inspection weakness when the defects were eventually identified?”
Professional Defence
“The evidence demonstrates that final inspection was effective at detecting defects. The research conclusion does not state that inspection was ineffective overall. Rather, the findings indicate that defects were frequently detected late, resulting in rework. Therefore, the research suggests that earlier progressive verification could strengthen prevention and reduce late-stage detection.”
This is a strong defence because it distinguishes detection from prevention.
Practical Example: Defending a Mixed-Methods Study
A reviewer asks:
“Why were interviews necessary when you already had inspection records?”
A suitable response is:
“The inspection records quantified the frequency and location of defects but did not adequately explain the operational factors contributing to recurrence. Interviews provided contextual evidence concerning procedure interpretation, supervision and workflow. The two evidence sources were therefore complementary rather than interchangeable.”
Practical Example: Defending a Limited Dataset
A reviewer asks:
“Your study only covers one project. Why should industry stakeholders consider the findings?”
A suitable response is:
“The findings should not be interpreted as universally representative. Their value lies in providing evidence about the investigated project environment and identifying quality-control patterns that may warrant further investigation elsewhere. The report explicitly recognises the limitation on generalisation.”
This demonstrates professional judgement.
Professional Presentation Techniques
During a formal presentation, the researcher should:
Maintain a logical sequence.
Speak clearly.
Avoid reading every word from slides.
Explain technical terms where required.
Use visuals to support important findings.
Maintain professional body language.
Control presentation timing.
Answer questions directly.
Avoid unnecessary arguments.
Acknowledge limitations honestly.
The objective is to demonstrate command of the research rather than simply recite its content.
Preparing for the Question-and-Answer Session
Before the presentation, the researcher should identify likely challenge areas.
Potential questions include:
Methodology
Why was this method selected?
Why were alternatives rejected?
Was the sample adequate?
How was bias managed?
Data
Where did the data come from?
How was accuracy verified?
How were missing records treated?
Analysis
Why was this analytical method used?
Could another explanation exist?
Does correlation establish causation?
Findings
Which finding is most significant?
What evidence supports it?
Were contradictory findings identified?
Conclusions
How does the evidence support the conclusion?
Is the conclusion appropriately limited?
What would change your conclusion?
Recommendations
Why is this recommendation appropriate?
What evidence supports it?
How could effectiveness be measured?
Research Defence Preparation Matrix
| Review area | Likely challenge | Evidence required | Defence approach |
|---|---|---|---|
| Methodology | Why this method? | Research objectives | Explain methodological fit |
| Sampling | Why this sample? | Selection criteria | Explain relevance and limitations |
| Data | Is it reliable? | Source and validation records | Explain quality controls |
| Analysis | Why this method? | Analytical framework | Link method to research question |
| Findings | What supports this? | Raw and analysed data | Show evidence chain |
| Conclusions | How justified? | Findings and discussion | Demonstrate logical connection |
| Limitations | What weakens confidence? | Limitation analysis | Acknowledge and contextualise |
| Recommendations | Why this action? | Findings and conclusions | Show evidence-based rationale |
Key Benefits of Defending Research Effectively
Increased Research Credibility
A well-defended investigation demonstrates that research decisions were considered carefully.
Stronger Professional Authority
The researcher demonstrates technical understanding and professional judgement.
Improved Stakeholder Confidence
Stakeholders are more likely to trust findings when the evidence and limitations are clearly explained.
Better Decision-Making
A defensible research presentation gives decision-makers confidence when considering quality improvements.
Stronger Academic Performance
A clear defence demonstrates higher-order learning, including analysis, evaluation and professional judgement.
Improved Quality Improvement
Research findings can be translated into practical workplace improvements.
Greater Transparency
Challenges and limitations are addressed openly rather than concealed.
Common Mistakes During Research Defence
Researchers should avoid:
Becoming defensive when challenged.
Claiming certainty where evidence is limited.
Ignoring contradictory evidence.
Blaming participants or colleagues.
Using unexplained technical terminology.
Reading directly from slides.
Presenting excessive raw data.
Making unsupported causal claims.
Changing conclusions simply to satisfy a reviewer.
Inventing information when uncertain.
Ignoring research limitations.
Confusing professional opinion with research evidence.
A Step-by-Step Procedure for Defending Research
Stage 1: Revisit the Research Question
Ensure every major conclusion can be connected to the original question.
Stage 2: Review the Methodology
Prepare clear justification for every major methodological decision.
Stage 3: Verify the Evidence
Check key figures, calculations, records and sources.
Stage 4: Identify the Strongest Findings
Select the findings that most directly answer the research objectives.
Stage 5: Identify Limitations
Prepare transparent explanations for important limitations.
Stage 6: Identify Alternative Explanations
Consider what else could account for the findings.
Stage 7: Prepare Benchmark Evidence
Know which standards, targets or best-practice references support the comparison.
Stage 8: Prepare Difficult Questions
Anticipate methodological, technical and analytical challenges.
Stage 9: Practise the Presentation
Ensure the presentation remains within the required time.
Stage 10: Conduct a Mock Review
Ask a colleague or assessor to challenge the methodology and conclusions.
Stage 11: Refine Responses
Make answers concise, evidence-based and professional.
Stage 12: Present With Confidence
Use evidence, professional judgement and appropriate acknowledgement of uncertainty.
Advanced Defence Strategy: The Evidence Chain
One of the strongest methods for defending research is to maintain a clear evidence chain.
Research Question
What needs to be established?
↓
Methodology
How will it be investigated?
↓
Data
What evidence was obtained?
↓
Analysis
What does the evidence demonstrate?
↓
Finding
What was identified?
↓
Discussion
What does it mean?
↓
Conclusion
What can reasonably be established?
↓
Recommendation
What action may be appropriate?
When challenged, the researcher can return to this chain.
For example, if a reviewer challenges a recommendation, the researcher can explain:
“The recommendation arises from Finding 3, which was supported by inspection records and interview evidence. The conclusion identified a weakness in progressive verification, and the recommendation was therefore designed to address that specific process weakness.”
This is much stronger than simply saying:
“It seemed like the best recommendation.”
Case Study: Formal Review of an Electrical QA/QC Investigation
Background
An electrical engineering project experienced recurring defects during installation and commissioning. The researcher investigated the issue to determine whether existing QA/QC controls were effective.
Research Methodology
The researcher used:
Inspection records.
Non-conformance reports.
Testing records.
Site observations.
Interviews with relevant personnel.
The mixed-method approach allowed the researcher to combine numerical defect evidence with contextual workplace information.
Key Findings
The investigation identified:
Recurring termination defects.
Late-stage defect detection.
Inconsistent application of work instructions.
Differences in defect rates between work packages.
Repeated corrective actions for similar issues.
Research Conclusion
The evidence suggested that the existing QA/QC system was capable of detecting defects but that opportunities existed to strengthen preventive and progressive verification controls.
Formal Review Challenge
The review panel asks:
“Why do you conclude that progressive verification requires improvement when the final inspection successfully identified the defects?”
Defence
“The research distinguishes defect detection from defect prevention. Final inspection demonstrated value because it identified defects before final acceptance. However, the evidence also showed that many defects were detected late, after installation activities had progressed. This resulted in additional rework and retesting. The conclusion therefore does not claim that final inspection was ineffective; it identifies an opportunity to strengthen earlier verification to reduce late-stage defect detection.”
This response demonstrates:
Technical understanding.
Evidence-based reasoning.
Balanced judgement.
Recognition of existing controls.
Appropriate interpretation.
Avoidance of overstatement.
Conclusion
Defending research methodologies, findings and conclusions during a formal presentation or review process is a critical component of professional electrical engineering research. A strong research defence demonstrates that the researcher understands not only what was discovered but also how the evidence was generated, analysed and interpreted. It requires the ability to justify methodological choices, explain data quality, defend analytical decisions, interpret findings objectively and demonstrate that conclusions are proportionate to the available evidence.
At Level 6, learners should approach research defence as a process of reasoned professional communication rather than an attempt to prove that their research is beyond criticism. Strong researchers recognise that legitimate questions and alternative interpretations can improve the quality of an investigation. They respond by referring to evidence, explaining methodological decisions, acknowledging limitations and distinguishing what the research demonstrates from what remains uncertain.
For electrical QA/QC investigations, this capability is particularly important because research findings may influence inspection procedures, testing strategies, corrective actions, quality controls, project decisions and continual improvement. A researcher must therefore be able to communicate findings to technical specialists as well as managers and other stakeholders who may not require the same level of engineering detail.
The strongest defence follows a clear evidence chain: research problem, objectives, methodology, data, analysis, findings, discussion, conclusion and recommendation. When each link is logically connected, the researcher can respond to challenging questions with confidence and transparency. If evidence is limited, the researcher should acknowledge the limitation rather than exaggerate certainty. If alternative explanations exist, they should be considered openly. If a reviewer identifies a genuine weakness, the researcher should demonstrate how it affects interpretation and whether it was addressed within the study.
Ultimately, the ability to defend research demonstrates the integration of academic knowledge, electrical engineering expertise, QA/QC competence, analytical reasoning and professional judgement. A well-defended research project provides stakeholders with greater confidence that its findings are credible, its conclusions are objective and its recommendations are grounded in evidence. This transforms research from a written academic exercise into a professional resource capable of supporting informed decision-making and continual improvement in electrical engineering quality assurance and quality control.