
Lesson 4: Collect, analyse, and interpret data from electrical engineering contexts.
Collecting, analysing, and interpreting data is a fundamental part of effective electrical Quality Assurance and Quality Control (QA/QC) research. This lesson develops learners’ ability to work systematically with information generated from electrical engineering environments, including inspection records, testing results, quality reports, non-conformance records, performance measurements, technical documentation, and professional observations. Accurate data handling enables researchers to move beyond assumptions and develop evidence-based conclusions about electrical quality, reliability, performance, and process effectiveness.
Electrical engineering data can be complex because it may include both numerical measurements and qualitative information from workplace practices, professional experiences, project records, and quality investigations. This lesson explores how to identify appropriate data sources, apply structured collection techniques, organise and analyse information, recognise patterns and relationships, and interpret findings within their engineering context. Learners will develop an understanding of how data quality, reliability, validity, consistency, and potential bias can influence research outcomes and why careful interpretation is essential when investigating electrical QA/QC issues.
Effective data analysis and interpretation allow researchers to transform raw engineering information into meaningful evidence that supports professional decision-making and continuous quality improvement. By applying appropriate analytical approaches to electrical engineering data, learners can identify recurring defects, evaluate QA/QC performance, investigate variations, assess improvement opportunities, and develop defensible conclusions. The lesson therefore strengthens advanced research and analytical capabilities required to support reliable electrical systems, improved quality management, and evidence-based solutions to contemporary electrical engineering challenges.
1. Implement Systematic Procedures to Collect Accurate Data from Complex Electrical Engineering Environments
Accurate data collection is a fundamental requirement for credible electrical engineering research, particularly when investigating Quality Assurance and Quality Control (QA/QC) issues. Complex electrical environments generate information from multiple sources, including inspection records, testing instruments, commissioning documentation, non-conformance reports, maintenance records, project observations, technical specifications, quality management systems, and professional personnel. Without a systematic data collection procedure, these sources can produce inconsistent, incomplete, duplicated, or biased information that weakens the reliability of research findings. A structured approach ensures that evidence is collected consistently and remains directly connected to the research question and investigation objectives.
In electrical QA/QC research, data collection should be treated as a controlled research process rather than simply gathering as much information as possible. Researchers need to determine what information is required, where it can be obtained, how it will be recorded, and how its accuracy will be checked. This becomes particularly important in complex engineering environments where electrical systems may involve multiple contractors, inspection stages, testing activities, equipment types, project phases, and quality control requirements. A systematic procedure allows researchers to establish traceability between the original evidence and the conclusions developed from it.
The quality of collected data directly influences the validity of electrical engineering research. For example, if inspection results are recorded inconsistently across different project teams, comparing defect rates may produce misleading conclusions. Similarly, if testing data are collected without recording the relevant operating conditions, equipment configuration, measurement method, or time of testing, the results may lack sufficient context for meaningful analysis. Therefore, effective data collection requires attention to accuracy, consistency, completeness, relevance, traceability, confidentiality, and methodological suitability.
Understanding Systematic Data Collection in Electrical QA/QC Research
Systematic data collection is the planned and consistent process of gathering information according to predefined procedures, criteria, sources, and recording methods. The purpose is to ensure that collected evidence is suitable for answering the research question and supporting reliable analysis.
A systematic procedure normally establishes:
- What data will be collected
- Why the data are required
- Where the data will be obtained
- Who will collect the information
- When collection will take place
- How information will be recorded
- How data accuracy will be checked
- How confidential information will be protected
In electrical engineering research, the procedure should reflect the technical and operational characteristics of the environment being studied.
For example, research into recurring electrical installation defects may require information from:
- Inspection reports
- Installation checklists
- Testing records
- Non-conformance reports
- Corrective action records
- Project observations
- Interviews with relevant personnel
Collecting these sources systematically allows the researcher to compare evidence and identify relationships between different aspects of quality performance.
Key Concepts in Accurate Electrical Engineering Data Collection
| Key Concept | Definition | Application in Electrical QA/QC Research |
|---|---|---|
| Data Accuracy | Degree to which recorded information correctly represents the actual condition or measurement | Ensures inspection and testing findings are dependable |
| Data Completeness | Extent to which all required information has been captured | Prevents important evidence from being omitted |
| Data Consistency | Degree to which information is collected and recorded using the same approach | Enables meaningful comparison between projects or periods |
| Data Relevance | Extent to which collected information directly supports the research question | Prevents unnecessary data collection |
| Data Traceability | Ability to identify the origin and history of collected information | Supports verification and auditability |
| Data Validity | Extent to which data accurately represent the intended research variable | Strengthens research conclusions |
| Data Reliability | Consistency of information when collected under comparable conditions | Improves confidence in findings |
| Sampling | Selection of a defined portion of available data or participants | Makes large investigations manageable |
| Data Protocol | Predefined procedure governing data collection and recording | Promotes systematic research practice |
| Data Verification | Process of checking information for errors or inconsistencies | Reduces inaccurate research evidence |
Defining the Data Requirements
The first stage of systematic data collection is determining exactly what information the investigation requires. Researchers should avoid collecting information simply because it is readily available. Excessive irrelevant information can make research difficult to manage and can distract from the central QA/QC problem.
The data requirements should be derived from:
- The research question
- Research objectives
- Assessment criteria
- Identified knowledge gaps
- Selected methodology
- Variables being investigated
For example, if the research question concerns the effectiveness of electrical inspection procedures, useful data may include:
- Number of inspections completed
- Defects identified
- Defect categories
- Inspection timing
- Corrective actions
- Repeat defects
By contrast, unrelated information about project administration may have limited research value.
Establishing Data Variables
Researchers should identify the variables that need to be measured or examined.
Possible variables include:
- Defect frequency
- Inspection duration
- Testing results
- Equipment performance
- Corrective action time
- Personnel experience
- Training levels
- Documentation accuracy
Each variable should have a clear operational definition so that different data collectors understand what should be recorded.
Selecting Appropriate Data Sources
Electrical engineering research can use both primary and secondary data.
Primary Data
Primary data are collected directly for the research investigation.
Examples include:
- Interviews
- Surveys
- Observations
- Direct measurements
- Structured inspections
Primary data can be specifically designed to address the research question.
Secondary Data
Secondary data already exist and are subsequently used for research purposes.
Examples include:
- Historical inspection reports
- Testing records
- Quality audits
- Non-conformance records
- Maintenance documentation
- Project performance records
Secondary data can provide valuable evidence, particularly when investigating historical quality trends.
Evaluating Data Source Quality
Before using a data source, researchers should consider:
- Who produced the information?
- When was it produced?
- Why was it collected?
- What procedure was used?
- Is the information complete?
- Can the information be verified?
- Is it relevant to the research question?
A technically detailed document is not automatically a reliable research source. Its collection process and context must also be considered.
Developing a Data Collection Protocol
A data collection protocol provides standardised instructions for gathering information. It reduces variation between data collectors and helps ensure that the same criteria are applied throughout the research.
A suitable protocol may specify:
- Data categories
- Measurement criteria
- Collection frequency
- Recording format
- Source identification
- Verification requirements
- Confidentiality controls
For example, a defect-recording protocol may require each defect to include:
- Defect category
- Location
- Detection date
- Detection stage
- Severity classification
- Corrective action
- Closure status
This creates a consistent dataset that can subsequently be analysed.
Designing Data Collection Instruments
Data collection instruments are tools used to capture information systematically.
Examples include:
- Inspection forms
- Questionnaires
- Interview schedules
- Observation checklists
- Data recording sheets
- Digital databases
The instrument should be designed around the research objectives rather than around the information that happens to be easiest to collect.
Effective Data Collection Instruments
A good instrument should be:
- Clear
- Relevant
- Consistent
- Easy to complete
- Structured logically
- Suitable for the selected methodology
- Capable of producing analysable information
Collecting Data from Complex Electrical Environments
Electrical engineering environments can involve multiple systems and stakeholders operating simultaneously. Research procedures therefore need to account for environmental and operational complexity.
Complex environments may include:
- Construction sites
- Manufacturing facilities
- Testing laboratories
- Power infrastructure
- Renewable energy installations
- Industrial electrical systems
- Commissioning environments
- Maintenance operations
Each environment may produce different types of data and introduce different collection challenges.
Managing Multiple Data Sources
When several data sources are used, researchers should maintain a clear data structure.
For example:
Inspection Records
→ Identify defects
Testing Records
→ Confirm technical performance
Interviews
→ Explain operational causes
Observations
→ Confirm actual practices
Quality Reports
→ Identify recurring trends
Combining these sources can provide a more complete understanding of the research problem.
Ensuring Measurement Accuracy
Where numerical electrical measurements are collected, researchers must consider the accuracy and consistency of the measurement process.
Relevant considerations include:
- Measurement procedure
- Instrument suitability
- Recording method
- Measurement conditions
- Timing
- Data transcription
Researchers should document sufficient contextual information to allow measurements to be interpreted appropriately.
Recording Contextual Information
A numerical result without context may have limited research value.
For example, a measurement record may need to identify:
- Measurement date
- Equipment or system tested
- Relevant operating condition
- Test location
- Measurement method
- Recorded result
This improves traceability and supports later verification.
Managing Data Consistency
Consistency is essential when comparing electrical engineering data.
For example, if one team records a defect as “installation issue” while another records the same type of defect as “workmanship problem”, the dataset may become difficult to analyse.
Researchers should therefore establish:
- Standard terminology
- Consistent categories
- Defined measurement units
- Standard recording formats
- Consistent classification criteria
Data Verification Procedures
Data verification involves checking collected information before it is accepted as research evidence.
Verification may include:
- Reviewing incomplete records
- Comparing duplicate entries
- Checking unusual values
- Confirming source information
- Reviewing transcription accuracy
- Comparing independent records
Where discrepancies are identified, researchers should investigate the reason rather than simply selecting the preferred value.
Data Validation
Validation asks whether the collected data are suitable for representing the intended research variable.
For example, if the objective is to measure electrical defect frequency, the researcher must ensure that the selected records actually represent defects and are not simply inspection observations.
Validation can involve:
- Expert review
- Comparison with original records
- Cross-checking multiple sources
- Pilot testing
- Review of collection procedures
Sampling in Electrical Engineering Research
Large electrical engineering projects can generate enormous quantities of information. Researchers may therefore need to select a representative sample.
Sampling may be based on:
- Project phase
- Equipment category
- Defect type
- Time period
- Location
- Participant role
The sampling strategy should be clearly justified because inappropriate sampling can distort findings.
Example of Sampling
Suppose a project contains thousands of inspection records. A researcher investigating recurring installation defects may select records across:
- Early installation
- Mid-project installation
- Final inspection
This allows potential changes in defect patterns to be considered.
Managing Missing Data
Missing information is common in engineering research.
Missing data may result from:
- Incomplete records
- Lost documents
- Unrecorded measurements
- Personnel changes
- System migration
Researchers should:
- Identify missing information
- Record the extent of missing data
- Investigate possible causes
- Assess its effect on findings
- Avoid inventing missing values
Transparency is essential when missing data could influence conclusions.
Managing Unexpected Data
Complex electrical environments may produce unexpected results.
Examples include:
- Sudden performance changes
- Unusual defect patterns
- Conflicting inspection records
- Unexpected testing results
Researchers should not automatically remove unusual data simply because they do not fit the expected pattern.
Instead, researchers should:
- Verify the information
- Investigate the context
- Compare other sources
- Determine whether the finding represents a genuine condition
Unexpected data may reveal important research findings.
Ethical Considerations in Data Collection
Ethical research requires researchers to collect and manage information responsibly.
Important principles include:
- Informed consent
- Confidentiality
- Privacy
- Transparency
- Accurate reporting
- Responsible data storage
When interviews or surveys involve professionals, participants should understand the purpose of the research and how their information will be used.
Protecting Confidential Electrical Engineering Information
Engineering research may involve sensitive information such as:
- Project performance data
- Quality failures
- Company procedures
- Technical documentation
- Commercial information
Researchers should avoid unnecessary disclosure and should use appropriate anonymisation where required.
Avoiding Researcher Bias During Data Collection
Researchers may unintentionally influence data collection.
Bias can occur when researchers:
- Ask leading questions
- Select only convenient records
- Ignore contradictory information
- Interpret observations before recording them
To minimise bias:
- Use standardised procedures
- Use neutral questions
- Apply consistent selection criteria
- Record evidence before interpretation
Practical Data Collection Process
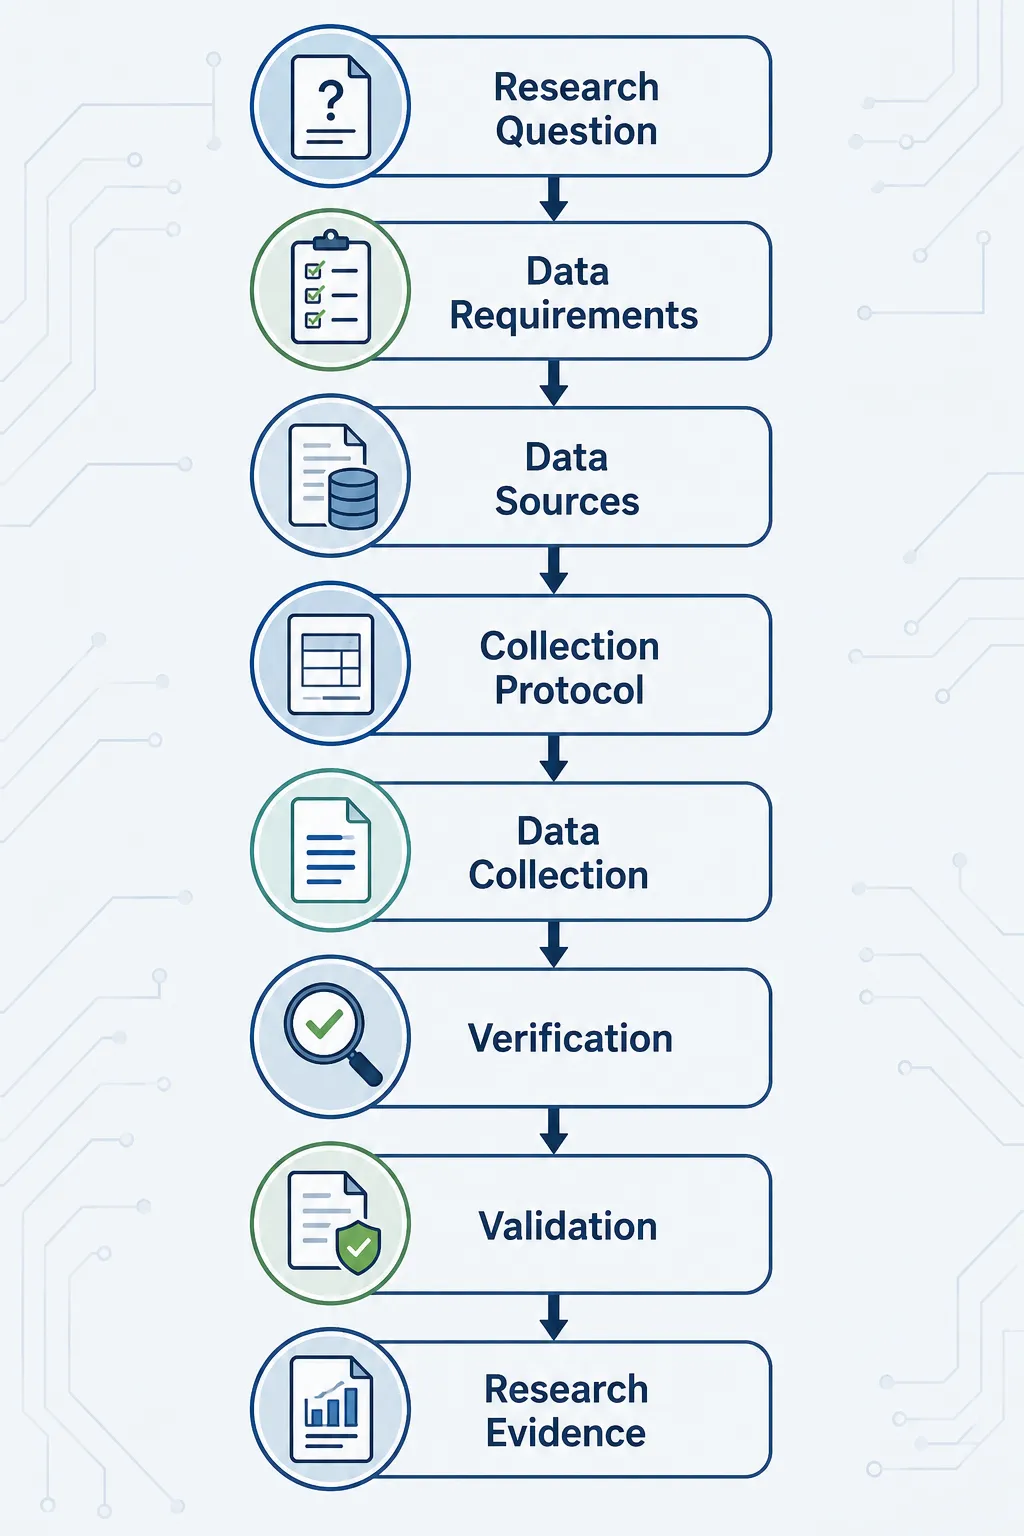
Step 1: Define the Research Question
Clearly establish what the investigation needs to answer.
Step 2: Identify Variables
Determine which technical, human, organisational, and external factors require investigation.
Step 3: Identify Data Sources
Select relevant primary and secondary sources.
Step 4: Develop the Collection Protocol
Define:
- What will be collected
- How it will be collected
- When it will be collected
- How it will be recorded
Step 5: Pilot the Procedure
Test the collection process on a small scale before full implementation.
Step 6: Collect Data
Apply the approved procedure consistently.
Step 7: Verify Data
Check completeness, accuracy, consistency, and traceability.
Step 8: Organise the Dataset
Use appropriate categories and identifiers.
Step 9: Document Limitations
Record missing information and unexpected conditions.
Step 10: Prepare for Analysis
Ensure the final dataset is suitable for the selected analytical approach.
Practical Example: Electrical Installation Defect Research
Research Problem
A construction organisation has identified recurring electrical installation defects but does not know whether the main causes are related to workmanship, inspection processes, or documentation.
Data Requirements
The researcher identifies:
- Defect records
- Inspection results
- Corrective actions
- Installation observations
- Professional interviews
Collection Procedure
The researcher develops a standardised data collection form containing:
- Defect category
- Location
- Date
- Detection stage
- Potential cause
- Corrective action
- Closure status
Verification
Records are compared against original inspection documentation.
Outcome
The structured dataset allows the researcher to identify recurring patterns and compare technical evidence with professional explanations.
Case Study: Data Collection for Digital QA/QC Research
Background
An electrical engineering organisation introduces a digital quality management platform. Management wants to understand whether the system improves inspection efficiency and documentation accuracy.
Research Data
The researcher collects:
Quantitative data:
- Inspection completion times
- Documentation errors
- Defect reporting frequency
Qualitative data:
- User interviews
- Workplace observations
- Professional feedback
Systematic Procedure
The researcher:
- Defines measurement criteria
- Establishes data categories
- Uses standardised collection forms
- Maintains participant confidentiality
- Verifies digital records
- Compares data across defined periods
Research Value
The systematic approach enables the researcher to evaluate both measurable performance and user experience, providing stronger evidence for conclusions about digital QA/QC effectiveness.
Key Benefits of Systematic Data Collection
Improved Accuracy
Standardised procedures reduce recording errors and inconsistencies.
Greater Reliability
Consistent collection methods make results more dependable.
Stronger Validity
Relevant and accurately collected evidence better represents the research problem.
Improved Traceability
Researchers can identify where information originated and how it was processed.
Better Comparability
Standardised data enable comparison between:
- Projects
- Time periods
- Equipment categories
- Inspection stages
Stronger Decision-Making
Reliable evidence supports more defensible QA/QC recommendations.
Improved Research Credibility
Transparent data collection procedures demonstrate methodological rigour.
Common Data Collection Problems and Their Control Measures
Researchers should anticipate potential problems rather than waiting for them to occur.
Common problems include:
- Incomplete records
- Inconsistent terminology
- Missing measurements
- Duplicate entries
- Unverified information
- Participant bias
- Changing project conditions
Control measures include:
- Standardised forms
- Clear definitions
- Data verification
- Source comparison
- Regular quality checks
- Researcher training
Applying Data Quality Controls
Data quality should be monitored throughout the investigation rather than only at the end.
Researchers should periodically check:
- Completeness
- Accuracy
- Consistency
- Relevance
- Traceability
Early identification of data problems prevents major difficulties during analysis.
Linking Data Collection to QA/QC Improvement
Systematic data collection should ultimately contribute to understanding and improving electrical quality performance.
Collected information can help identify:
- Recurring defects
- Process weaknesses
- Training needs
- Inspection inefficiencies
- Documentation problems
- Quality improvement opportunities
The value of data collection therefore depends not simply on the quantity of information collected but on whether the information provides meaningful evidence for the research question.
Conclusion
Implementing systematic procedures to collect accurate data from complex electrical engineering environments is essential for producing reliable and credible QA/QC research. Effective data collection requires clearly defined research requirements, appropriate data sources, standardised collection protocols, accurate recording procedures, verification processes, and careful management of ethical and confidentiality considerations. By controlling data quality throughout the investigation, researchers can reduce errors, improve traceability, and ensure that collected evidence genuinely represents the electrical engineering problem under investigation.
A robust data collection process provides the foundation for meaningful analysis and evidence-based conclusions. When researchers systematically combine inspection records, testing information, quality documentation, observations, and professional evidence, they can develop a comprehensive understanding of complex electrical QA/QC issues. This supports stronger research validity, more reliable professional decisions, and practical recommendations for improving electrical quality, performance, reliability, and continuous improvement across engineering environments.
2. Apply Advanced Analytical Techniques to Process and Organise Raw Data Gathered During QA/QC Research
Processing and organising raw data is a critical stage in electrical Quality Assurance and Quality Control (QA/QC) research because raw engineering information is rarely ready for direct interpretation. Inspection records, testing results, non-conformance reports, commissioning information, survey responses, interview transcripts, observations, and quality performance records may contain different formats, units, terminology, levels of completeness, and degrees of reliability. Advanced analytical techniques provide a structured means of transforming this raw information into organised, meaningful, and research-ready evidence.
In electrical engineering research, effective data processing is particularly important because QA/QC investigations frequently involve large and complex datasets. A single project may generate thousands of inspection records, test results, defect reports, corrective action records, and quality observations. Simply collecting this information does not demonstrate effective research practice. Researchers must clean, classify, code, organise, analyse, and validate the information before meaningful conclusions can be developed. The quality of these processes directly influences the reliability and validity of the final research findings.
Advanced data analysis also enables researchers to identify patterns that may not be immediately visible within individual records. For example, a researcher investigating recurring electrical installation defects may discover that particular defect categories are concentrated within specific project stages, locations, teams, or inspection periods. Similarly, analysis of testing data may reveal performance trends, unusual variations, recurring failures, or relationships between different variables. These insights can provide valuable evidence for improving electrical QA/QC processes and addressing underlying quality problems.
The purpose of advanced analytical techniques is therefore not simply to produce graphs or statistical outputs. The objective is to transform raw information into structured evidence that directly supports the research question. Appropriate analytical techniques should be selected according to the research methodology, nature of the data, research objectives, and complexity of the QA/QC problem. When applied systematically, data processing and analysis strengthen research credibility and support evidence-based decision-making in electrical engineering.
Understanding Raw Data in Electrical QA/QC Research
Raw data refers to information collected during an investigation before it has been systematically processed, organised, coded, analysed, or interpreted. It may exist in numerical, textual, categorical, visual, or documentary formats.
Examples of raw electrical QA/QC data include:
- Electrical testing measurements
- Inspection observations
- Defect records
- Non-conformance reports
- Corrective action records
- Audit findings
- Survey responses
- Interview transcripts
- Equipment performance information
- Commissioning records
- Quality documentation
Raw data can contain valuable evidence, but it may also contain:
- Missing values
- Duplicate records
- Inconsistent terminology
- Measurement errors
- Different units
- Formatting variations
- Unverified information
- Outliers
- Contradictory entries
Before analysis begins, researchers must therefore establish a systematic data-processing procedure.
Key Concepts in Advanced QA/QC Data Analysis
| Key Concept | Definition | Electrical QA/QC Application |
|---|---|---|
| Raw Data | Original information collected before processing | Inspection records, testing results, interviews |
| Data Cleaning | Identifying and correcting errors or inconsistencies | Removing duplicate defect records |
| Data Coding | Assigning categories or labels to information | Classifying defects by type |
| Data Classification | Grouping information according to defined characteristics | Grouping defects by installation stage |
| Data Transformation | Converting data into a suitable analytical format | Converting measurements into standard units |
| Descriptive Analysis | Summarising characteristics of collected data | Calculating defect frequencies |
| Trend Analysis | Examining changes over time | Identifying increasing or decreasing defect patterns |
| Comparative Analysis | Comparing datasets or groups | Comparing quality performance between projects |
| Correlation Analysis | Examining relationships between variables | Exploring relationships between training and defects |
| Thematic Analysis | Identifying themes within qualitative information | Analysing interview responses about quality barriers |
| Outlier | An observation substantially different from other data | Unusual testing result requiring verification |
| Data Validation | Checking whether processed information accurately represents the research variable | Confirming defect classifications |
| Data Visualisation | Presenting data graphically for easier interpretation | Charts showing defect trends |
| Data Integrity | Maintaining accuracy and consistency throughout processing | Preserving original quality records |
Importance of Data Processing in Electrical QA/QC Research
Raw data cannot always provide meaningful evidence without systematic processing. Data processing converts fragmented information into an organised structure that researchers can evaluate objectively.
Effective processing helps researchers:
- Identify important patterns
- Detect inconsistencies
- Compare performance
- Categorise quality problems
- Establish relationships
- Identify trends
- Support research conclusions
For example, 2,000 individual inspection records may initially appear difficult to interpret. Once the records are classified according to defect type, location, project phase, and detection stage, meaningful patterns may become visible.
Establishing a Data Processing Framework
Before applying analytical techniques, researchers should develop a clear data-processing framework.
The framework should identify:
- Data categories
- Variables
- Coding rules
- Quality checks
- Analytical methods
- Storage arrangements
- Validation procedures
A typical processing sequence may be:
Raw Data
↓
Data Cleaning
↓
Data Coding
↓
Data Classification
↓
Data Organisation
↓
Data Analysis
↓
Validation
↓
Research Evidence
This structured sequence helps prevent premature interpretation.
Step 1: Review the Raw Dataset
The first stage is to understand what information has been collected.
Researchers should determine:
- Number of records
- Data types
- Variable categories
- Source of information
- Missing information
- Potential inconsistencies
The initial review should not attempt to establish final conclusions. Its purpose is to understand the structure and quality of the dataset.
Step 2: Data Cleaning
Data cleaning involves identifying and addressing errors or inconsistencies.
Common problems include:
- Duplicate records
- Incorrect entries
- Missing information
- Inconsistent terminology
- Incorrect units
- Formatting problems
For example, an electrical defect might be recorded as:
- “Cable issue”
- “Cable defect”
- “Cable fault”
If these descriptions represent the same category, researchers may need to establish a standard classification.
Step 3: Managing Missing Data
Missing information should be identified systematically.
Researchers should determine:
- Which fields are incomplete
- How frequently information is missing
- Whether missingness is concentrated in certain groups
- Whether missing information affects the analysis
Researchers should not simply assume that missing data have no importance.
Step 4: Removing Duplicate Records
Duplicate records can distort research findings.
For example, if one defect is accidentally entered three times, the calculated defect frequency may be artificially increased.
Researchers should establish rules for identifying duplicates using:
- Record identifiers
- Dates
- Locations
- Defect descriptions
- Reference numbers
Step 5: Standardising Data
Standardisation improves comparability.
Researchers may need to standardise:
- Terminology
- Units
- Date formats
- Classification categories
- Coding structures
This is particularly important when information originates from multiple project teams or systems.
Data Coding for Electrical QA/QC Research
Coding converts raw information into defined categories that can be systematically analysed.
For example:
Raw Observation
“Cable termination incorrectly completed.”
Possible code:
CT-01
Category:
Termination Defect
Similarly:
- Inspection failure → IF
- Documentation error → DE
- Testing issue → TI
- Installation defect → ID
The coding system should be clearly documented so that the researcher can explain how classifications were created.
Qualitative Data Coding
Interview and observation data may require qualitative coding.
A researcher investigating quality management barriers might identify themes such as:
- Training
- Communication
- Supervision
- Resources
- Procedures
- Technology
Repeated references to these themes can then be examined to identify common patterns.
Quantitative Data Organisation
Numerical information should be organised into structured datasets.
Possible variables include:
- Project phase
- Inspection date
- Defect category
- Defect frequency
- Inspection outcome
- Corrective action status
Organised data allows researchers to perform appropriate statistical and comparative analysis.
Descriptive Analysis
Descriptive analysis summarises the main characteristics of a dataset.
It may include:
- Frequencies
- Percentages
- Averages
- Minimum values
- Maximum values
- Distribution patterns
For example, a researcher may determine that one category accounts for a substantial proportion of recorded electrical defects.
Descriptive analysis does not necessarily explain why the pattern exists, but it establishes what the dataset shows.
Frequency Analysis
Frequency analysis identifies how often a particular event occurs.
For example:
- Installation defects
- Testing failures
- Documentation errors
- Inspection non-conformities
This can help researchers identify the most common QA/QC problems.
Trend Analysis
Trend analysis examines changes over time.
A researcher may analyse monthly defect records to determine whether:
- Defects are increasing
- Defects are decreasing
- Performance is stable
- Specific defect categories fluctuate
Trend analysis can reveal whether a quality intervention appears to be associated with changing performance.
Comparative Analysis
Comparative analysis examines differences between datasets.
Researchers may compare:
- Project A and Project B
- Before and after an intervention
- Different installation teams
- Different project phases
- Different defect categories
The comparison must use appropriate and clearly defined criteria.
Relationship Analysis
Where appropriate, researchers may investigate relationships between variables.
For example:
Training Level
↓
Installation Performance
The researcher may examine whether differences in training are associated with differences in defect frequency.
A relationship should not automatically be interpreted as proof of causation. Other factors may influence the observed outcome.
Outlier Analysis
An outlier is a data point that differs substantially from the general pattern.
For example, if most inspection periods record a similar number of defects but one period records an unusually high number, researchers should investigate the reason.
Possible explanations could include:
- Different project conditions
- Changes in inspection scope
- Data recording differences
- Genuine quality deterioration
Outliers should be investigated rather than automatically deleted.
Thematic Analysis for QA/QC Research
Thematic analysis is particularly useful when processing:
- Interviews
- Open-ended survey responses
- Observation notes
- Professional discussions
The process may include:
Familiarisation
Read the collected material carefully.
Initial Coding
Identify important statements and concepts.
Theme Development
Group related codes into broader themes.
Theme Review
Check whether themes accurately represent the evidence.
Theme Interpretation
Determine how themes relate to the research question.
For example, repeated interview references to “insufficient training”, “unclear procedures”, and “limited supervision” may contribute to a broader theme of quality implementation barriers.
Data Visualisation
Visualisation can make complex electrical QA/QC datasets easier to understand.
Suitable formats may include:
- Bar charts
- Line charts
- Tables
- Frequency diagrams
- Process maps
For example, a line chart can show changes in defect frequency over time, while a bar chart can compare defect categories.
Visualisation should support analysis rather than replace it.
Advanced Data Processing for Multiple Data Sources
Complex QA/QC research may involve multiple datasets.
For example:
Inspection Data
→ Defect frequency
Testing Data
→ Technical performance
Interview Data
→ Professional explanations
Quality Reports
→ Corrective actions
These sources can be analysed separately and then compared to identify areas of agreement or disagreement.
Data Triangulation
Triangulation involves examining information from multiple sources or methods to strengthen research conclusions.
For example, a researcher identifies repeated testing failures from quantitative records.
Interviews indicate:
- Training difficulties
Observations identify:
- Inconsistent testing practices
When these findings support each other, confidence in the interpretation can increase.
Handling Conflicting Data
Researchers may encounter contradictory information.
For example:
- Inspection records show compliance
- Interviews indicate procedural difficulties
- Observations show inconsistent implementation
Instead of selecting the preferred evidence, researchers should investigate the reason for the discrepancy.
Possible explanations include:
- Different collection periods
- Different interpretations
- Inconsistent procedures
- Data recording errors
Data Quality Assurance During Analysis
Researchers should continue checking data quality during analysis.
Important checks include:
- Logical consistency
- Completeness
- Correct classification
- Accurate calculations
- Source traceability
Every major analytical conclusion should be traceable back to the underlying evidence.
Practical Procedure for Processing Raw QA/QC Data
Step 1: Define Analytical Objectives
Establish what the analysis needs to determine.
Step 2: Import and Organise Data
Bring information into a structured format.
Step 3: Clean the Dataset
Identify errors, duplicates, and missing values.
Step 4: Standardise Information
Apply consistent units, terminology, and categories.
Step 5: Code Data
Assign meaningful categories and labels.
Step 6: Classify Variables
Separate technical, human, organisational, and performance variables.
Step 7: Conduct Descriptive Analysis
Identify frequencies, distributions, and summary patterns.
Step 8: Apply Advanced Analysis
Where appropriate, conduct:
- Trend analysis
- Comparative analysis
- Relationship analysis
- Thematic analysis
Step 9: Validate Findings
Compare analytical results with original evidence and other sources.
Step 10: Prepare Interpretation
Relate findings directly to the research question and objectives.
Practical Example: Analysing Electrical Defect Data
Research Problem
A project experiences repeated electrical installation defects during inspection.
Raw Dataset
The researcher receives:
- 1,500 inspection records
- 300 defect reports
- Corrective action records
- Professional interview transcripts
Processing
The researcher:
- Removes duplicate records
- Standardises defect terminology
- Codes defect categories
- Classifies records by project phase
Analysis
The researcher identifies:
- Most frequent defect categories
- Defect trends over time
- Differences between project phases
- Common themes from professional interviews
Interpretation
The analysis suggests that recurring defects are concentrated in specific installation stages and are associated with procedural and training issues.
The findings can then support targeted quality improvement recommendations.
Case Study: Advanced Analysis of Digital QA/QC Data
Background
An electrical engineering organisation introduces a digital inspection platform and wants to determine whether the system improves quality performance.
Raw Data
The research dataset includes:
- Inspection completion records
- Defect reports
- Corrective action times
- User survey responses
- Interview transcripts
Processing
The researcher:
- Removes duplicate entries
- Standardises dates
- Codes defect categories
- Classifies user responses
- Checks missing information
Analysis
Quantitative analysis examines:
- Defect frequency
- Inspection completion time
- Corrective action duration
Qualitative analysis examines:
- User experience
- Training challenges
- Technology barriers
Interpretation
The combined analysis may show measurable improvements alongside persistent implementation challenges.
This provides a more balanced understanding than relying on performance data alone.
Key Benefits of Advanced Data Analysis
Improved Research Accuracy
Structured analysis reduces errors and improves the quality of evidence.
Better Pattern Recognition
Advanced techniques reveal trends and relationships that may not be obvious in raw records.
Stronger Decision-Making
Analysed evidence provides a sound basis for QA/QC recommendations.
Improved Quality Management
Findings can identify weaknesses in inspection, testing, documentation, and corrective action processes.
Greater Research Credibility
Transparent analytical procedures strengthen confidence in conclusions.
Better Use of Complex Datasets
Large volumes of engineering information become manageable and meaningful.
Common Analytical Mistakes to Avoid
Researchers should avoid:
- Analysing uncleaned data
- Removing outliers without investigation
- Treating correlation as causation
- Ignoring conflicting evidence
- Using inappropriate analytical techniques
- Changing categories during analysis without documentation
- Drawing conclusions unsupported by evidence
Ensuring Analytical Validity
Researchers should ensure that analytical techniques are appropriate for the data and research objectives.
Consider:
- Data type
- Sample size
- Variable characteristics
- Research question
- Methodology
- Analytical assumptions
A technically sophisticated analytical technique is not necessarily appropriate if the underlying data are unsuitable.
Maintaining Data Traceability
Every analytical finding should be traceable to its original evidence.
A strong traceability process allows researchers to identify:
- Original data source
- Processing step
- Coding decision
- Analytical technique
- Result
- Interpretation
This is particularly important for professional QA/QC research where findings may influence quality improvement decisions.
Linking Data Analysis to Research Objectives
Analysis should always remain connected to the research question.
For example:
Research Objective: Identify major causes of recurring electrical defects.
Relevant analysis:
- Defect frequency
- Defect categories
- Project-stage comparison
- Interview themes
Less relevant analysis should not dominate the investigation simply because the data are available.
Ethical Considerations During Data Processing
Ethical responsibilities continue after data collection.
Researchers should:
- Protect confidential information
- Avoid manipulating results
- Report findings honestly
- Preserve original data
- Document analytical decisions
- Avoid selective reporting
If analysis produces unexpected findings, researchers should investigate and report them appropriately rather than altering the dataset to support an expected conclusion.
Conclusion
Applying advanced analytical techniques to process and organise raw data is essential for transforming complex electrical engineering information into reliable research evidence. Raw inspection records, testing results, quality reports, interviews, observations, and performance measurements require systematic cleaning, coding, classification, validation, and analysis before meaningful interpretation can occur. Techniques such as descriptive analysis, trend analysis, comparative analysis, relationship analysis, thematic analysis, outlier investigation, and data triangulation enable researchers to identify important patterns and relationships within electrical QA/QC datasets.
Effective data processing strengthens the validity, reliability, and practical value of electrical engineering research. When analytical procedures are clearly defined and findings remain traceable to original evidence, researchers can produce defensible conclusions that support quality improvement and informed professional decision-making. By applying advanced analytical techniques appropriately, electrical QA/QC researchers can convert complex raw information into actionable knowledge that contributes to improved inspection, testing, documentation, reliability, performance, and continuous quality improvement.
3. Critically Interpret Complex Datasets to Identify Significant Patterns, Correlations, or Anomalies in Electrical Quality
Critical interpretation of complex datasets is an advanced research skill required to transform electrical engineering data into meaningful evidence for Quality Assurance and Quality Control (QA/QC) decision-making. Electrical projects generate large quantities of information through inspection records, testing results, non-conformance reports, commissioning data, maintenance records, quality audits, corrective action reports, surveys, observations, and performance measurements. Individually, these records may provide limited insight; however, when systematically analysed and interpreted, they can reveal recurring quality problems, relationships between variables, unexpected performance changes, and potential weaknesses within electrical quality management processes.
The purpose of critical data interpretation is not simply to identify numerical differences or produce charts. Researchers must determine what the observed patterns actually mean within the engineering context. A reduction in reported defects, for example, may indicate improved installation quality, but it could alternatively reflect reduced inspection activity or incomplete reporting. Similarly, a statistical relationship between workforce experience and defect frequency does not automatically demonstrate that experience caused the observed difference. Critical interpretation therefore requires researchers to consider data quality, context, methodology, alternative explanations, limitations, and relationships between technical and organisational variables.
In electrical QA/QC research, patterns, correlations, and anomalies can provide important evidence for continuous improvement. Recurring defects may identify weaknesses in installation procedures; correlations may reveal relationships between inspection frequency and quality performance; and anomalies may highlight unusual equipment behaviour, measurement errors, environmental influences, or previously unrecognised quality risks. Effective interpretation allows researchers to distinguish meaningful findings from random variation and develop conclusions that are supported by evidence rather than assumption.
A robust interpretation process should connect the dataset directly to the research question, objectives, and identified QA/QC problem. Researchers must understand the characteristics of the dataset before drawing conclusions and should use appropriate analytical techniques to investigate significant relationships. Findings should then be validated through additional evidence where possible, including technical documentation, professional observations, interviews, or other relevant datasets. This approach strengthens the credibility of research and supports evidence-based recommendations for improving electrical quality, reliability, performance, and management systems.
Understanding Complex Datasets in Electrical QA/QC Research
A complex dataset contains multiple variables, records, categories, or information sources that interact in ways that may not be immediately apparent. In electrical engineering research, complexity may arise because quality performance is influenced by several factors simultaneously.
A dataset may contain:
- Inspection results
- Testing measurements
- Defect categories
- Project phases
- Equipment types
- Installation locations
- Workforce information
- Corrective action records
- Environmental conditions
- Time-based performance data
The researcher must understand how these variables are structured before attempting interpretation.
For example, an investigation into electrical installation defects may examine the relationship between:
- Inspection frequency
- Workforce experience
- Project phase
- Installation complexity
- Defect frequency
- Corrective action duration
Analysing these variables individually may provide useful information, but critical interpretation requires consideration of how they interact.
Key Concepts in Critical Dataset Interpretation
| Concept | Definition | Electrical QA/QC Application |
|---|---|---|
| Pattern | A recurring or identifiable trend within data | Repeated defects during a particular project phase |
| Correlation | A statistical or observable relationship between variables | Relationship between inspection frequency and defect occurrence |
| Anomaly | An observation that differs substantially from an expected pattern | Unusually high testing failures in one period |
| Trend | A general direction of change over time | Gradual reduction in non-conformities |
| Variable | A measurable or observable characteristic | Defect rate, inspection frequency, testing result |
| Outlier | A data point substantially different from other observations | An unusually high or low measurement |
| Causation | A relationship where one factor contributes to producing another | A verified process change causing quality improvement |
| Significance | Importance of a finding in relation to the research question | A recurring defect pattern relevant to the investigation |
| Context | Conditions surrounding the collected data | Project stage, environment, workload, or system configuration |
| Triangulation | Comparison of evidence from multiple sources | Comparing inspection records with interviews and observations |
| Interpretation | Assigning evidence-based meaning to analysed information | Explaining why a defect pattern may have developed |
| Validation | Checking whether an interpretation is supported by reliable evidence | Confirming an anomaly through original testing records |
Why Critical Interpretation Matters in Electrical QA/QC
Electrical quality data can easily be misinterpreted if researchers focus only on numerical results. A dataset may show that defects increased during a particular month, but the reason may not be immediately clear.
Possible explanations could include:
- Increased installation activity
- More intensive inspections
- Introduction of new equipment
- Workforce changes
- Changes in project conditions
- Improved defect reporting
- Genuine deterioration in quality
Critical interpretation requires these alternative explanations to be considered.
Researchers should therefore ask:
- What does the pattern show?
- Why might the pattern exist?
- Is the pattern consistent across other datasets?
- Could another variable explain the finding?
- Is the observed relationship meaningful?
- Does the finding directly address the research question?
Identifying Significant Patterns
A pattern is a recurring feature within a dataset. Patterns may appear across time, location, equipment category, project phase, or quality process.
Examples include:
- Repeated installation defects
- Increasing testing failures
- Concentration of non-conformities in one project stage
- Repeated documentation errors
- Reduction in defects after a quality intervention
Time-Based Patterns
Researchers can compare data across:
- Days
- Weeks
- Months
- Project phases
- Before and after interventions
For example, if electrical defects gradually decline following implementation of an improved inspection process, this may indicate a potential quality improvement relationship.
However, researchers should examine whether other factors changed during the same period.
Location-Based Patterns
Defects may be concentrated in:
- Specific buildings
- Particular plant areas
- Certain installation zones
- Specific electrical systems
Location patterns may indicate differences in:
- Installation complexity
- Environmental conditions
- Workforce allocation
- Supervision
- Material availability
Process-Based Patterns
Researchers can examine where defects occur within the QA/QC process.
For example:
Installation
→ Inspection
→ Testing
→ Commissioning
If defects are repeatedly discovered during commissioning, researchers should investigate whether earlier inspection or testing stages are effectively identifying them.
Identifying Correlations in Electrical QA/QC Data
Correlation describes a relationship between variables where changes in one variable are associated with changes in another.
Potential relationships may include:
- Inspection frequency and defect detection
- Training levels and installation quality
- Workload and documentation errors
- Corrective action speed and repeated defects
Correlation can help researchers identify areas requiring further investigation.
Correlation Does Not Automatically Mean Causation
This distinction is essential for Level 6 research.
Suppose a dataset shows:
Higher inspection frequency → Higher defect detection
This does not necessarily mean that inspections caused more defects.
A more reasonable interpretation may be that increased inspection activity allowed more existing defects to be identified.
Researchers must therefore distinguish between:
- Observed relationship
- Possible explanation
- Verified cause
This prevents overstatement of research findings.
Analysing Positive and Negative Relationships
A positive relationship occurs when two variables tend to increase together.
A negative relationship occurs when one variable increases while another tends to decrease.
For example:
Inspection effectiveness ↑
Defect recurrence ↓
This may indicate an association worth investigating.
However, researchers should consider other influencing variables before developing a causal conclusion.
Identifying Anomalies in Electrical Quality Data
An anomaly is an observation that differs substantially from an expected pattern.
Examples include:
- Unexpectedly high defect frequency
- Unusually low testing values
- Sudden performance changes
- Abnormal inspection results
- Unexpected corrective action delays
An anomaly may represent:
- A genuine quality problem
- A measurement error
- Data entry error
- Unusual operating conditions
- Environmental influence
- Change in process
Investigating Anomalies Systematically
When an anomaly is identified, researchers should:
- Verify the original record
- Check measurement conditions
- Compare related records
- Review project circumstances
- Examine possible external influences
- Determine whether the anomaly is genuine
Researchers should not automatically remove an unusual value.
Anomalies can sometimes provide the most valuable evidence in an investigation because they may reveal previously unidentified problems.
Distinguishing Significant Findings from Random Variation
Not every change within a dataset represents a meaningful quality issue.
Researchers should consider:
- Frequency of occurrence
- Size of the change
- Consistency across datasets
- Relevance to research objectives
- Context surrounding the observation
For example, one isolated defect may not indicate a systemic quality problem. However, the same defect appearing repeatedly across several project phases may justify further investigation.
Applying Descriptive Analysis Before Critical Interpretation
Researchers should first establish what the dataset contains.
Useful descriptive measures may include:
- Frequencies
- Percentages
- Averages
- Minimum values
- Maximum values
- Distribution patterns
This provides a foundation for more advanced interpretation.
For example, if 40% of recorded defects belong to one category, the researcher can investigate why that category occurs so frequently.
Comparative Analysis
Comparative analysis can reveal differences between groups.
Researchers may compare:
- Different projects
- Different contractors
- Different project phases
- Different inspection methods
- Before and after interventions
The comparison must be meaningful and based on comparable data.
For example, comparing defect counts alone between a small and large project could be misleading. Researchers may need to consider defect rates relative to relevant activity levels.
Trend Analysis
Trend analysis examines how variables change over time.
A researcher may plot:
- Monthly defect frequency
- Testing failure rates
- Corrective action duration
- Inspection completion rates
Trend interpretation should consider whether external conditions changed during the same period.
Cross-Tabulation and Classification
Cross-tabulation allows researchers to examine relationships between categories.
For example:
| Project Phase | Installation Defects | Testing Defects | Documentation Errors |
|---|---|---|---|
| Installation | High | Low | Medium |
| Inspection | Medium | Medium | High |
| Testing | Low | High | Medium |
| Commissioning | Medium | High | High |
This type of organisation can help identify where particular QA/QC problems are concentrated.
Interpreting Multiple Variables
Complex electrical datasets often require researchers to consider several variables simultaneously.
For example, defect frequency may be influenced by:
- Installation complexity
- Workforce experience
- Inspection frequency
- Project deadlines
- Material availability
A simple comparison between two variables may therefore provide an incomplete explanation.
Researchers should ask:
- What other variables may influence the relationship?
- Are the variables independently measured?
- Could one variable be affecting both observed outcomes?
- Are project conditions comparable?
Practical Interpretation of Quality Trends
Suppose a project introduces additional inspections and defect reports increase.
A superficial interpretation might conclude:
“Quality has deteriorated.”
A critical interpretation would consider:
- Did inspection activity increase?
- Were more defects previously undetected?
- Did reporting procedures change?
- Did project activity increase?
- Did the defect rate actually increase relative to the level of work?
This demonstrates why context is essential.
Qualitative Interpretation of Complex QA/QC Data
Not all complex datasets are numerical.
Interview and observation data can reveal:
- Common professional experiences
- Organisational challenges
- Quality culture issues
- Communication problems
- Training weaknesses
Researchers can identify recurring themes and compare them with quantitative findings.
For example:
Quantitative data:
High documentation error rate
Qualitative data:
Professionals report unclear documentation procedures
The two findings may support a broader interpretation.
Data Triangulation for Critical Interpretation
Triangulation improves confidence in findings by comparing different evidence sources.
For example:
Inspection Records
show recurring defects.
Interviews
identify training concerns.
Observations
confirm inconsistent installation practices.
Together, these findings provide stronger evidence than relying on one source.
Handling Conflicting Evidence
Conflicting evidence should be investigated rather than ignored.
For example:
- Testing records indicate compliance
- Inspection reports indicate non-conformity
- Interviews report process weaknesses
Possible explanations include:
- Different testing stages
- Different measurement conditions
- Documentation errors
- Changes in project conditions
The researcher should determine why the evidence differs before drawing conclusions.
Process for Critical Dataset Interpretation
Step 1: Understand the Dataset
Identify:
- Data sources
- Variables
- Sample characteristics
- Time period
- Measurement conditions
Step 2: Verify Data Quality
Check:
- Completeness
- Accuracy
- Consistency
- Missing information
Step 3: Identify Initial Patterns
Examine:
- Frequencies
- Trends
- Categories
- Repeated events
Step 4: Examine Relationships
Assess possible relationships between variables.
Step 5: Investigate Anomalies
Identify unusual observations and determine their causes.
Step 6: Consider Context
Evaluate:
- Project conditions
- Operational factors
- Environmental influences
- Organisational changes
Step 7: Compare Evidence Sources
Use triangulation where appropriate.
Step 8: Develop Interpretations
Explain what the findings mean in relation to the research question.
Step 9: Evaluate Alternative Explanations
Consider whether other factors could explain the findings.
Step 10: Establish Evidence-Based Conclusions
Only make conclusions supported by the available evidence.
Practical Example: Identifying Electrical Defect Patterns
Research Problem
A researcher investigates recurring electrical installation defects within a construction project.
Dataset
The dataset contains:
- 2,000 inspection records
- 400 defect records
- 150 corrective action records
- Interview information from QA/QC personnel
Initial Analysis
The researcher identifies:
- Several recurring defect categories
- Higher defect frequency during a particular project stage
- Increased reporting during one period
Critical Interpretation
Instead of immediately concluding that quality deteriorated, the researcher examines inspection activity.
The analysis shows that inspection frequency also increased during the same period.
Therefore, the increase in reported defects may partly reflect improved detection rather than actual deterioration.
This demonstrates the importance of interpreting data within context.
Case Study: Investigating Testing Anomalies
Background
An electrical engineering project records unusually high testing failures during commissioning.
Initial Finding
Testing failure rates are significantly higher than earlier project stages.
Investigation
The researcher examines:
- Testing procedures
- Equipment configuration
- Measurement records
- Environmental conditions
- Personnel involved
Additional Evidence
Interviews reveal that testing personnel changed during the commissioning stage.
Observation identifies differences in testing procedures.
Interpretation
The anomaly cannot be attributed solely to equipment performance. The evidence indicates that changes in testing practice may have contributed to the observed variation.
The researcher therefore recommends further investigation rather than claiming a single definitive cause without sufficient evidence.
Case Study: Correlation Between Training and Quality Performance
Background
An organisation wants to determine whether workforce training is associated with electrical installation quality.
Variables
Independent variable:
- Training level
Dependent variable:
- Installation defect frequency
Analysis
The researcher identifies that teams with more extensive training generally record fewer defects.
Critical Evaluation
However, the researcher also examines:
- Supervision levels
- Installation complexity
- Workforce experience
- Project workload
This prevents the researcher from assuming that training alone explains the difference.
Key Benefits of Critical Data Interpretation
Improved Quality Problem Identification
Researchers can distinguish recurring systemic problems from isolated incidents.
Better Root-Cause Investigation
Patterns and relationships provide evidence for investigating potential underlying causes.
Stronger Evidence-Based Decisions
Interpretation supports recommendations based on actual research evidence.
Improved QA/QC Performance
Findings can identify opportunities to improve:
- Inspection
- Testing
- Documentation
- Training
- Corrective action
Early Detection of Quality Risks
Anomaly analysis can identify unusual conditions before they develop into broader quality problems.
Better Research Credibility
Critical interpretation demonstrates that conclusions have been developed through systematic reasoning rather than assumption.
Common Interpretation Errors
Researchers should avoid:
- Treating correlation as causation
- Ignoring contextual factors
- Removing anomalies without investigation
- Overinterpreting isolated results
- Ignoring contradictory evidence
- Assuming trends prove improvement
- Drawing conclusions beyond the dataset
- Confusing increased reporting with increased failure
Strategies for Improving Interpretation Quality
Researchers should:
- Maintain clear links to research objectives
- Verify unusual findings
- Compare multiple evidence sources
- Consider alternative explanations
- Document analytical decisions
- Distinguish evidence from assumptions
- Identify limitations
- Use appropriate analytical techniques
Linking Interpretation to Electrical QA/QC Improvement
The ultimate value of data interpretation is its contribution to quality improvement.
Research findings may identify:
- Recurring installation weaknesses
- Testing process limitations
- Documentation problems
- Training requirements
- Inspection inefficiencies
- Technology implementation barriers
These findings can then support evidence-based recommendations.
For example:
Recurring Defect
↓
Pattern Identification
↓
Possible Influencing Factors
↓
Evidence Validation
↓
Root-Cause Investigation
↓
QA/QC Improvement
This demonstrates how data interpretation can contribute directly to continuous improvement.
Ethical Considerations in Data Interpretation
Researchers must interpret data honestly and objectively.
Ethical interpretation requires:
- Accurate reporting
- Transparent analytical procedures
- No deliberate manipulation
- Appropriate treatment of contradictory findings
- Protection of confidential information
- Clear acknowledgement of limitations
Researchers should not alter interpretation simply to support an expected conclusion.
Conclusion
Critically interpreting complex datasets is essential for identifying significant patterns, correlations, and anomalies in electrical quality research. Effective interpretation requires more than calculating numerical results; it requires researchers to understand the context of the data, evaluate relationships between variables, investigate unusual observations, compare multiple evidence sources, and distinguish genuine quality trends from random variation or changes in reporting practices. By applying structured analytical processes, researchers can develop reliable interpretations that directly address electrical QA/QC research questions.
A rigorous approach to data interpretation strengthens evidence-based quality improvement across electrical engineering environments. When patterns, correlations, and anomalies are carefully evaluated and validated, researchers can identify potential causes of defects, recognise performance trends, detect emerging quality concerns, and develop defensible recommendations. This supports more effective QA/QC decision-making, improved reliability and performance, stronger research conclusions, and continuous improvement in electrical engineering quality management.
4. Evaluate the Reliability and Validity of the Collected Data Within the Context of the Defined Research Limitations
Evaluating the reliability and validity of collected data is a fundamental requirement for producing credible electrical engineering QA/QC research. Data may be collected accurately but still fail to provide valid evidence if it does not adequately represent the research problem. Similarly, data may appear relevant but produce inconsistent results if the collection process is unreliable. Researchers must therefore evaluate both dimensions systematically and determine whether the available evidence is sufficiently dependable to support research conclusions.
Electrical QA/QC investigations frequently use information from inspection records, testing results, non-conformance reports, commissioning documentation, quality audits, maintenance records, observations, interviews, surveys, and project databases. These sources can vary significantly in quality, completeness, consistency, and purpose. Some records may have been created for operational or contractual requirements rather than research purposes. Others may contain missing information, inconsistent classifications, measurement variations, or reporting biases. Evaluating reliability and validity allows the researcher to identify these limitations before drawing conclusions.
The evaluation must also be undertaken within the context of the defined research limitations. No research dataset is completely unrestricted. Researchers may face limitations involving sample size, access to project records, participant availability, time, measurement conditions, geographical coverage, organisational confidentiality, changing project circumstances, or the availability of historical information. These limitations do not automatically invalidate a study. Instead, the researcher must determine how they influence the strength, applicability, and interpretation of the findings.
A rigorous evaluation therefore asks three connected questions: Are the data consistent? Are the data measuring what the research intends to investigate? And what limitations affect the confidence or applicability of the findings? Addressing these questions enables researchers to distinguish strong evidence from tentative evidence and develop conclusions that are proportionate to the available data.
Understanding Reliability and Validity in Electrical QA/QC Research
Reliability refers broadly to the consistency, stability, and dependability of collected data or measurement procedures. If the same phenomenon is measured under comparable conditions using an appropriately controlled procedure, reliable methods should produce reasonably consistent results.
Validity concerns whether the collected data actually represent the concept, variable, or problem that the research intends to investigate. A dataset can be highly consistent but still lack validity if it measures the wrong factor.
For example, a researcher may use a highly consistent questionnaire to measure electrical QA/QC effectiveness. If the questionnaire measures employee satisfaction rather than actual quality performance, the results may be reliable but not sufficiently valid for the research question.
In electrical engineering research, both concepts must therefore be considered together.
Key Concepts and Definitions
| Concept | Definition | Electrical QA/QC Application |
|---|---|---|
| Reliability | The consistency and dependability of data or a measurement process | Consistent recording of inspection results |
| Validity | The extent to which data accurately represent the intended research concept | Ensuring defect records genuinely represent quality failures |
| Internal Validity | Confidence that observed findings are reasonably related to the variables investigated | Assessing whether a QA/QC intervention contributed to reduced defects |
| External Validity | Extent to which findings may be applicable beyond the study context | Considering whether findings from one project apply elsewhere |
| Measurement Accuracy | Degree to which a measurement reflects the actual value or condition | Accuracy of electrical testing information |
| Data Completeness | Extent to which required information is available | Availability of complete inspection and testing records |
| Data Consistency | Degree to which information is recorded using comparable methods | Consistent defect classifications |
| Bias | Systematic influence that can distort data or interpretation | Selective reporting of quality failures |
| Limitation | A factor restricting the scope, quality, or interpretation of research | Limited access to historical project records |
| Triangulation | Comparison of evidence from multiple sources or methods | Comparing inspection records with interviews |
| Sampling Error | Difference between a sample and the wider population it represents | Limited project sample affecting generalisation |
| Data Verification | Checking collected information against reliable sources | Comparing electronic records with original reports |
| Research Credibility | Degree of confidence that findings are supported by appropriate evidence | Confidence in conclusions about electrical quality performance |
Why Reliability and Validity Matter in Electrical QA/QC Research
Electrical QA/QC decisions can depend heavily on research evidence. If the evidence is unreliable or invalid, recommendations may address the wrong problem or produce limited improvement.
Reliable and valid data help researchers:
- Identify genuine quality problems
- Detect recurring defects
- Evaluate QA/QC interventions
- Compare quality performance
- Investigate relationships between variables
- Support evidence-based recommendations
- Reduce incorrect conclusions
For example, if defect records are inconsistently classified across project teams, a comparison of defect frequency may produce misleading results. Before using the dataset, researchers must evaluate whether the classification system was sufficiently consistent.
Evaluating Data Reliability
Reliability should be evaluated throughout the research process rather than only after data collection.
Researchers should examine:
- Consistency of data collection
- Stability of measurement procedures
- Consistency between data collectors
- Repeatability of observations
- Completeness of records
- Accuracy of data transcription
-
Consistency of terminology


Reliability of Electrical Testing Data
Where research uses electrical measurements, researchers should consider the conditions under which measurements were obtained.
Relevant factors may include:
- Measurement procedure
- Instrument suitability
- Measurement conditions
- Recording procedure
- Timing
- Testing personnel
- Equipment configuration
If different testing teams use substantially different procedures, direct comparison may be unreliable unless these differences are controlled or accounted for.
Reliability of Inspection Data
Inspection records may appear objective but can still contain variation.
Different inspectors may:
- Classify defects differently
- Apply different levels of judgement
- Record information at different levels of detail
Researchers should therefore establish whether inspection criteria were sufficiently standardised.
Inter-Rater Reliability
Where human judgement is involved, researchers should consider whether different observers or inspectors reach reasonably consistent conclusions.
For example, if two QA/QC inspectors examine the same installation and classify the same condition differently, this may indicate limitations in the classification system or its application.
Researchers can address this by:
- Using clearly defined categories
- Providing standardised guidance
- Training data collectors
- Comparing classifications
- Reviewing disagreements
Reliability of Survey Data
Survey reliability may be influenced by:
- Ambiguous questions
- Inconsistent terminology
- Participant misunderstanding
- Response patterns
- Poorly structured scales
A research questionnaire should therefore be reviewed and, where appropriate, piloted before full implementation.
Reliability of Interview Data
Interviews involve professional judgement and personal experience. Reliability can be strengthened through:
- Consistent interview questions
- Standardised interview procedures
- Accurate recording
- Transparent coding
- Consistent thematic analysis
The researcher should distinguish between participant opinion and independently verified technical evidence.
Evaluating Data Validity
Validity requires researchers to determine whether the collected information genuinely answers the research question.
The researcher should ask:
- Does the dataset measure the intended variable?
- Are the selected sources relevant?
- Does the sample represent the intended research context?
- Are the measurement methods appropriate?
- Are conclusions supported by the collected evidence?
Content Validity
Content validity concerns whether the data collection instrument adequately covers the relevant dimensions of the research topic.
For example, a questionnaire investigating QA/QC effectiveness should not focus exclusively on inspection frequency if the research question also involves:
- Testing
- Documentation
- Corrective actions
- Workforce competence
The instrument should reflect the scope of the research.
Construct Validity
Construct validity considers whether the selected measures genuinely represent the theoretical or conceptual variable being investigated.
For example, “quality management effectiveness” may involve multiple dimensions:
- Defect prevention
- Inspection effectiveness
- Corrective action
- Documentation
- Continuous improvement
A single indicator may not adequately represent the entire construct.
Internal Validity
Internal validity considers whether the research provides a credible explanation of observed relationships within the investigated context.
For example, if defect frequency decreases after a new QA/QC procedure is introduced, researchers should consider whether the improvement could instead be related to:
- Reduced project activity
- Workforce changes
- Different inspection intensity
- Improved materials
- Changes in reporting practices
This prevents unsupported causal claims.
External Validity
External validity concerns the extent to which findings may be relevant beyond the original research environment.
A study conducted on one electrical construction project may provide valuable insights, but the researcher should consider whether:
- The project was representative
- Similar procedures are used elsewhere
- The workforce characteristics are comparable
- The technical environment is similar
External validity should therefore be evaluated rather than automatically assumed.
Data Accuracy and Validity
Accurate data are important but accuracy alone does not guarantee validity.
For example, a researcher may accurately record the number of inspections completed. However, if the research question concerns the effectiveness of those inspections, inspection quantity alone may not adequately measure effectiveness.
The researcher may also need:
- Defect detection rates
- Defect recurrence
- Inspection quality
- Corrective action outcomes
Evaluating the Relevance of Data
Data should be directly connected to the research objectives.
Researchers should classify evidence as:
- Directly relevant
- Supporting evidence
- Contextual evidence
- Irrelevant information
This prevents excessive amounts of unrelated information from influencing the research.
Data Triangulation
Triangulation is one of the strongest approaches for evaluating research credibility.
A researcher may compare:
Inspection Records
with
Testing Results
and
Professional Interviews
and
Workplace Observations
If multiple independent sources identify a similar quality problem, confidence in the finding may increase.
However, triangulation does not mean that all sources must produce identical results. Differences can themselves reveal important research issues.
Evaluating Contradictory Evidence
Conflicting evidence should be investigated rather than ignored.
For example:
- Inspection records show compliance
- Interviews report recurring quality problems
- Testing records show inconsistent results
The researcher should investigate:
- Whether the records relate to different periods
- Whether different procedures were used
- Whether terminology differs
- Whether documentation is incomplete
The contradiction may reveal a weakness in the QA/QC system itself.
Understanding Research Limitations
Research limitations are conditions that restrict the scope, reliability, validity, or applicability of a study.
Common limitations in electrical QA/QC research include:
- Limited access to project information
- Small sample size
- Limited project duration
- Restricted participant availability
- Confidentiality requirements
- Incomplete historical records
- Changing project conditions
- Limited geographical coverage
Recognising limitations is not a weakness in itself. Failing to acknowledge important limitations is a greater concern.
Common Data Limitations in Electrical Engineering Research
Limited Sample Size
A small sample may reduce confidence in generalising findings.
Restricted Data Access
Commercial confidentiality may prevent researchers from accessing all relevant records.
Incomplete Records
Historical quality information may contain missing fields or undocumented events.
Measurement Variation
Different instruments, personnel, or conditions may influence measurements.
Participant Bias
Professionals may provide responses influenced by personal experience or organisational considerations.
Time Constraints
Short research periods may not capture long-term quality trends.
Changing Conditions
Electrical projects may change during the research period because of:
- Workforce changes
- Design modifications
- Equipment changes
- Process changes
- Project phase transitions
Evaluating the Effect of Limitations
Researchers should not simply list limitations. They should evaluate their actual effect on the research.
For each limitation, consider:
- What aspect of the research is affected?
- Does it affect reliability?
- Does it affect validity?
- Does it affect generalisability?
- Can its impact be reduced?
- How should it influence interpretation?
Example of Limitation Evaluation
Limitation: Only one electrical construction project was available.
Potential impact:
- Limited external validity
Mitigation:
- Use detailed contextual description
- Compare findings with available secondary evidence
- Avoid claiming universal applicability
This is more academically useful than simply stating “the study had a small sample”.
Evaluating Sampling Limitations
Sampling decisions can influence research validity.
Researchers should evaluate:
- Sample size
- Selection criteria
- Representativeness
- Inclusion and exclusion criteria
For example, selecting only high-performing project teams may produce an overly positive picture of QA/QC performance.
Evaluating Data Source Limitations
Secondary data may have been collected for purposes other than research.
Researchers should determine:
- Why the original data were collected
- Whether collection procedures were standardised
- Whether definitions changed over time
- Whether records are complete
This is particularly important when analysing historical QA/QC information.
Evaluating Measurement Limitations
Measurement data should be interpreted within the conditions under which they were collected.
Researchers should consider:
- Measurement technique
- Instrument capability
- Environmental conditions
- Testing configuration
- Operator influence
- Recording procedures
Where these factors are uncertain, conclusions should be appropriately qualified.
Evaluating Qualitative Data Limitations
Qualitative data can provide rich professional insights but may be influenced by:
- Participant perspective
- Memory
- Organisational culture
- Interviewer influence
- Social desirability
Researchers can strengthen credibility by:
- Using multiple participants
- Comparing interviews with documentary evidence
- Applying consistent coding
- Reporting contrasting perspectives
Evaluating Quantitative Data Limitations
Quantitative datasets may appear objective but can still contain limitations involving:
- Missing data
- Measurement error
- Sampling bias
- Inconsistent definitions
- Limited sample size
Researchers should evaluate these factors before interpreting numerical relationships.
Process for Evaluating Reliability, Validity and Limitations
Step 1: Review the Research Objectives
Confirm what the data need to demonstrate.
Step 2: Review the Data Sources
Identify where information originated.
Step 3: Evaluate Collection Procedures
Determine whether data were collected consistently.
Step 4: Check Data Completeness
Identify missing or incomplete records.
Step 5: Check Data Consistency
Look for differences in terminology, measurements, and classifications.
Step 6: Assess Reliability
Determine whether the information is sufficiently consistent.
Step 7: Assess Validity
Determine whether the data actually represent the research variables.
Step 8: Identify Limitations
Document factors affecting evidence quality.
Step 9: Evaluate Limitation Impact
Determine how each limitation affects conclusions.
Step 10: Validate Findings
Use triangulation or additional evidence where possible.
Step 11: Qualify Conclusions
Ensure conclusions do not exceed the strength of the evidence.
Practical Example: Evaluating Electrical Inspection Data
Research Problem
A researcher investigates the effectiveness of electrical inspection procedures.
Collected Data
The study includes:
- Inspection records
- Defect reports
- Corrective action records
- Interviews with inspectors
Reliability Evaluation
The researcher discovers that different inspectors used slightly different defect classifications.
This creates a consistency limitation.
The researcher therefore standardises categories before analysis and documents the procedure.
Validity Evaluation
The researcher confirms that the records relate directly to electrical inspection performance.
However, inspection records alone do not fully demonstrate quality effectiveness.
The researcher therefore compares them with defect recurrence and corrective action information.
Limitation
The research covers only one project.
The researcher therefore avoids claiming that findings automatically apply to all electrical construction projects.
Case Study: Evaluating QA/QC Testing Data
Background
An electrical engineering organisation provides historical testing data for research into recurring commissioning failures.
Reliability Concerns
The researcher discovers:
- Different testing teams were involved
- Testing procedures changed during the project
- Some records lack complete contextual information
Validity Concerns
The researcher determines that testing results are relevant but cannot independently establish all potential causes of failure.
Mitigation
The researcher:
- Separates data according to testing period
- Documents procedure changes
- Compares testing data with inspection records
- Conducts professional interviews
- Identifies limitations in the final analysis
Outcome
The research produces more defensible conclusions because evidence quality and limitations have been explicitly evaluated.
Strategies for Improving Data Reliability and Validity
Researchers can strengthen evidence quality by:
- Developing standardised data collection procedures
- Defining variables clearly
- Using appropriate sampling methods
- Training data collectors
- Piloting questionnaires
- Verifying original records
- Comparing multiple evidence sources
- Maintaining data traceability
- Documenting analytical decisions
- Recording limitations transparently
Quality Assurance of the Research Dataset
Data quality checks should be conducted throughout the research.
Researchers should periodically assess:
- Completeness
- Accuracy
- Consistency
- Relevance
- Traceability
- Reliability
- Validity
This prevents errors from becoming embedded in the final analysis.
Maintaining an Evidence Audit Trail
An evidence audit trail provides a record of:
- Data source
- Collection date
- Collection method
- Processing procedure
- Analytical method
- Validation activity
- Interpretation decision
This allows another competent reviewer to understand how conclusions were developed.
Linking Reliability and Validity to Research Conclusions
The strength of conclusions should reflect the strength of evidence.
Where evidence is:
Strong and well validated
→ Conclusions can be more confident.
Where evidence is:
Limited or inconsistent
→ Conclusions should be more cautious.
Where evidence is:
Incomplete
→ Further research may be required.
This principle prevents researchers from making claims that exceed the available evidence.
Key Benefits of Evaluating Reliability and Validity
Stronger Research Credibility
Transparent evaluation increases confidence in the study.
More Defensible Conclusions
Researchers can demonstrate how evidence supports findings.
Improved QA/QC Decision-Making
Reliable information supports better quality improvement decisions.
Better Recognition of Uncertainty
Limitations are explicitly considered rather than hidden.
Improved Professional Accountability
Evidence-based decisions can be justified more effectively.
Stronger Research Recommendations
Recommendations can be aligned with the actual strength of the evidence.
Common Mistakes to Avoid
Researchers should avoid:
- Assuming all collected data are reliable
- Confusing accuracy with validity
- Treating correlation as proof of causation
- Ignoring missing information
- Hiding research limitations
- Generalising from an unsuitable sample
- Using inconsistent measurement procedures
- Ignoring contradictory evidence
- Reporting only favourable findings
Critical Evaluation Questions for Researchers
Before finalising the dataset, researchers should ask:
- Is the information sufficiently consistent?
- Does the dataset directly address the research question?
- Were collection procedures standardised?
- Are measurement conditions known?
- Are important records missing?
- Could bias have influenced the findings?
- Are the findings supported by multiple sources?
- What limitations affect generalisation?
- How much confidence should be placed in the conclusions?
These questions encourage critical rather than purely descriptive evaluation.
Conclusion
Evaluating the reliability and validity of collected data is essential for establishing the credibility of electrical engineering QA/QC research. Reliable data should demonstrate sufficient consistency and dependability, while valid data should accurately represent the variables and quality issues being investigated. Researchers must evaluate the source, collection process, measurement conditions, completeness, consistency, sampling approach, and relevance of the evidence before using it to support conclusions. Triangulation, data verification, standardised procedures, and transparent evidence trails can further strengthen research quality.
Research limitations must be evaluated as part of the evidence rather than treated as an afterthought. Factors such as limited samples, restricted access to records, measurement variation, incomplete information, participant bias, and changing project conditions can influence the reliability, validity, and applicability of findings. By explicitly identifying and evaluating these limitations, researchers can ensure that conclusions remain proportionate to the available evidence. This produces more credible QA/QC research and supports responsible, evidence-based improvements in electrical engineering quality, reliability, performance, and continuous improvement.